©Civil-Comp Press, 2012
Proceedings of the Eleventh International Conference
on Computational Structures Technology,
B.H.V. Topping, (Editor),
Civil-Comp Press, Stirlingshire, Scotland
Paper 152
Nonlinear Finite-Element Analysis of the
Shear Behaviour of Stud Connectors
Q. Wang1,2, Y.Q. Liu1 and J.P. Lebet2
1
Bridge Department, Tongji University, Shanghai, China
2
Steel Structures Laboratory (ICOM)
École Polytechnique Fédérale de Lausanne (EPFL), Switzerland
Abstract
This paper presents a nonlinear finite element model for a push-out specimen to study
on the shear mechanical behaviour of stud connectors. ABAQUS was used to build
the numerical models of push-out specimens, in which material nonlinearity of
concrete and stud was considered. The calculated results for the push-out specimens
were compared with the experimental results for verification. The nonlinear finiteelement models after verification can provide a good estimate of the mechanical
behaviour of the stud connectors in the push-out tests. An extensive parametric study
was conducted to analyse the effects of different concrete strengths, stud diameters
and applied tensile forces to the shear behaviour of the stud connectors. The shear
resistance of the stud connector increases as the stud diameter and concrete strength
increases, and the stud diameter has a greater effect than concrete strength; the shear
resistance of stud connector under combined forces decreases as the applied tensile
force increases.
Keywords: stud connector, finite element method, push-out tests, combined forces,
shear behaviour.
1
Introduction
Composite structures have obvious economic and structural advantages compared
with steel structures and concrete structures, respectively. Stud connector is the main
connector used in composite structures till now to resist the slip and separation
between concrete and steel. Stud connectors normally work under both tensile force
and shear force in many practical structures. The tensile force has to be considered
when Ften>0.1PRd [1] and it will influence the shear resistance of stud connectors in a
certain range.
Push-out experiment and beam experiment are normally used to measure the
mechanical behaviour of stud connectors. Driscoll and Slutter [2,3] gave the
1
conclusion that the results of push-out tests are the lower limit to estimate the shear
resistance of stud connectors through analyzing both kinds of experiments. All
equations in current design codes [1,4,5] to calculate the shear resistance of stud
connectors are empirical formula based on the statistical analysis of push-out tests
results.
Push-out experiment provides a convenient way to study the behaviour of shear
connector than beam tests, but still costly and time consuming. Many researchers
began to investigate the behaviour of stud connectors by using finite element model
simulation method, which also can predict the non-linear response and the ultimate
load capacity of the push-out test after the comparison with selective experimental
results and the verification of simulation method. Ellobody et al [6,7,8] developed an
accurate nonlinear finite element model to investigate the mechanical behaviour of
stud connectors in solid slabs and precast hollow core slab, the results obtained from
FE models were compared with experimental results and design strengths calculated
using several design codes. 2009, Nguyen and Kim [9] analyzed large stud
connectors of 22mm, 25mm, 27mm and 30mm using nonlinear finite element models
and observed that AASHTO LRFD specifications overestimated the capacity of large
stud connectors whereas the design rules specified in EC4\were generally
conservative for stud diameters of 22, 25 and 27 mm, and unconservative for
diameter of 30mm.
The main objective of the paper is to build a nonlinear finite-element model for pushout specimens of stud connectors. Material nonlinear was taken into account and
different stud diameters, concrete strengths and tensile forces were calculated.
Parametric study on the mechanical behaviour of stud connector was investigated in
the nonlinear finite element models.
1
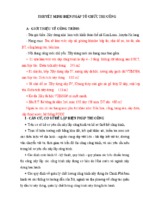
Push-out specimens
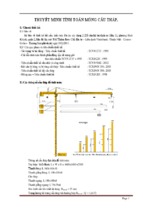
Push-out specimens were fabricated according to the standard push-out test
specimen in Eurocode 4 [1]. Stud diameter was considered as 22mm, 25mm, stud
length was 200mm, concrete strength was and stud of 22mm diameter was applied
tensile force at two sides of the specimen as shown in Figure 1 (a).
Symmetrical Surface
V
Jack
Rebar
Stud
Concrete
Jack
(a) Push-out Specimen
(b) 1/4 FE model with ABAQUS
Figure 1. Design of push-out specimen
2
SS-1
Pure
Shear
SS-2
Combined
Forces
SS-3
SS-4
Vsu (kN)
Value Mean Value
152.5
0
233.9
208.5
239.0
200
465
70.3
266.2
0
265.6
272.7
286.3
159.7
33.2
176.1
192.4
200
519
62.6
145.8
66.3
154.6
163.3
The ones with * were tested under cyclic loading
ds
(mm)
Specimen
1
2
3*
1
2
3*
1
2
1
2
hs
(mm)
22
25
22
22
fsu
(MPa)
fcu
(MPa)
Ns
(kN)
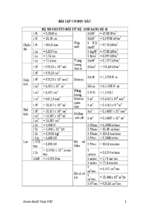
Table 1. Push-out specimens
In the above table:
ds: Shank Diameter (mm);
hs: Stud Height (mm);
fsu: Tensile Strength of Studs (MPa);
fcu: Cubic Compressive Strength of Concrete (MPa);
Ns:Tensile force (kN);
Vsu: Shear Resistance (kN).
3 Analytical Model
3.1 General
The finite element program ABAQUS was used to analyze the mechanical behaviour
of stud connectors. There are four main parts in push-out specimen: concrete blocks,
steel plates, reinforced bars and studs. In order to save the calculation cost, only 1/4
model was built, as shown in Figure 1 (b). Symmetrical constrains were applied to
simulate the real structure. Material nonlinearity was considered in the model.
Dynamic explicit analysis method was used to analysis the push-out model. It’s
more inexpensive than the implicit analysis, and also is very efficient to solve
discontinuous and contact problems.
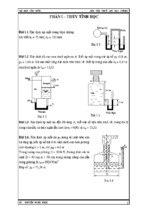
The concrete block, steel plate and stud were meshed with solid elements C3D8R,
which is an 8-node brick element with reduced integration stiffness; each model has
three translational degrees of freedom (DOF). The rebar was meshed with truss
element T3D2, which has three degrees of freedom. The whole model used coarse
mesh, with local fine mesh on stud and concrete block around stud connector to get
accurate calculated results. The overall mesh size was 12mm, and the element size on
stud and near stud was 3mm. The diameters of the rebar are 16mm and 20mm, which
were assigned on the elements with different truss sections. Figure 2 shows the mesh
models of different parts for push-out specimens.
3
C3D8R
T3D2
C3D8R
C3D8R
(a) Concrete
(b) Steel and stud
(c) Rebar
Figure 2. Finite Element Model
3.2 Material Models
3.2.1 Concrete material model
In this paper, concrete damaged plasticity model was used in the finite element
model. It assumes the main two failure mechanisms are tensile cracking and
compressive crushing of concrete material. The relationships between compressive
stress (σc) and inelastic strain (εin) and between inelastic strain (εin) and damage (dc)
are needed to define for the compressive behaviour; the relationships between tensile
stress (σt) and crack strain (εck) and between crack strain (εck) and damage (dt) are
needed to define for the tensile behaviour. The uniaxial stress-strain curves can be
converted into stress versus plastic-strain curves by ABAQUS automatically [10].
(a) Concrete under compression
The nonlinear behaviour of concrete material under uniaxial compression is
presented by an equivalent uniaxial stress-stress curve of concrete as shown in
Figure 3.
The curve for concrete material under compression is modeled in three phases: the
elastic phase, plastic ascending (hardening) phase and plastic descending (softening)
phase [11,12].
The first part is initially assumed to be the elastic range till the stress value 0.4(fcm) ,
where fcm is the mean value of concrete cylinder compressive strength [13].
Elastic phase where 0<εc< 0.4 fcm/Ec:
(1)
Hardening phase where 0.4 fcm/Ec<εc <εc1:
(2)
γε
Softening phase where εc >εc1:
4
(3)
Concrete Compress Stress σc
σc1 σc2
σc3
εc1
f cm
0.4f cm
Ec
εplc
Ec(1-dc)
Ec
εc/Ec
εinc
εelc
Concrete Compress Strain εc
Figure 3. Concrete stress-strain relationship for uniaxial compression
The evolution of the compressive damage component dc be calculated as follow
equations, as Eq.(4), where bc is a constant factor, 0<bc≤1.
E
1
(4)
E
The modulus Eci in softening phase was defined as
E
E
(5)
——the strain at maximum compressive stress;
γ ——the descent function
γ
l /G
(6)
Gcl: material crushing energy [12];
leq: the characteristic length of the respective FE integration point; which depends on
type, quadrature rule and form of the element [14].
bc: constant factor, which equals 0.7 [11];
Ec: Tangent modulus of elasticity of normal weight concrete;
εc: Compressive strain in the concrete;
σc: Compressive stress in the concrete;
fcm: mean value of concrete cylinder strength of concrete at 28 days;
ε : Compressive Plastic strain in the concrete;
To define the plasticity of concrete material under compression, there are several
parameters needs to be defined in ABAQUS, as given in Table 2 [10].
ψ
30o
σb0/σc0,
1.16
Ε
0.1
Table 2. Parameters defined for plasticity of concrete
5
Kc
0.667
In the above table:
ψ: Dilation angle;
ε: Flow potential eccentricity;
σb0/σc0: the ratio of initial equibiaxial compressive yield stress to initial uniaxial
compressive yield stress;
Kc: the ratio of the second stress invariant on the tensile meridian.
Concrete Tensile Stress σt
Concrete Tensile Stress σt
(b) Concrete material under tension
The nonlinear behaviour of concrete material under uniaxial tension is presented by
an equivalent uniaxial stress-stress and stress-crack curves of concrete as shown in
Figure 4. All stresses and deformations in the fracture process zone can be related to
a fictitious crack opening w [15].
f ctm
Ec
f ctm
0.2f ctm
GF=area under the
stress-crack opening relation
W1=GF/f ctm
Wc=5GF/f ctm
Crack Opening w
εtk
Concrete Tensile Strain εt
Figure 4. Concrete stress-strain and stress-crack opening relation for uniaxial tension
The tensile part curve can be assumed to increase linearly with respect to the strain
until the concrete crack. There are two phrases in the curve of concrete under tension:
the elastic phase and softening phase [12].
Tension Stiffening Set TYPE=GFI to define the post cracking behaviour by entering
the failure stress, fctm and the fracture energy Gf [16].
(7)
G
73f .
Tension Damage Set TYPE=DISPLACEMENT to specify the tensile damage
variable as a function of cracking displacement w.
3.2.2 Stud, structural and reinforcement steel materials
Two main mechanisms can cause the fracture of a ductile metal: ductile fracture due
to the nucleation, growth, and coalescence of voids; and shear fracture due to shear
band localization [10]. So ductile and shear criteria were used in stud material model
to simulate the damage initiation. Fracture strain, stress ratio and strain rate were
defined.
Two types of damage evolution, energy and displacement types, in conjunction with
two softening laws, linear and exponential, were used to describe the progressive
damage of stud material appropriately. Once the damage criterion is reached, the
stiffness of the material degrades following the softening law. The elastic-plastic
model of stud material is shown in Figure 5.
6
In this paper, all these parameters of stud’s ductile behaviour were calibrated for the
best agreement between analysis and experiment load-slip curves.
Undamaged
response
(d=0)
us
-d
stress
ys
Softening
Es
Degradation
E s of elasticty
ys
0pl
(1-d)E s
fpl
strain
Figure 5. Elastic-plastic model of stud material with progressive damage
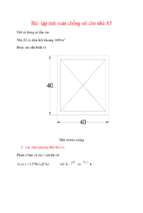
Tri-linear curve was used to simulate structural steel and reinforcement steel
materials, as shown in Figure 6, and the material properties are shown in Table 3.
Materials
Young’s Elasticity Modulus Es (MPa)
Poisson Ratio γ
The Failure Strength σy (σys) (MPa)
The Ultimate Strength σu (σus) (MPa)
Steel Plate
2.0E5
0.3
340
580
Stud Connector
1.9E5
0.3
370.4
465.5
Table 3. Stud, structural and reinforcement steel material
σ
σu
stress
σy
Es
εys
strain
εp
ε
Figure 6. Structural Steel and Reinforcement Steel Material Models
7
Rebar
1.9E5
0.3
370.4
465.5
3.3 Model Interactions and Constraints
The surface-to-surface formulation was used between steel beam surface, stud
surfaces and concrete slab surface. The interaction between steel beam surface and
concrete surface is frictionless, and ones between stud surfaces and concrete was set
with friction coefficient 0.3, hard contact was defined in normal direction. Rebar
elements were embedded in the concrete element, as shown in Figure 7.
Figure 7. Simulation between steel, stud, rebar and concrete
3.4 Loading and Boundary Conditions
This model used displacement control to apply the push force; the compulsive
displacement was applied on the top surface of steel plates. For the pull out force,
load was put on the surface of steel beam against stud. The loading time was got by
frequency analysis, and verified by experimental results.
The bottom surface of concrete block was fixed in all directions. And as 1/4 model,
there are two different symmetrical constrain surfaces, as shown in Figure 8.
Symmetrical
BC Surface
Loading Surface
Fixed Bottom
Figure 8. Boundary and Loading conditions
3.5 Analysis Results
Stud Deformation and stress and strain distribution of stud and concrete are shown
in Figure 9. Under the push load been applied on the top of steel plates, the stud
8
connectors have obviously shear deformation, and concrete under stud root has
plastic strain; at the end, the elements of stud roots fail and the structure cannot take
any more loads. Figure 9 (c) also shows the shank failure happened in push-out
experiments.
(a) Maximum Principle Plastic strain of concrete
(b) Mises stress of stud
Stud shank failure
(c) Failure elements on stud
Figure 9. Stress and strain distribution for studs
9
4
Verification FE models with the experimental results
Figure 10 shows the comparison of experimental results and calculated results from
the finite element models after parameters verification. It can be seen that the
calculated load-slip curves have a good agreement with the experimental results.
The finite element model can good estimate the experimental results of push-out
specimens. Table 4 gives the damage parameters of stud material after verification.
Fracture
strain
0.3
Ductile damage
Fracture
Softening
energy
law
3000
Linear
Fracture
strain
0.8
Shear damage
Displacement
Softening
at fail
law
1mm
Exponential
Table 4. Damage parameters of stud material
300
200
250
160
200
Load (kN)
Load (kN)
120
80
40
Experimental result
4
0
6
0
200
200
160
160
120
120
80
Experimental Result
40
2
4
6
8
10
slip (mm)
(b) 25mm diameterstuds under pure shear
Load (kN)
Load (kN)
slip (mm)
(a) 22mm diameter studs under pure shear
Experimental Result
FEM Calculated Result
FEM calculated rusults
2
100
50
0
0
150
80
40
Experimental Result
EFM Calculated Result
FEM Calculated Result
0
0
0
2
4
6
8
10
slip (mm)
(c) 22mm diameter studs under combined
force (Ns=33.2kN)
0
2
4
slip (mm)
6
(d) 22mm diameter studs under combined
force (Ns=66.3kN)
Figure 10. Comparison of FEM calculated results with experimental results
10
8
5
Parametric study
5.2 General
According to different parameters as stud diameter, concrete strength and applied
tensile forces, 11 nonlinear finite-element models was calculated as shown in Tab.5.
According to the formula given by Hiragi.H (2003) [17], the calculated tensile
resistance of 22mm studs with ultimate tensile strength 519MPa is 197.3kN.
Different tension besides ones been used in the experimental specimens were chosen
applied on the finite-element models.
Specimen
SS22-C60-N0
SS25-C40-N0
SS25-C50-N0
SS25-C60-N0
SS25-C70-N0
SS25-C80-N0
SS30-C60-N0
SS22-C50-N33.2
SS22-C50-N45
SS22-C50-N66.3
SS22-C50-N90
Stud
Diameter
d (mm)
22
25
25
25
25
25
30
22
22
22
22
Concrete
Strength
fck (MPa)
60
40
50
60
70
80
60
50
50
50
50
Tensile
force
Ns (kN)
0
0
0
0
0
0
0
33.2
45
66.4
90
Shear
Resistance
Vsu (kN)
153.7
215.1
224.9
238.5
250.6
259.3
315.3
157.4
155.7
155.2
153.7
Table 5. Parametric study of finite element models
5.3 Stud diameter and concrete strength
From former research we can know that stud diameter and concrete strength are the
main influence factors to the shear resistance of stud connectors. In this paper,
different concrete strengths were applied in the finite element models with 25mm
studs as 40MPa, 50MPa, 60MPa, 70MPa and 80MPa, and different stud diameters
were considered as 22mm, 25mm and 30mm. The calculated load-slip curves are
shown in Fig. 11. As stud diameter and concrete strength increases, the shear
resistance increases. The stud diameter has bigger effect than concrete strength to
the shear resistance of stud connectors. As the diameter of stud connector changes
from 22mm to 25mm, the shear resistance increases 55.14%; from 25mm to 30mm,
the shear resistance increases 32.2%. In the FE models, the concrete strength was
considered from C40 to C80, the shear resistance of stud connectors increases about
5% as from C40 to C50, C50 to C60, and so on. The diameter of stud has bigger
influence to the shear resistance of stud connectors than the concrete strength.
11
350
300
250
250
200
load (kN)
Load (kN)
300
150
100
SS22-C60-N0
SS25-C60-N0
SS30-C60-N0
50
0
0
2
4
6
200
150
SS25-C40-N0
SS25-C50-N0
SS25-C60-N0
SS25-C70-N0
SS25-C80-N0
100
50
0
8
0
Slip (mm)
(a) Stud diameter
2
4
6
8
Slip (mm)
(b) Concrete strength
10
Figure 11. Parametric Analysis
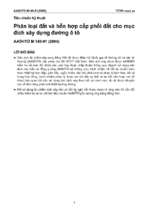
5.4 Different tensile strength
Figure 12 shows the load-slip curves of FE models under combined forces. The
tensile forces were considered as 33.2 kN, 45 kN, 66.3 kN and 90 kN separately.
And the shear resistances under tension are listed in Table 5. From the curves we
can know that when the load-slip curves first enter plastic phrase, the loads taken by
the specimens decreases as tensile force increases; the ultimate shear resistance of
specimens under combined tensile and shear forces has the same trend, not as
obviously as the initial phrase.
200
Load (kN)
160
120
80
SS22-C50-N33.2
SS22-C50-N45
40
SS22-C50-N66.3
SS22-C50-N90
0
0
1
2
3
4
slip (mm)
5
Figure.12 Effect of tensile strength
12
6
7
8
6
Conclusions
Nonlinear finite-element models were built in this paper to study on the mechanical
behaviour of stud connectors.
(1) Concrete damage-plastic model was used in the FE models; in which three
different phases were considered for the concrete equivalent uniaxial stressstrain curve under compression as: elastic phase, plastic ascending (hardening)
phase and plastic descending (softening) phase.
(2) For stud material, ductile and shear criteria were applied in stud material model
to simulate the damage initiation of studs, and energy type damage evolution
with exponential softening laws to describe the progressive damage.
(3) The calculated load-slip curves were compared with the experimental load-slip
curve, which proves that the nonlinear finite-element model after verification can
good estimate the load-slip curve of stud connecter under pure shear and
combined forces.
(4) An extensive parametric study of 11 specimens was performed by considering
different stud diameters, concrete strengths and applied tensile forces. The shear
resistance of stud connectors increases as stud diameter and concrete strength
increase, and the stud diameter has bigger influence to the shear resistance than
the concrete strength. Under combined forces, the shear resistance of stud
connector decreases as the applied tensile force increases.
Acknowledgements
The authors would like to thank Mr. Yao Zeng from Tongji University for his
technical support in the finite element analysis with ABAQUS.
References
[1]
[2]
[3]
[4]
[5]
[6]
BS EN 1994-2. "Eurocode-4: Design of composite steel and concrete
structures, Part 2: General rules and rules for bridges". 2005.
Driscoll G. C, and Stutter, R. G. "Research on Composite Design at Lehigh
University". In "Proceedings of Conference", AISC, May, 1961.
Stutter, R. G, and Driscoll, C. C. "Flexural Strength of Steel-Concrete
Composite Beams", in "Journal of the Structural Division", ASCE, Vol. 91, No.
ST2, April 1965.
AASHTO LRFD. "Bridge design specifications. 3rd ed". American
Association of State Highway and transportation Officials; 2004.
GB50017-2003. "Code for design of steel structures". Ministry of
Construction of China, Beijing: China Planing Press, 2003
Ellobody E. "Finite element modeling of shear connection for steel-concrete
composite girders". Ph.D. thesis. Leeds: School of Civil Engineering, The
University of Leeds; 2002.
13
[7]
[8]
[9]
[10]
[11]
[12]
[13]
[14]
[15]
[16]
[17]
Lam D, Ellobody E. "Behavior of headed stud shear connectors in composite
beam". In "Journal of Structural Engineering", ASCE 2005; 131(1): 96-107.
Ellobody E, Young B. "Performance of shear connection in composite beams
with profiled steel sheeting". In "Journal of Constructional Steel Research"
2006; 62: 682-94.
Huu Thanh Nguyen, Seung Eock Kim. "Finite element modeling of push-out
tests for large stud shear connectors". In "Journal of Constructional Steel
Research", 65 (2009), 1909-1920.
"ABAQUS analysis user's manual", Volume III: Materials. USA, 2010.
V. Birtel, P. Mark. "Parameterised finite element modeling of RC beam shear
failure, analysis user's manual", Volume III: Materials. USA, 2010.
Krätzig, W. B., "Pölling, R.. An elasto-plastic damage model for reinforced
concrete with minimum number of material parameters". In "Computers &
Structures". 82, 2004: 1201-1215.
BS EN 1992-1-1. "Eurocode-2: Design of concrete structures, Part 1-1:
General rules and rules for buildings". 2004.
Oliver J. "A consistent characteristic length for smeared cracking models". In
"International Journal for Numerical Methods in Engineering". 1989; 28: 46174.
Fédération Internationale du Beton (fib), "Constitutive modelling of high
strength/high performance concrete - STAR", Bulletin 42, January 2008
Fédération Internationale du Beton (fib). "fib Bulletin 55: Model Code 2010",
First complete draft –Volume, 2010
Hirokazu Hiragi, Shigeyuki Matsui, Takashi Sato, et al. "Pull-out and shear
strength equations for headed studs considering edge distance". In "Structural
Engineering/Earthquake. Engineering"; Vol.20, no.1, 2003: pp.69-80.
14
- Xem thêm -