World Air Conditioner Demand
by Region
April 2017
The Japan Refrigeration and Air Conditioning Industry Association
1
World Air Conditioner Demand by Region
April 2017
The Japan Refrigeration and Air Conditioning Industry Association
The Japan Refrigeration and Air Conditioning Industry Association (JRAIA) has just
summarized the estimated results of 2016 air conditioner (AC) demand in the main
countries around the world. These estimates are performed by the JRAIA’s Air
Conditioning Global Committee every year and were collected this time for AC demand
in the main countries during the past six years from 2011 to 2016.
Note: The AC demand summarized in this document stands for the total AC demand for
houses, buildings, and other structures comprising demand of “Room Air Conditioners
(RAC),” including window type and small-sized split type ACs as well as “Packaged Air
Conditioners (PAC).” Breakdown for RAC demand is given only from 2014 to 2016.
1. Overview
1) Overall AC Demand
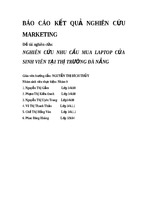
The 2016 world AC demand is estimated to reach 102.31 million units with a 2.9%
increase compared with the previous year. When dividing the 2016 AC demand
into the main markets of Japan, China, Asian countries other than Japan and China,
Europe, North America, and other countries, the largest market is China, whose
demand reached 40.59 million units with a 3.5% increase. Chinese demand
occupies 39.7% of the total world demand. The second largest market is Asia,
excluding Japan and China, whose demand reached 16.41 million units with a 8.4%
increase. The third largest market is North America, whose demand reached 14.60
million units with a 1.8% increase.
Japan reached 9.15 million units with a 2.8% increase, followed by Latin America
with 6.47 million units and a 11.7% decrease, and Europe with 6.07 million units and
a 12.2% increase.
2) “Room Air Conditioners (RAC)”
The 2016 world RAC demand is estimated to reach 88.81 million units with a 2.9%
increase compared with the previous year. The largest market is China, whose
demand reached 38.41 million units with a 3.5% increase. The second largest
market is Asia, excluding Japan and China, whose demand reached 14.93 million
units with a 8.8% increase. The third largest market is Japan, whose demand
reached 8.35 million units with a 3.1% increase.
North America reached 8.04 million units with a 0.9% decrease, followed by Latin
America with 5.78 million units and a 12.2% decrease, and Europe with 5.37 million
units and a 13.4% increase.
1
3) “Packaged Air Conditioners (PAC)”
The 2016 world PAC demand is estimated to reach 13.50 million units with a 3.0%
increase compared with the previous year. The largest market is North America,
whose demand reached 6.57 million units with a 5.2% increase. The second largest
market is China, whose demand reached 2.18 million units with a 2.8% increase.
The third largest market is Asia, excluding the countries of Japan and China, whose
demand reached 1.49 million units with a 4.6% increase. Japan reached 0.79 million
units with a 0.1% decrease, followed by Europe with 0.70 million units and a 3.5%
increase, and Middle East with 0.66 million units and a 4.1% decrease.
Note: The graph shows RAC and PAC demand by region from 2011 to 2016.
2. Target and Method to Survey
1) Scope and Division of Products
The targeted ACs are used for houses, buildings, and other structures, and
43.7
43.3
completed units including heat pump types for both cooling and heating. Portable
42.5
40.6
type ACs and fan coil units used for hydronic system39.8 excluded.
are
39.2
RAC demand consists of window type and small-sized split type ACs as well as
residential-use multi systems.
PAC demand consists of commercial-use medium/large-sized split type ACs, remote
(in
condenser type ACs, single packaged ACs, and VRF systems, including unitary typemillion units)
Residential air conditioners
ACs and unitary type heat pumps that are mainstream in North America.
Commercial air conditioners
2) Method to Survey
The JRAIA has collected and compiled the JRAIA market demand survey format
14.5 by the
reported14.3 14.6 member companies of the JRAIA’s Air Conditioning Global Committee,
14.1
Europe
13.5
12.5
and projected the estimated demand in each major market.
7.8
China
7.0 6.7
North America
Japan
5.6 5.4 6.1
………………………………………………………………………………….
9.8
9.3 8.9 9.1
9.1 9.3
Mid. East
'11 '12 '13 '14 excluding
* “Asia in total”: AC demand in Asia,'15 '16 5.3 5.5 countries of Japan and China.
5.4 5.3
4.2 4.3
* '12 '13 '14 '15 '16
'11 Period: from January to December in the calendar year
11 '12 '13 '14 '15 '16
'11 '12 '13 '14
* The AC 7.9 8.2
demand in and before 2015 have been revised and adjusted as necessary. '15 '16
16.4
7.3
7.2 7.3
6.5
Africa '11 '12 '13 '14 '15 '16
15.1
*
14.5
Latin AmericaFrom 2012 onward, estimated demand of VRF systems has been listed to be included in
13.7
13.1
2.1 2.4 2.6 2.6 2.5 2.6
12.2
PAC demand.
The VRF demand in each'12 '13 '14 '15 '16
'11 country is shown only if country demand exceeds 3,000
'11 '12 '13 '14 '15 '16 listed in Japan for the fiscal year from April to March.
units. The same is
Oceania
Asian
(ex. Japan & China)
1.0 0.9 1.0 1.1 1.1 1.1
'11 '12 '13 '14 '15 '16
'11 '12 '13 '14 '15 '16
2
The third largest market is Asia, excluding the countries of Japan and China, whose
demand reached 1.49 million units with a 4.6% increase. Japan reached 0.79 million
units with a 0.1% decrease, followed by Europe with 0.70 million units and a 3.5%
increase, and Middle East with 0.66 million units and a 4.1% decrease.
Note: The graph shows RAC and PAC demand by region from 2011 to 2016.
2. Target and Method to Survey
1) Scope and Division of Products
The targeted ACs are used for houses, buildings, and other structures, and
completed units including heat pump types for both cooling and heating. Portable
type ACs and fan coil units used for hydronic system are excluded.
RAC demand consists of window type and small-sized split type ACs as well as
residential-use multi systems.
PAC demand consists of commercial-use medium/large-sized split type ACs, remote
condenser type ACs, single packaged ACs, and VRF systems, including unitary type
ACs and unitary type heat pumps that are mainstream in North America.
2) Method to Survey
The JRAIA has collected and compiled the JRAIA market demand survey format
reported by the member companies of the JRAIA’s Air Conditioning Global Committee,
and projected the estimated demand in each major market.
………………………………………………………………………………….
* “Asia in total”: AC demand in Asia, excluding countries of Japan and China.
* Period: from January to December in the calendar year
* The AC demand in and before 2015 have been revised and adjusted as necessary.
* From 2012 onward, estimated demand of VRF systems has been listed to be included in
PAC demand.
The VRF demand in each country is shown only if country demand exceeds 3,000
units. The same is listed in Japan for the fiscal year from April to March.
3
(1)Overall AC demand
(1) Overall AC demand
UAE
2011
99,791
9,057
90,734
43,729
12,217
3,547
1,638
659
933
1,227
922
816
561
724
551
70
147
162
69
68
123
4,246
1,581
497
462
524
248
189
144
274
77
69
181
7,760
1,035
2,625
977
643
400
240
415
161
126
92
104
73
110
66
72
53
568
12,525
12,126
399
7,157
3,492
1,331
889
401
167
159
113
121
128
150
89
2012
97,593
9,271
88,322
39,843
13,065
3,500
2,030
917
1,112
1,190
987
871
611
623
538
80
164
163
77
79
123
4,279
1,666
493
447
516
217
179
147
296
82
68
168
6,961
919
2,000
1,107
516
355
278
366
154
127
106
113
70
69
55
66
48
612
13,505
13,097
408
7,333
3,514
1,352
1,021
413
176
169
100
128
111
129
98
2013
104,367
9,817
94,550
43,308
13,672
3,633
2,246
998
1,163
1,236
952
902
664
613
539
123
156
163
81
80
123
5,300
2,226
713
452
495
297
275
214
315
82
69
162
6,739
958
1,891
1,027
510
362
229
339
153
129
101
95
69
66
53
61
49
647
14,060
13,662
398
7,943
4,212
1,302
1,034
371
187
170
102
86
117
133
106
117
2,130
747
412
203
172
180
122
122
2,417
803
488
215
176
174
131
95
123
2,555
765
566
221
206
189
132
97
294
970
861
102
7
335
919
817
95
7
379
973
869
97
7
4
2014
103,779
9,336
94,443
42,477
14,538
3,862
2,286
1,229
1,315
1,236
1,014
898
687
672
538
180
170
162
85
81
123
5,501
2,238
737
562
495
321
284
217
320
78
77
173
5,619
772
1,442
776
477
348
180
233
167
128
87
88
77
65
57
56
51
615
14,461
14,061
400
8,202
4,451
1,299
1,073
330
210
161
103
71
115
134
116
53
86
2,595
781
603
232
205
159
135
97
54
329
1,050
946
97
7
2015
99,355
8,899
90,456
39,222
15,146
4,063
2,202
1,607
1,388
1,253
1,014
878
717
675
531
181
183
158
90
84
123
5,384
2,164
763
589
517
320
286
225
193
77
76
174
5,411
870
926
787
644
408
186
184
169
138
93
92
82
67
55
57
51
602
14,348
13,916
431
7,324
3,729
1,195
1,037
322
235
161
103
71
115
103
116
53
83
2,526
782
549
225
194
159
135
97
54
329
1,096
985
105
6
(in thousands)
2016
102,311
9,146
93,165
40,587
16,411
4,507
2,300
1,984
1,561
1,252
1,005
936
800
720
530
206
185
157
110
88
71
5,264
1,926
731
577
729
296
278
211
187
80
80
169
6,070
1,029
1,012
790
713
453
210
195
168
150
134
105
92
77
60
57
52
776
14,603
14,163
440
6,469
2,906
1,062
1,078
312
277
149
128
113
113
103
92
53
83
2,633
758
505
253
229
155
130
92
58
453
1,128
1,008
114
6
(2)Room Air Conditioners (RAC)
(2) Room Air Conditioners (RAC)
UAE
Europe
North America
2011
87,565
8,279
79,286
41,425
11,056
3,383
1,588
632
855
635
900
749
515
697
517
65
135
141
67
62
115
3,639
1,439
341
425
422
209
158
102
253
65
62
163
7,037
977
2,523
916
521
305
225
403
76
83
87
101
59
97
62
69
37
496
6,726
6,580
146
6,661
3,243
1,302
809
377
156
143
108
113
111
106
88
2012
85,105
8,487
76,618
37,756
11,823
3,333
1,941
877
1,028
622
939
793
563
593
506
74
150
141
75
73
115
3,681
1,522
342
405
418
184
148
103
274
70
61
154
6,269
872
1,884
1,025
424
269
266
353
73
84
101
111
57
60
52
63
33
542
7,545
7,400
145
6,584
3,147
1,295
850
388
160
150
95
117
94
83
96
2013
91,432
9,013
82,419
41,148
12,379
3,446
2,153
956
1,072
668
901
821
608
583
506
117
142
140
78
73
115
4,667
2,051
570
415
398
261
241
163
286
70
62
150
6,048
915
1,771
944
413
279
219
325
73
84
96
93
56
59
50
59
34
578
7,894
7,754
140
7,145
3,809
1,248
847
349
170
151
97
78
99
83
104
105
1,910
675
386
149
160
177
111
109
2,168
733
458
153
165
171
119
82
110
2,294
696
533
158
192
186
120
84
252
832
741
85
6
287
792
706
80
6
325
844
756
82
6
5
2014
90,704
8,500
82,204
40,325
13,196
3,674
2,198
1,178
1,203
668
960
811
628
640
505
174
152
135
81
74
115
4,843
2,063
577
519
398
282
252
166
290
66
70
160
4,974
731
1,349
700
377
275
170
225
84
85
80
86
63
58
54
54
35
548
8,237
8,092
145
7,393
4,028
1,261
882
311
190
141
98
66
97
82
114
43
80
2,337
717
567
173
191
156
122
84
44
283
899
811
82
6
2015
86,244
8,104
78,140
37,103
13,724
3,847
2,109
1,546
1,268
667
959
789
651
644
499
174
164
130
85
77
115
4,699
1,980
594
535
418
280
250
173
174
65
69
161
4,731
821
861
708
511
324
177
178
80
92
85
90
66
60
52
55
36
535
8,107
7,958
149
6,583
3,349
1,166
847
303
212
141
98
66
97
64
114
43
83
2,267
718
517
163
180
156
122
84
44
283
926
830
90
6
(in thousands)
2016
88,807
8,352
80,455
38,409
14,923
4,282
2,209
1,912
1,423
666
950
843
731
679
497
197
166
129
103
81
55
4,607
1,746
570
525
635
257
243
162
170
70
73
156
5,366
976
951
710
578
363
197
188
80
103
126
103
75
69
57
55
36
700
8,038
7,881
157
5,782
2,578
1,035
891
293
253
128
123
108
93
64
90
43
83
2,385
695
477
200
215
152
117
79
48
402
946
843
97
6
(3)Breakdown for
RAC demand
(3) Breakdown for RAC
2014
14,384
UAE
Europe
North America
14,384
325
1,846
703
9
2
3
12
216
5
418
40
312
4
31
5
1
25
60
2,494
1,385
320
196
10
164
170
92
83
31
1
42
90
5
29
0
6
4
0
4
1
4
1
1
1
0
0
0
0
34
7,647
7,578
69
1,564
758
118
271
83
48
30
23
24
24
40
100
23
22
347
76
92
25
34
13
3
1
1
102
71
68
2
1
2015
76,320
8,500
67,820
40,000
11,350
2,971
2,189
1,176
1,200
656
744
806
210
600
193
170
121
130
80
49
55
2,349
678
257
323
388
118
82
74
207
35
69
118
4,884
726
1,320
700
371
271
170
221
83
81
79
85
62
58
54
54
35
514
590
514
76
5,829
3,270
1,143
611
228
142
111
75
42
73
42
14
20
58
1,990
641
475
148
157
143
119
83
43
181
828
743
80
5
13,879
13,879
303
1,840
705
9
2
3
11
205
5
425
38
312
4
30
5
1
25
60
2,360
1,300
320
192
10
158
156
92
59
30
1
42
76
6
19
0
5
4
0
4
1
4
1
1
1
0
0
0
0
30
7,400
7,335
65
1,483
685
116
281
74
48
30
23
24
24
33
100
23
22
352
80
92
26
34
13
3
1
1
102
65
62
2
1
6
2016
72,365
8,104
64,261
36,800
11,884
3,142
2,100
1,544
1,265
656
754
784
226
606
187
170
134
125
84
52
55
2,339
680
274
343
408
122
94
81
115
35
68
119
4,655
815
842
708
506
320
177
174
79
88
84
89
65
60
52
55
36
505
707
623
84
5,100
2,664
1,050
566
229
164
111
75
42
73
31
14
20
61
1,915
638
425
137
146
143
119
83
43
181
861
768
88
5
13,119
13,119
309
1,730
620
9
2
3
11
198
4
487
34
299
4
30
4
1
24
2,080
1,091
305
177
10
137
151
85
57
27
1
39
66
6
14
0
5
4
0
3
1
3
1
1
1
0
0
0
0
28
7,288
7,223
65
1,236
532
105
239
73
42
23
23
20
25
33
76
23
22
353
80
75
26
32
10
3
1
3
123
58
55
2
1
75,688
8,352
67,336
38,100
13,193
3,662
2,200
1,910
1,420
655
752
839
244
645
198
193
136
125
102
57
55
2,527
655
265
348
625
120
92
77
113
43
72
117
5,300
970
937
710
573
359
197
185
79
100
125
102
74
69
57
55
36
672
750
658
92
4,546
2,046
930
652
220
211
105
100
88
68
31
14
20
61
2,032
615
402
174
183
142
114
78
45
279
888
788
95
5
(4)Packaged Air Conditioners (PAC)
(4) Packaged Air Conditioners (PAC)
2011
12,226
778
11,448
2,304
1,161
164
50
27
78
592
22
67
46
27
34
5
12
21
2
6
8
607
142
UAE
156
37
102
39
31
42
21
12
7
18
723
Europe
58
102
61
122
95
15
12
85
43
5
3
14
13
4
3
16
72
5,799
North America
5,546
253
496
249
29
80
24
11
16
5
8
17
44
1
2012(VRF)
2012
12,488
994
784
125
11,704
869
2,087
500
174
1,242
167
26
89
6
40
5
84
4
568
101
48
8
78
5
48
3
30
32
3
6
14
22
8
2
6
8
598
13
144
3
151
3
42
98
33
31
44
22
12
7
14
692
124
47
13
116
12
82
22
92
8
86
15
12
13
81
15
43
10
5
2
13
9
3
3
15
70
18
5,960
26
5,697
22
263
3
749
17
367
8
57
171
3
25
16
19
5
11
17
46
2
12
220
72
26
54
12
3
11
13
249
70
30
62
11
3
12
13
42
138
120
17
1
48
127
111
15
1
5
3
11
10
2013(VRF)
2013
12,935
1,104
804
126
12,131
978
2,160
597
1,293
171
187
22
93
7
42
6
91
5
568
100
51
8
81
5
56
4
30
33
4
6
14
23
7
3
7
8
633
14
175
143
3
37
97
36
34
51
29
12
7
12
691
128
43
12
120
13
83
24
97
7
83
15
10
14
80
15
45
10
5
2
13
4
7
3
2
15
69
18
6,166
31
5,908
27
258
4
798
21
403
12
54
187
3
22
17
19
5
8
18
50
2
13
261
69
33
63
14
3
12
13
5
3
54
129
113
15
1
11
10
7
2014(VRF)
2014
13,075
1,180
836
134
12,239
1,046
2,152
653
1,342
181
188
25
88
9
51
8
112
5
568
100
54
9
87
5
59
4
32
33
5
6
18
27
7
4
7
8
658
20
175
3
160
4
43
97
4
39
32
51
30
12
7
13
645
123
41
12
93
11
76
28
100
7
73
15
10
8
83
17
43
11
7
2
14
3
7
3
2
16
67
11
6,224
30
5,969
27
255
3
809
22
423
13
38
191
3
19
20
20
5
5
18
52
2
10
6
258
5
64
36
59
3
14
3
13
13
10
46
151
12
135
11
15
1
2015(VRF)
2015
13,110
1,156
795
129
12,315
1,027
2,119
611
1,422
195
216
30
93
7
61
10
120
6
586
103
55
10
89
6
66
6
31
32
5
7
19
28
8
5
7
8
685
22
184
3
169
5
54
3
99
4
40
36
52
19
12
7
13
680
126
49
14
65
7
79
29
133
8
84
17
9
6
89
18
46
11
8
2
16
4
7
3
2
15
67
11
6,241
34
5,958
30
282
3
741
22
380
12
29
190
4
19
23
20
5
5
18
39
2
10
0
259
5
64
32
62
3
14
3
13
13
10
46
170
12
155
11
15
0
(in thousands)
2016(VRF)
2016
13,503
1,312
794
131
12,709
1,181
2,178
710
1,488
220
225
32
91
8
72
12
138
8
586
103
55
10
93
7
69
7
41
5
33
8
9
19
28
9
7
7
16
8
657
24
180
3
161
5
52
3
94
6
39
35
49
17
10
7
13
704
145
53
18
61
6
80
33
135
10
90
20
13
4
7
89
19
47
12
8
3
17
4
8
3
2
16
75
14
6,565
38
6,282
33
283
5
687
23
328
10
27
187
4
19
24
21
5
5
20
39
2
10
0
249
6
63
28
53
4
14
3
13
13
10
51
182
15
165
14
18
0
World Air Conditioner Demand by Region
April 2017
The Japan Refrigeration and Air Conditioning Industry Association
3-5-8, Shibakoen, Minato-ku
Tokyo, 105-0011 JAPAN
TEL:Tokyo (03)3432-1671 FAX:Tokyo (03)3438-0308
http://www.jraia.or.jp
8
- Xem thêm -