ACADEMY ENGLISH CENTER
IELTS Writing Practice Task One-Volume 1
Test 1.1:
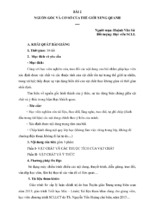
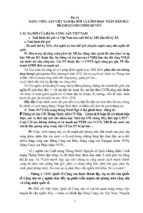
The line graph shows estimated sales of gold in Dubai for 12 months in 2002 in millions of dirhams. There
were two main seasons for gold sales.
The main season for sales is in the December to May period. Sales were consistently above 200
million dirhams per month, rising sharply to a peak of 350 million dirhams in March. However, for the next
four months, sales declined steadily, reaching an annual low of 120 million dirhams in July.
In August, there was a sudden increase. Sales almost doubled, rising from 120 million dirhams in July
to 210 million dirhams in August. This was followed by a drop in September, back to the July figure.
From September to October, sales recovered, from 120 to 180 million. In October and November,
sales remained steady, and there was a small increase in December to 190 million dirhams.
In conclusion, the main sales period is in the early part of the year, slumping in the summer, except for
a sudden increase in August.
Test 1.2:
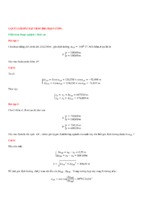
The graph compares the rate of smoking in men and women in Someland between the years 1960 and 2000. It
can be clearly seen that the rate of smoking for both men and women is currently declining and that fewer
women have smoked throughout the period.
In 1960, 600 men in every 1,000 was smoking. This number decreased gradually to 500 by 1974 and
continued to decrease but more steeply to 250 in 2000. In contrast, the rate of smoking in women in 1960 was
very low at only 80 in every 1,000. By 1968 this increased to 170, and increased again but more steeply to
320 in 1977. The rate of female smokers then remained stable at 320 until 1984 at which point the figures
began to decline and had dropped to 200 by 2000.
In conclusion we can see that the rate of smoking in men dropped throughout the whole period but was always
at a higher level than the female figures. The rate of smoking in women increased until 1977 but then
decreased for the rest of the period.
Test 1.3:
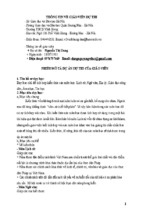
The graph shows people using new music places on the Internet in fifteen days period of time namely personal choice
and trendy pop music.
The overall trend shows fluctuation with slight Increased towards the end of the period.
Starting with Music Choice websites; 40,000 poeple went on this new site on first-day. Half of them backed out the
next day. In Contrast to this Pop Parade net sites were visited by 120,000 music lovers on day one which decreased
slightly on the next day thereafter regaining the same fame on 3rd day.
After 3rd day the enthusiasm for both music lines on Internet dropped slowly- reaching maximum fall of 40,000 on
7th day. Whereas Music choice gained popularity, slightly Improoving to get the original strength of 30,000 viewers on
screen, but was getting still less visiters than their opponent Pop group i.e. 40,000 on day 7.
ACADEMY ENGLISH CENTER
IELTS Writing Practice Task One-Volume 1
In the biegining of the next week both gained remarkable recovery after a few fluctuations for 8th and 9th day
having 40,000 and 50,000 visiters respectively, reaching to their peaks of one and a half thousand new viewers for Pop
Parade on 11th day showing a contrast of very few people visiting Music choice for the same day. Thereafter Music
choice gained popularity on 12th day for having more than 120,000 new visiters on web.
In the end of the period Pop sites were visited by maximum viewers of 180,000 whereas sites located to Music
choice were not explored by more than 80,000 explorers on the last day of the report.
(257 words)
This is an answer written by a candidate who achieved a Band 6 score. Here is the examiner's comment:
Well organized with some good linking devices and collocations (gain popularity, remarkable recovery, decrease
slightly) and some valid comparison of the music sites. However, some sentences are long and confusing (paragraph 5),
some collocations are inaccurate (slight increased, reaching to their peaks) and there is some repetition (7th day, 3rd
day, 11 th day). Some words are spelt incorrectly (poeple, Improoving, visiters, biegining).
Test 1.4:
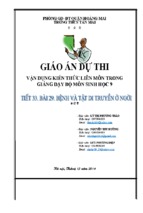
The chart shows striking changes in the fertility rate of women in six Gulf countries – Saudi Arabia, the UAE,
Oman, Qatar, Kuwait and Bahrain between 1990 and 2000.
In the ten year period, there was a decline in the number of births per woman in all countries. The
biggest declines were in two countries which had low fertility rates at the start of the decade, Bahrain and the
UAE.
Fertility rates vary greatly between the six countries. Oman and Saudi Arabia had the highest rates,
with over seven births per woman in 1990. This compared with around 4 births per woman in Bahrain and the
UAE, and just 3.75 in Kuwait
By 2000, the rate had fallen below three births per woman in Kuwait, Bahrain and the UAE, with a
drop of over 25% in a decade in the UAE. However, in Saudi Arabia and Oman, the rates fell by just 20%,
from 7.0 to 5.5.
In summary, there were major decreases in birth rates in all countries, but some countries in the region have
double the fertility rate of others.
(157 words)
Test 1.5:
The graph shows Oil Production Capacity in millions of barrels per day for selected Gulf countries. There are
several features in this graph.
The most significant feature is that oil production will increase sharply in almost all the countries
shown. Kuwait and Iraq are both expected to double their output between 1990 and 2010, with Kuwait's
production rising from 1.8 million barrels per day (bpd) in 1990 to 3.8 in 2010. Iran will also increase its
ACADEMY ENGLISH CENTER
IELTS Writing Practice Task One-Volume 1
output by a slightly smaller amount. After remaining steady at 2.5 million bpd from 1990 to 2000, the UAE's
output is expected to approach 4.0 million bpd in 2010. Only Qatar's production is predicted to fall, back to
0.8 million bpd after a slight rise in 2000.
However, the greatest increase will be from Saudi Arabia. In 1990, its output capacity at 8.5 million
bpd exceeded the combined production of Iran, Iraq and Kuwait. This lead is expected to continue with a 75%
increase in production to 14.5 million bpd 2010.
In summary, while most of the countries are expected to show increases, Saudi Arabia will maintain and
strengthen its position as the major producer.
Test 1.6:
The graphs show health and education spending and changes in life expectancy and infant mortality in the
UAE. Overall, as the percentage spent on health and education increases, infant mortality and life expectancy
improve.
Graph 1 shows the percentage of GDP spent on health and education between 1985 and 1993. There
were big increases in both areas. Health spending stood at about 8% in 1985 but rose to 9% in 1990 and 10%
in 1993. Spending on education was even higher. It was 10% in 1985, and shot up to 14% in 1990 and 15% in
1993, a 50% increase in just 8 years.
Graph 2 shows improvements in life expectancy and infant mortality between 1970 and 1992. Life
expectancy was just 60 in 1970 but rose to almost 72 in 1992. In contrast, the number of babies dying dropped
dramatically, from 60 per 1000 in 1970 to only 22 in 1992.
In conclusion, people in the UAE are living longer and healthier lives because of the government's spending
on education and medical facilities.
Test 1.7:
The pie charts compare the highest level of education achieved by women in Someland across two years,
1945 and 1995. It can be clearly seen that women received a much higher level of education in Someland in
1995 than they did in 1945.
In 1945 only 30% of women completed their secondary education and 1% went on to a first degree. No
women had completed post-graduate studies. This situation had changed radically by 1995. In 1995, 90% of
women in Someland had completed secondary education and of those, half had graduated from an initial
degree and 20% had gone on to postgraduate studies. At the other end of the scale we can see that by 1995 all
girls were completing lower secondary, although 10% ended their schooling at this point. This is in stark
contrast with 1945 when only 30% of girls completed primary school, 35% had no schooling at all and 35%
only completed the third grade.
ACADEMY ENGLISH CENTER
IELTS Writing Practice Task One-Volume 1
In conclusion, we can see that in the 50 years from 1945 to 1995 there have been huge positive developments
to the education levels of women in Someland.
Test 1.8:
The pie chart shows the worldwide distribution of sales of Coca-Cola in the year 2000 and the graph shows
the change in share prices between 1996 and 2001.
In the year 2000, Coca-Cola sold a total of 17.1 billion cases of their fizzy drink product worldwide.
The largest consumer was North America, where 30.4 per cent of the total volume was purchased. The second
largest consumer was Latin America. Europe and Asia purchased 20.5 and 16.4 per cent of the total volume
respectively, while Africa and the Middle East remained fairly small consumers at 7 per cent of the total
volume of sales.
Since 1996, share prices for Coca-Cola have fluctuated. In that year, shares were valued at approximately $35.
Between 1996 and 1997, however, prices rose significantly to $70 per share. They dipped a little in mid-1997
and then peaked at $80 per share in mid-98. From then until 2000 their value fell consistently but there was a
slight rise in mid-2000.
Test 1.9:
The diagrams show data for a flu epidemic which hit a large country town in 1996. Figure 1 gives the number
of persons who died; Figure 2 shows the percentage breakdown of females who received a new flu vaccine;
and Figure 3 gives the number of cases of flu before and during the epidemic.
In Figure 1 it can be seen that the flu was responsible for the deaths of 2 females but no males in the
period from March to May. However, from June to August, there were 4 female deaths and 1 male death.
According to the pie chart in Figure 2, only those females most at risk were given the new flu vaccine;
28% did not take part in the trial. Of those females who took part, 35% were aged (over 65 years old); 24%
were babies or children; and 13% were either hospitalised or receiving other medical attention.
From Figure 3 it is clear that the new vaccine had a positive effect on the number of new cases of flu
reported in females. There were just over 1000 cases reported in March, climbing rapidly to a peak of 3500 in
June. Thereafter, the number of cases dropped slowly to about 2800 in August, before levelling off at 2500 for
the rest of the year. For males, the figures were lower but showed a similar trend throughout the epidemic.
(232 words)
Test 1.10:
ACADEMY ENGLISH CENTER
IELTS Writing Practice Task One-Volume 1
A glance at four indicators of economic and social conditions in four countries, Canada, Japan, Peru and
Zaire, in 1994 reflects the great differences that exist between wealthier and poorer nations.
The table shows that Japan and Canada had annual incomes of $15 760 and $11 100 per person,
respectively. These figures were overwhelmingly greater than the corresponding figures of $160 in Peru and
$130 in Zaire.
Health indicators, too, reflected overall levels of affluence in the four nations. Life expectancy at birth,
for example, was higher among the more economically developed countries. Japan reported the highest life
expectancy, 78. This was followed by Canada, 76; Peru, 51; and Zaire, 47; This suggests that richer societies
are able to put more money into health care than poorer ones.
The amount of calories consumed daily per person roughly followed the same ranking. Canadians each
consumed some 3 326 calories per day while the Japanese took 2846 calories. The corresponding figures for
Peru and Zaire were 1927 and 1749, respectively.
Literacy rates among adults, too, were higher in wealthier countries, no doubt a reflection of ability to
invest in education. Canada and Japan both reported literacy rates of 99%, while Peru claimed 68%. Zaire, the
least economically developed of the four countries, had a literacy rate of 34%.
The data appear to confirm the often cited link between national wealth and health and education standards.
Test 1.11:
The table shows how people in different age groups spend their leisure time in Someland over the course of a
year. It can be clearly seen that the amount of leisure time available varies considerably across the age groups
and that people of different age levels have very different ways of spending their leisure time.
According to the figures, as people age in Someland their social lives reduce. Teenagers and people in
their twenties spend on average 500 hours per year on socialising and 350 hours of that time is with a group of
more than 4 people. Although the total hours of socialising in their 30s, 40s, 50s and 60s is fairly constant
(between 300-350), socialising with more than 4 people drops dramatically to 50 hours in the 30s and 40s age
groups and only 25 from 50 years old. Group and individual exercise follow a similar pattern.
People of all ages spend a good part of their leisure time on entertainment such as TV/video viewing
and cinema. In both cases, teenagers and retired people spend around twice as much time as those who are at
working age. Home entertainment ranges from just over a thousand hours for teenagers and retired people and
an average of 600 hours for everyone else. Cinema accounts for 100 hours of the teenagers and retired
people’s leisure time and 25-50 hours for the rest.
In conclusion we can see there is a significant trend towards solitary and smaller group activities as people
grow older and that teenagers and retired people spend a lot more time on entertainment than those of working
age do.
ACADEMY ENGLISH CENTER
IELTS Writing Practice Task One-Volume 1
Test 1.12:
Gaining work experience prior to graduation helps university students to succeed in getting their first job. For
this reason, some universities insist that all students must complete a Work Experience Requirement.
Completing the following six stages results in the requirements’ fulfillment.
The process begins with the Application stage. A student reviews an approved list of workplaces and
submits applications to places where he would like to work. Next is the Approval stage. When a student
receives an acceptance letter, he gives it to the professor for approval. The third stage, Schedule, requires a
student to arrange his work schedule. The student should work at least 10 hours/week over 20 weeks. Reports
are next. The student must complete a Weekly Report Form and turn it in to the professor every Friday.
The fifth stage, Evaluation, takes place during the final work week. A student participates in an
evaluation meeting with his work supervisor, who submits an Evaluation Form. The last stage requires that a
student submit a Final Report before the last week of spring semester.
By following these stages and subsequently submitting the final report, the student receives credit
from the university.
(192 words)
- Xem thêm -