Mô tả:
TRUNG TÂM LUYỆN THI IELTS Fighter
website: ielts-fighter.com
Cách viết đoạn mở bài Writing task 1
Các bạn nên bắt đầu viết task 1 (viết đoạn mở bài)
bằng cách nêu lại những thông tin đã được đưa ra
trong phần đề bài. Chỉ cần viết 1-2 câu để chỉ ra
biểu đồ này đang trình bày về vấn đề gì và mốc
thời gian nào (nếu có) là đủ.
Để làm được điều này (viết đoạn mở bài) thì
paraphrase nội dung từ đề bài là cách tốt nhất mà
bạn nên áp dụng.
Một ví dụ mở bài hay mà bạn có thể áp dụng theo.
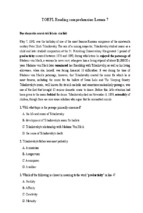
Question:
The graphs below give information about computer ownership as a
percentage of the population between 2002 and 2010, and by level of
education for the years 2002 and 2010.
Introduction:
The bar charts show data about computer ownership, with a further
classification by level of education, from 2002 to 2010.
Nhưng lưu ý để viết một đoạn mở bài 9.0
IELTS Fighter – The Leading IELTS Training Center in VN
Ms Ngọc Cúc
1
TRUNG TÂM LUYỆN THI IELTS Fighter
website: ielts-fighter.com
1. Đa dạng hóa các cụm từ giới thiệu
➢ the graph/chart/table/diagram
◦ gives information about/on
◦ provides information about/on
◦ shows
◦ illustrates
◦ represents
◦ depicts
◦ gives reason why (đưa ra lý do nếu biểu đồ đưa ra lý do cho
vấn đề nào đó)
◦ explains why ( chỉ dùng nêu biểu đồ có đưa ra giải thích)
◦ compares (chỉ khi có một vài nội dung được so sánh)
Chú ý với từ “compare”, các bạn có thể nói:
➢ compares smth in terms of smth
the charts compare two cities in terms of the number of
employed people.
➢ compares smth in year1 and year2
the graph compares the population in 2000 and 2013.
Ví dụ
◦ “The pie charts provide information on the proportion of males and
females working in agricultural sector.” OR “The pie charts show the
proportion of males and females working in agricultural sector.”
◦ “The table compares five companies in terms of the number of
employees.” OR “The table illustrates the number of employees in five
IELTS Fighter – The Leading IELTS Training Center in VN
Ms Ngọc Cúc
2
TRUNG TÂM LUYỆN THI IELTS Fighter
website: ielts-fighter.com
companies.”
2. Paraphrasing
Sử dụng từ “how”:
◦ shows the number of people ... = shows how many people ...
◦ depicts changes in spending on ... = depicts how much changed
spending on ...
Sử dụng từ đồng nghĩa:
◦ number of = quantity of (không dùng thay thế với an amount of)
◦ spending = expenditure
◦ rate = percentage
◦ ratio = proportion
◦ information = data
◦ change can be sometimes replaced by increase, decrease or
variation
◦ share = portion
◦ place = site
3. Diễn đạt khoảng thời gian
◦ from 1985 to 1995 = between 1985 and 1995
◦ in 1985 = in the year 1985
◦ in 1985 and 1995 = in 1985 and 1995 respectively = in the years
1985 and 1995
Ví dụ:
IELTS Fighter – The Leading IELTS Training Center in VN
Ms Ngọc Cúc
3
TRUNG TÂM LUYỆN THI IELTS Fighter
website: ielts-fighter.com
◦ The table shows consumption rates from 2001 to 2004.
◦ The graph shows consumption rates in 2012 and 2015 respectively.
Thực hành cách paraphrase:
Hãy cùng theo dõi cách paraphrase câu
hỏi đề bài để viết được một phần mở bài
tốt.
Những phần được thay đổi là:
•
Show được chuyển thành compare
•
Percentages được thêm vào
•
Different được thêm vào
•
In 2007 and 2009 → In the years
2007 and 2009
Các bạn có thể thấy, chúng ta không cần
phải sang tạo ra một đoạn mở bài hoàn toàn mới. Điều các bạn cần làm là
đọc kĩ phần nội dung câu hỏi và thay đổi hoặc thêm một số thông tin chi tiết
vào là được.
Luyện tập:
Chọn đáp án đúng:
1.
A. The table shows the amount of students who study abroad in 2001
and 2011.
B. The table shows the number of students who study abroad in 2001
and 2011.
IELTS Fighter – The Leading IELTS Training Center in VN
Ms Ngọc Cúc
4
TRUNG TÂM LUYỆN THI IELTS Fighter
website: ielts-fighter.com
2.
A. The graph illustrate China's annual growth rate of exports of
goods.
B. The graph illustrates China's annual growth rate of exports of
goods.
3.
A. The line graph shows how many Finnish people went to the
cinema between June and October 2014.
B. The line graph shows how much Finnish people went to the
cinema between June and October 2014.
4.
A. The pie charts compare the world population of 1900 with 2000.
B. The pie charts compare the world population in 1900 and 2000.
5.
A. The bar chart gives information about average household
expenditure in Japan.
B. The bar chart shows information about average household
expenditure in Japan.
Gợi ý:
Câu 1: Amount or number? Note that students are countable.
Câu 2: Look at the verb that follows the word graph. Hmm, the graph
should be singular, so illustrates is the correct option.
Câu 3: You can say how much water or how much effort (these
nouns are uncountable). But people are countable, so you should
use how many in this case.
IELTS Fighter – The Leading IELTS Training Center in VN
Ms Ngọc Cúc
5
TRUNG TÂM LUYỆN THI IELTS Fighter
website: ielts-fighter.com
Câu 4: You should use phrase in + year, not of + year or at + year.
Moreover, it seems like you compare population with year in the first
sentence.
Câu 5: You can use either gives information about or shows, but not
both at the same time.
IELTS Fighter – The Leading IELTS Training Center in VN
Ms Ngọc Cúc
6
- Xem thêm -