©
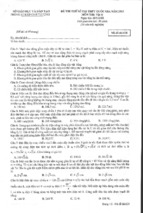
: Pre-Calculus - Chapter 3A
Chapter 3A - Rectangular Coordinate System
Introduction: Rectangular Coordinate System
Although the use of rectangular coordinates in such geometric applications as surveying and planning
has been practiced since ancient times, it was not until the 17th century that geometry and algebra were
joined to form the branch of mathematics called analytic geometry. French mathematician and
philosopher Rene Descartes (1596-1650) devised a simple plan whereby two number lines were
intersected at right angles with the position of a point in a plane determined by its distance from each of
the lines. This system is called the rectangular coordinate system (or Cartesian coordinate system).
y-axis
x-axis
y
origin
(0, 0)
x
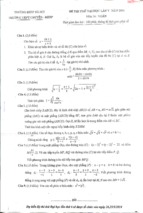
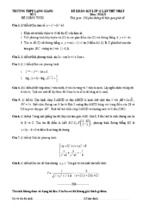
Points are labeled with ordered pairs of real numbers x, y, called the coordinates of the point, which
give the horizontal and vertical distance of the point from the origin, respectively. The origin is the
intersection of the x- and y-axes. Locations of the points in the plane are determined in relationship to
this point 0, 0. All points in the plane are located in one of four quadrants or on the x- or y-axis as
illustrated below.
To plot a point, start at the origin, proceed horizontally the distance and direction indicated by the
x-coordinate, then vertically the distance and direction indicated by the y-coordinate. The resulting
point is often labeled with its ordered pair coordinates and/or a capital letter. For example, the point 2
units to the right of the origin and 3 units up could be labeled A2, 3.
Quadrant I
Quadrant II
(+, +)
(-, +)
(0, b)
(a, 0)
(0,0)
Quadrant III
(-, -)
Quadrant IV
(+, - )
Notice that the Cartesian plane has been divided into fourths. Each of these fourths is called a quadrant
and they are numbered as indicated above.
©
: Pre-Calculus
©
Example 1:
: Pre-Calculus - Chapter 3A
Plot the following points on a rectangular coordinate system:
A2, −3
B0, −5
C−4, 1
D3, 0
E−2, −4
Solution:
5
4
3
2
C(-4,1)
-5
-4
-3
1
-2
-1
D(3,0)
0
-1
1
2
3
4
5
-2
A(2,-3)
-3
E(-2,-4)
-4
-5
B(0,-5)
Example 2:
Shade the region of the coordinate plane that contains the set of ordered pairs
x, y ∣ x 0. [The set notation is read “the set of all ordered pairs x, y such that x 0”.]
Solution: This set describes all ordered pairs where the x-coordinate is greater than 0. Plot several
points that satisfy the stated condition, e.g., 2, −4, 7, 3, 4, 0. These points are all located to the
right of the y-axis. To plot all such points we would shade all of Quadrants I and IV. We indicate that
points on the y-axis are not included x 0 by using a dotted line.
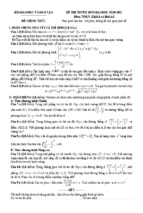
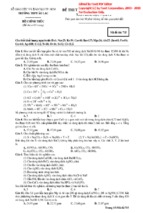
Example 3:
Shade the region of the coordinate plane that contains the set of ordered pairs
x, y ∣ x 1, − 2 ≤ y ≤ 3.
5
x=1
Solution:
The area to the right of the dotted line designated x 1 is the set of all points where the
x-coordinate is greater than 1 (shaded gray). The area between the horizontal lines designated y −2
and y 3 is the area where the y-coordinate is between −2 and 3 (shaded red). The dark region is the
intersection of these two sets of points, the set that satisfies both of the given conditions.
4
y=3
3
2
1
-5
y = -2
-4
-3
-2
-1
0
-1
1
2
3
4
5
x>1
and
-2 < y < 3
-2
-3
-4
-5
The basis of analytic geometry lies in the connection between a set of ordered pairs and its graph on the
Cartesian coordinate system.
©
: Pre-Calculus
©
: Pre-Calculus - Chapter 3A
Definitions:
Any set of ordered pairs is called a relation.
The plot of every point associated with an ordered pair in the relation is called the graph of the
relation.
The set of all first elements in the ordered pairs is called the domain of the relation.
The set of all second elements in the ordered pairs is called the range of the relation.
In Example 1, we plotted five distinct points. If we consider these points as a set of ordered pairs, we
have the relation 2, −3, 0, −5, −4, 1, 3, 0, −2, −4.
The graph is
5
4
3
2
C(-4,1)
-5
-4
-3
-2
1
-1
0
-1
D(3,0)
1
2
3
4
5
-2
A(2,-3)
-3
E(-2,-4)
-4
-5
B(0,-5)
The domain is 2, 0, − 4, 3, − 2 and the range is −3, − 5, 1, 0, − 4.
Infinite sets of ordered pairs can be described algebraically and plotted (or graphed) on the coordinate
system.
Example 4:
Below is the graph from Example 2. Recall that the graph represents all ordered pairs
defined by the algebraic statement: x 0. That is, the relation consists of all ordered pairs x, y that
have an x-coordinate that is a positive number. What is the domain and range of this relation?
Solution:
Since the relation is defined as the set of all ordered pairs where x 0, the domain is
x 0. The y-coordinates can be any real number so the range is all real numbers.
©
: Pre-Calculus
Example 5:
: Pre-Calculus - Chapter 3A
Below is the graph from Example 3. What is the domain and range?
5
x=1
©
4
y=3
3
2
1
-5
y = -2
-4
-3
-2
-1
0
-1
1
2
3
4
5
x>1
and
-2 < y < 3
-2
-3
-4
-5
Solution:
The domain is all real numbers greater than 1. The range is all real numbers between −2
and 3, including the endpoints −2 and 3.
Note: We often write the domain and range in interval notation. The domain for the above example in
interval notation is 1, . The range for the above example in interval notation is −2, 3.
©
: Pre-Calculus
©
: Pre-Calculus - Chapter 3A
Distance Formula
The marriage of algebra and geometry allows us to devise algebraic formulas to use in solving
geometric problems. For example, the formula for finding the distance between two points in the plane
is derived as follows:
Consider two points Px 1 , y 1 and Qx 2 , y 2 . Select a third point Rx 2 , y 1 so that the three points
form a right triangle with the right angle at point R. (See figure below.)
Q(x 2 , y2 )
y1
P( x 1 , y1 )
x1
x2
y2
R(x2 , y1 )
Note that the distance between P and R is |x 2 − x 1 | and the distance from Q and R is |y 2 − y 1 |.
Therefore, the distance from point P to point Q , denoted dP, Q, can be found using the Pythagorean
Theorem:
dP, Q 2 |x 2 − x 1 | 2 |y 2 − y 1 | 2
Because |x 2 − x 1 | 2 x 2 − x 1 2 and |y 2 − y 1 | 2 y 2 − y 1 2 , and because we are only interested in
positive values for the distance, we obtain the following formula.
Distance Formula
The distance between two points Px 1, y 1 and Qx 2 , y 2 in the plane is
dP, Q
x 2 − x 1 2 y 2 − y 1 2
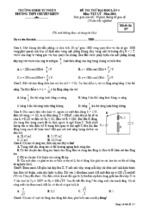
Example 1:
Find the distance between the points A3, −2 and B−4, −7.
Solution:
To find the distance between two points in the plane we use the distance formula
dA, B x 2 − x 1 2 y 2 − y 1 2 . It does not matter which point you use as x 1 , y 1 or x 2 , y 2 , so
we will use the coordinates of A and B respectively. That is, x 1 3, y 1 −2, x 2 −4, and y 2 −7.
Plugging into the formula, we get
dA, B
©
: Pre-Calculus
−4 − 3 2 −7 − −2 2
−7 2 −5 2
74 .
©
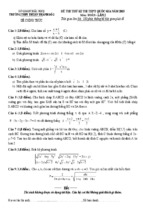
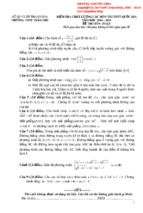
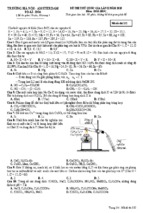
Example 2:
triangle.
Solution:
: Pre-Calculus - Chapter 3A
Determine whether the points A−2, 1, B5, 1 and C0, 3 are the vertices of a right
Plot and label points A, B, and C on graph paper and draw the indicated triangle.
5
4
C(0,3)
3
2
A(-2,1)
1
B(5,1)
-5 -4 -3 -2 -1 0
-1
1
2
3
4
5
-2
-3
-4
-5
From inspection of the graph, point C appears to be the vertex of the right triangle; therefore the line
segment through A and B appears to be the hypotenuse. We will use the distance formula to find the
length of each side of the triangle, and then apply the Pythagorean Theorem to determine whether the
triangle is indeed a right triangle:
dA, B
x 2 − x 1 2 y 2 − y 1 2
dA, B
5 − −2 2 1 − 1 2
dB, C
5 − 0 2 1 − 3 2
dA, C
0 − −2 2 3 − 1 2
7 2 0 2
5 2 −2 2
22 22
49 7
25 4
29
8
If triangle ABC is a right triangle,
2
8
2
29
7 2
8 29 49
37 49
must be true. Since 37 ≠ 49, triangle ABC is NOT a right triangle.
Example 3:
Determine whether the points A5, 3and B−1, −1 are equidistant from point C2, 1.
Recall that equidistant means ”equal distance”. That is, points A and B are equidistant from point C if
and only if the distance from A to C is equal to the distance from B to C. Algebraically, we would
write the above statement as dA, C dB, C.
Solution:
Plot the points on graph paper to visualize the problem.
4
A(5,3)
2
C(2,1)
-4
-2
B(-1,-1)
0
2
4
-2
-4
Using the distance formula we can find the distance between each of the points, A and B, and point C.
dA, C
5 − 2 2 3 − 1 2
dB, C
−1 − 2 2 −1 − 1 2
32 22
13
−3 2 −2 2
13
Because dA, C dB, C, A and B are equidistant from point C. Note that if you plot all the points
that are 13 units from point C you will obtain a circle.
©
: Pre-Calculus
©
: Pre-Calculus - Chapter 3A
Midpoint Formula
In many instances it is important to be able to calculate the point that lies half way between the two
points on the line segment that connects them. The figure below shows points Ax 1 , y 1 and B x 2 , y 2 ,
along with their midpoint Mx, y.
B(x , y )
2
2
=
M(x, y)
Q(x , y)
2
=
A(x , y )
1
P(x, y )
1
1
Note that Δ APM ≃ ΔBQM by ASA so that AP MQ.
x − x1 x2 − x
Solving for x, we get
2x x 2 x 1
x x2 x1 .
2
y
Similarly,
y2 y1
.
2
Midpoint Formula
The midpoint of the line segment that connects points Ax 1 , y 1 and Bx 2 , y 2 is the point M
y y1
.
The midpoint is the point Mx, y with
x, y with coordinates x 2 x 1 , 2
2
2
y
y
2
.
x x 1 x 2 and y 1
2
2
Note that the x-coordinate of the midpoint is the average of the x-coordinates of the the endpoints, and
the y-coordinate of the midpoint is the average of the y-coordinates of the endpoints.
The examples below will show you how to apply this formula. Be sure to work through them
before trying the exercises.
Example 1:
Solution:
Find the midpoint of the line segment that connects the points −2, 9 and 7, − 3.
Plugging x 1 −2, y 1 9, x 2 7, and y 2 −3 into the mid-point formula, we get
9 −3
y
3
x −2 7 5
2
2
2
Therefore, the midpoint is
©
: Pre-Calculus
5, 3 .
2
©
: Pre-Calculus - Chapter 3A
Example 2:
If −5, 8 is the midpoint of the line segment connecting A3, −2 and B, find the
coordinates of the other endpoint B.
Solution:
We are given the values x −5, y 8, x 1 3 and y 1 −2. We must find x 2 and y 2 .
Substituting into the midpoint formula, we get
−2 y 2
−5 3 x 2
and
8
2
2
Solving the above for x 2 and y 2 , we get:
16 −2 y 2
−10 3 x 2
x 2 −13
y 2 18.
Therefore, the endpoint B has coordinates −13, 18.
©
: Pre-Calculus
©
: Pre-Calculus - Chapter 3A
Circles
The set of all points Px, y that are a given fixed distance from a given fixed point is called a circle.
The fixed distance, r, is called the radius and the fixed point Ch, k is called the center.
r
P(x, y)
C(h, k)
The equation for this set of points can be found by applying the distance formula.
That is,
dC, P r.
x − h 2 y − k 2 r
If we square both sides of this last equation we get
x − h 2 y − k 2
r2
Equation of a circle with Ch, k and radius r – Standard Form.
x − h 2 y − k 2 r 2 .
Circles with center at the origin,C0, 0 – Standard Form
x2 y2 r2
Example 1:
Find the center and radius or the circles a) x 2 y 2 16 and b)
2
x − 3 y 2 2 10.
Solution:
a) This circle is in the second form so its center is the origin C0, 0 and
r 2 16 r 4
b) This circle is in the first form so that h 3 and k −2 C3, −2 and
r 2 10 r 10
Example 2:
Write an equation for the circle with C3, −5 and radius 2.
Solution
To write an equation for a specific circle we first write the equation for a circle in
standard form:
x − h 2 y − k 2 r 2 ,
and then identify the specific values for h, k, and r. .
Since we are given the center C and radius r, we can fill in values for h, k, and r as follows:
h the x-coordinate of C 3; k the y-coordinate of C −5; and r 2.
The equation of the circle is
Substitute into the equation and simplify:
Equation of the circle in standard form:
©
: Pre-Calculus
x − 3 2 y − −5 2 2 2
x − 3 2 y 5 2 4
©
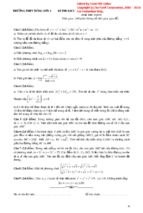
Example 3:
: Pre-Calculus - Chapter 3A
Find the center and radius of the circle
x − 1 2 y 3 2 9.
Graph the circle and find its domain and range.
Solution:
From the equation above, we see that h 1, k −3 so the center is C1, −3.
2
Since r 9, the radius is r 3.
Graph:
y
-2
0
0
2
4
x
-2
-4
-6
Note that there are no points to the left of the point −2, −3 nor to the right of 4, −3. Therefore the
domain is all real numbers from −2 to 4, including −2 and 4, or the interval −2, 4. Similarly, the
range values include all real numbers between −6 and 0, including the endpoints, which is the interval
−6, 0.
Note:We can find the domain of the circle algebraically by adding and subtracting the radius 3 to the h
value 1.
1 − 3, 1 3 −2, 4.
We can obtain the range by adding and subtracting the radius 3 from the k value −3.
−3 − 3, − 3 3 −6, 0.
Example 4:
Solution:
Write an equation for the circle with at the origin and radius 5 .
Substituting h 0, k 0, and r 5 into the equation for a circle, we get
x − 0 2 y − 0 2 5 2
x2 y2 5
Since the center of the circle is the origin, we can substitute directly into the formula x 2 y 2 r 2 to get
2
x 2 y 2 5 x 2 y 2 5.
If we expand the equation for the circle x − 1 2 y 3 2 4, we get
©
: Pre-Calculus
©
: Pre-Calculus - Chapter 3A
x 2 − 2x 1 y 2 6y 9 4.
Simplifying and arranging terms, we get
x 2 y 2 − 2x 6y 6 0
We call this the general form of an equation of a circle. Notice that the coefficients of x 2 and y 2 are the
same. This is your first clue that a particular equation may be a circle.
The equation x − h 2 y − k 2 r 2 form is called the standard form of an equation of a circle.
General Form of an Equation of a Circle
x 2 y 2 cx dy e 0
It is important to be able to recognize that this equation also represents a circle. Note that the equation
contains both an x 2 and a y 2 term and that both coeffiients equal 1.
The general form is not as user-friendly as the standard form. We cannot find the center and radius of
the circle by simply inspecting the equation as we can with an equation in standard form. To find the
center and radius of a circle that is in general form, we must reverse the above process and write the
equation in standard form.
For example, x 2 y 2 − 4x − 2y − 4 0 is the equation of a circle. (The coefficients of x 2 and y 2 are
positive and equal.)
Grouping the x and y terms and moving the constant to the other side of the equation, we get
x 2 − 4x y 2 − 2y 4
We must now complete the square on the x and y terms, and add the calculated amounts to both sides of
the equations.
x 2 − 4x 4 y 2 − 2y 1 4 4 1
Question:
Answer:
Why did we add 4 to both sides of the equation?
We added 4 go be able to write x 2 − 4x as a square.
x 2 − 4x x 2 − 4x 4 − 4
x − 2 2 − 4 .
So that we’re not changing the equation we must either add 4 and subtract 4 from the same side of the
equation 4 − 4 0 , or we must add 4 to the each side of the equation (x y is equivalent to
x 4 y 4.
Writing in factored form, we get the standard form of the equation:
x − 2 2 y − 1 2 9
From this form we can determine that the center of the circle is 2, 1 and the radius is 3. We can use
this information to graph the equation by plotting the center 2, 1 and locating as many points on the
circle as needed (3 units in any direction from the center) .
©
: Pre-Calculus
©
Example 5:
: Pre-Calculus - Chapter 3A
Find the center and radius of the circle x 2 y 2 − 6x 2y 1 0. Graph the circle.
Solution:
To find the center and radius we must write the equation in standard form:
Group x and y terms:
x 2 − 6x y 2 2y 1 0
Move constant term to other side:
x 2 − 6x y 2 2y −1
2
Complete the square:
x − 6x 9 y 2 2y 1 −1 9 1
Rewrite in factored form:
x − 3 2 y 1 2 9
Determine C and r:
C3, −1
r3
Graph by plotting the center C3, −1 and applying the radius of 3 units to find points on the
circle:
y
1.25
0
0
2
4
6
x
-1.25
-2.5
-3.75
Since the radius is 3, the domain is 3 − 3, 3 3 0, 6 and
the range is −1 − 3, − 1 3 −4, 2.
Example 6:
Find the center and radius of the circle 3x 2 3y 2 − 6x 12y 2 0.
Solution:
Although the coefficients of x 2 and y 2 are not 1, the equation represents a circle
because they are equal, so we divide the equation by the common coeffient.
Divide equation by 3 :
3 x 2 3 y 2 − 6x 12y 2
3
0
3
x 2 y 2 − 2x 4y 2 0
3
2
2
2
Group x and y terms:
x − 2x y 4y
0
3
Move constant term to other side:
x 2 − 2x y 2 4y − 2
3
Complete the square:
x 2 − 2x 1 y 2 4y 4 − 2 1 4
3
Rewrite in factored form:
x − 1 2 y 2 2 13
3
39
Determine C and r:
C1, −2
r 13
3
3
©
: Pre-Calculus
©
: Pre-Calculus - Chapter 3A
Exercises for Chapter 3A - Rectangular Coordinate System
1.
2.
3.
4.
5.
6.
7.
8.
9.
10.
11.
12.
13.
14.
15.
16.
©
Plot the following points on a rectangular coordinate system:
a) A−2, −1
b) B3, 5
c) C0, −3
d) D−4, 1
e) E−1, 0
f) F2, −3
Use the points in exercise #1 to answer the following questions.
a) Which point(s) are in quadrant I? quadrant II? quadrant III? quadrant IV?
b) Which point(s) are on the x-axis? the y-axis?
c) Which point(s) meet the condition: x 0?
d) Which point(s) meet the condition: y ≤ 0?
e) Which point(s) meet both the conditions: x ≥ 0 and y 4?
Shade the region of the coordinate plane that contains each of the following sets of points.
a) x, y|x ≤ 0
b) x, y x −3 and y ≥ 0
c) x, y x ≤ −2 and y 2
d) x, y 1 x ≤ 4 and y ≥ −1
Graph the following relations and write their domain and range.
a) −7, −2, 4, −3, 0, 3, 1, −6, −2, 5, 0, 0, 9, −2
b)
3 , −1 , 12 , 3, −1, 2. 5, −4. 3, 2 , −5. 6, 2. 75
Write the domain and range of each of the relations in exercise 3.
Find the distance between the following sets of points.
a) A−2, −1 and B3, 5
b) C0, −3 and D−4, 1
c) E−1, 0 and F2, −3
d) G 12 , −23 and H 32 , −53
e) J−3. 3, 4. 9 and K1. 2, − 7. 5
Is P7, 2 closer to point R−1, 3 or point Q9, −4?
Prove that the triangle with vertices A−3, −2, B−2, 2, and C6, 0 is a right triangle.
Find the area of triangle ABC in exercise #9.
Determine whether the triangle with vertices A−1, −2, B2, 5, and C9, 2 is an isosceles
triangle. (An isosceles triangle has two sides that are equal.)
If the distance betweeen A 3, x and B6, 0 is 5 units, find all possible coordinates for A.
Write an equation that describes all the points x, y that are 5 units from point B6, 0.
If the center of a circle is 2, 9 and 0, −5 is a point on the circle, find the radius of the
circle.
Find the midpoint of the line segment connecting the following pairs of points:
a) A−2, −1 and B3, 5
b) C0, −3 and D−4, 1
c) E−1, 0 and F2, −3
d) G 12 , 23 and H 32 , −53
e) J−3. 3, 4. 9 and K1. 2, − 7. 5
In each of the following, Mx, y is the mid-point of A and B. Find the missing end-point,
A or B.
a) A−2, 5; M3, 2
b) M1, 0; B−5, −4
If −7, 2 and 5, 8 are endpoints of a diameter of a circle, find the center.
: Pre-Calculus
©
: Pre-Calculus - Chapter 3A
17. Each of the following points A is an endpoint of a line segment. If the midpoint of the line
segment AB is the point 0, 0, find B.
a) −3, 5
b) 4, −1
c) 4, 2
d) −5, −6
e) 3, 0
18. Find the Ch, k and radius r for the following circles. Then graph the circle.
a) x − 3 2 y − 7 2 16
b) x 2 y 2 49
2
c) x 12 y 5 2 17
d) x 2 y − 3 2 20
e) x 2 y 2 8x 4 0
f) 2x 2 2y 2 − 8x 20y − 2 0
19. Write an equation for each of the following circles.
a) C3, −2; r 13
b) C0, 0; r 2
c) C−1, 5 through 7, −3
d) C8, −3 that touches the y-axis at 0, −3
20. If 3, 7 and −5, −1 are endpoints of a diameter of a circle, write the equation for the
circle.
21. Prove that the point C2, 3 is equidistant from A3, −2 and B7, 4. Is C the midpoint of
AC?
Verify your answer.
22. If the diagonals (line segments connecting opposite vertices) of a parallelogram (a
quadrilateral whose opposite sides are equal and parallel) are equal, the parallelogram is a
rectangle (a parallelogram with four right angles). If all sides of the rectangle are equal, it is
a square. Determine whether the quadrilateral with vertices A−1, 3, B−2, 7, C2, 8, and
D3, 4 is a parallelogram, rectangle, or square.
©
: Pre-Calculus
©
: Pre-Calculus - Chapter 3A
Answers to Exercises for Chapter 3A - Rectangular
Coordinate System
1.
B(3,5)
5
4
3
D(-4,1)
2
E(-1,0)
-5
-4
-3
A(-2,-1)
-2
-1
1
0
-1
1
2
3
4
5
-2
F(2,-3)
C(0,-3) -3
-4
-5
2.
3.
a)
b)
c)
d)
e)
a)
QI: B; QII: D; QIII: A; QIV: F
x-axis: E; y-axis: C
B and F
A, C, E, and F
C and F
x=0
b)
x = -3
y=0
c)
x = -2
y=2
d)
©
: Pre-Calculus
©
: Pre-Calculus - Chapter 3A
x=1
x=4
y = -1
4.
a)
8
6
4
2
0
-10
-7.5
-5
-2.5
0
2.5
5
7.5
10
-2
-4
-6
-8
Domain: −7, 4, 1, −2, 2, 9
Range: −2, −3, 3, −6, 5, 1
b)
2.5
1.25
0
-5
-3.75
-2.5
-1.25
0
1.25
2.5
3.75
5
-1.25
-2.5
Domain:
5.
6.
3,
1
2
, −1, −4. 3, −5. 6
Range: −1, 3, 2/5, 2 , 2. 75
a) Domain: all real numbers ≤ 0
Interval notation: −, 0
Range: all real numbers
Interval notation: −,
b) Domain: all real numbers greater than −3
Interval notation: −3.
Range: all real numbers ≥ 0
Interval notation: 0,
c) Domain: all real numbers ≤ −2 or −, −2
Range: all real numbers 2 or −, 2
d) Domain: real numbers between 1 and 4, including 4 or 1, 4
Range: real numbers ≥ −1 or −1,
a)
dA, B
−2 − 3 2 1 − 5 2
−5 2 −4 2
Note:
25 16
61
61 is between 49 7 and 64 8.
b) dC, D
0 − −4 2 −3 − 1 2
4 2 −4 2
©
: Pre-Calculus
©
: Pre-Calculus - Chapter 3A
32
4 2 ≈ 5. 656 9
c) dE, F
d) dG, H
e) dJ, K
7.
8.
9.
−1 − 2 2 0 − −3 2
12 −
3
2
2
− 23 − − 53
−3 2 3 2
2
−3. 3 − 1. 2 4. 9 − −7. 5
2
2
18 3 2 ≈ 4. 242 6
−1 2 1 2
2 ≈ 1. 414 2
174. 01 ≈ 13. 19
It’s always helpful to graph the given situation on graph paper to help you visualize the
problem. Rememeber what formulas you have to work with and what information each
formula provides. To determine whether point R or point Q is closer to P, we must
determine the distance from R to P and from Q to P. The smaller of the two distances will
tell us which point is closer.
dP, R 65
dP, Q 40
Since dP, Q dP, R, Q is closer to P.
Plot the three points on graph paper, label them and draw the triangle. Remember that you
can prove that a triangle is a right triangle using the Pythagorean Theorem: a 2 b 2 c 2
where a and b are the sides of the triangle and c is the hypotenuse. What formula we can
use to find the length of each side? The distance formula, of course.
dA, B 17
dB, C 68 2 17
dA, C 85
Once we have the lengths of each side, we plug the smaller sides into the Pythagoream
Theorem for a and b, and the largest in for the hypotenuse.
2
2
2
17
68
85
17 6 8 85
85 85
Therefore, ΔABC is a right triangle.
To find the area of a triangle we can use the formula A 12 bh, where b is the base and h is
the height. Note that h is the perpendicular distance from the third vertex back to the base.
Since ΔABC is a right triangle, the two legs are the base and the height , so that
2
A 12
17 2 17 12 2 17
17.
The area of ΔABC is 17 square units.
10. Remember to plot the points and draw the triangle to help you visualize the problem. To
show that ΔABC is an isoscleles triangle we must show that two of the three sides are equal
in length. Your plot above will probably show you which sides to try first.
dA, B 58
dB, C 58
Since sides AB and BC are equal in length ΔABC is an isosceles triangle.
11. Stating the problem algebraically gives us dA, B 5. Replacing the left side with the
distance formula, we get
3 − 6 2 x − 0 2 5
−3 2 x 2 5
9 x2 5
We must square both sides of the equation and solve for x.
9 x2
9 x2
©
2
52
25
: Pre-Calculus
©
: Pre-Calculus - Chapter 3A
25 − 9
x2
2
16
x
x
4
Therefore A can be either of the points 3, 4 and 3, −4.
Justify this to yourself by plotting the points on graph paper.
12.
dP, B 5
x − 6 2 y − 0 2 5
x − 6 2 y 2 25
Plot point B on graph paper. Sketch out the points that are 5 units from point B. What
shape do you get? A circle.
13. Plot the center and point and sketch the circle. The radius of a circle r is the distance from
the center of the circle to any point on the circle. Using the distance formula, we get
r
2 − 0 2 9 − −5 2
200 10 2
14. Find the midpoint of the line segment connecting the following pairs of points:
a) Using the midpoint formula gives us M −2 3 , −1 5 M 1 , 2
2
2
2
−3
1
0
−4
b) M
,
M−2, −1
2
2
1 −3
c) M −1 2 ,
M 1 , −3
2
2
2 2
1 3 2 −5
3
2 , 3
2
d) M
M1, − 12
2
2
15.
16.
17.
18.
©
4. 9 −7. 5
−2. 1 , −2. 6 M−1. 05, −1. 3
e) M −3. 3 1. 2 ,
2
2
2
2
a) Use Example 2 in the midpoint notes as a model for this problem. You should get the
point 8, −1 as your answer.
b) 7, 4
Plot the given points on graph paper, draw the circle throught the two points, and draw the
diameter. The diameter of a circle will always go through its center. Moreover, the center
will be the mid-point of the diameter. To find the center, we must then find the midpoint of
the two endpoints of the diameter using the midpoint formula.
Center : −7 5 , 2 8 −1, 5
2
2
a) 3, −5
b) −4, 1
c) −4, −2
d) 5, 6
e) −3, 0
Note that the signs of the coordinates are opposites. If the origin is the midpoint of two
points, we say that the two points have symmetry with respect to the origin.
a) x − 3 2 y − 7 2 16 Recall the formulas for circles. C3, 7; r 4
b) C0, 0; r 7
c) C− 1‘2 , −5; r 17
d) C0, 3; r 20 2 5
e) Group x-terms and move 4 to other side of the equation: x 2 8x
y 2 −4 Complete
2
the square on the x-terms by adding 12 8 16 to both sides of the equation.
x 2 8x 16 y 2 −4 16
Simplify: x 4 2 y 2 12
Therefore, C−4, 0; r 12 2 3
f) x 2 − 4x y 2 10y 1
x 2 − 4x 4 y 2 10y 25 1 4 25
x − 2 2 y 5 2 30
: Pre-Calculus
©
: Pre-Calculus - Chapter 3A
C2, −5; r 30
19. a) x − 3 2 y 2 2 13
b) x 2 y 2 4
c) We are given the center of the circle −1, 5 so h −1 and k 5, but we do not have the
radius. Plot the center and draw the circle through P. What do we need to do to find the
length of the radius? The distance formula !
r dC, P
−1 − 7 2 5 − −3 2
128
Substituting into the formula, we get
2
128
x 1 2 y − 5 2
x 1 2 y − 5 2 128
d) Plot the points on graph paper. You should be able to see that the radius of the circle is
8.
Therefore the equation is x − 8 2 y 3 2 64
20. The diameter of a circle goes through the center of a circle. Therefore, you can use the
midpoint formula to find the center of the circle. C−1, 3 The radius is the distance from
the center to either of the points on the circle. r 32 x 1 2 y − 3 2 32
21. Plot out the problem on graph paper. Use the distance and midpoint formulas appropriately
to draw your conclusions algebraically. You should find that C is equidistant from A and B,
but it is not the midpoint. Explain to yourself why.
Draw all the points that are equidistant from A and B. You should have drawn a line. This
line is called the perpendicular bisector of line segment AB.
22. Using the distance formula appropriately should show that all sides are equal in length and
the diagonals are equal, therefore the most accurate term for the quadrilateral is square.
Note that a square is also a parallelogram and a rectangle.
©
: Pre-Calculus
©
: Pre-Calculus - Chapter 3B
Chapter 3B - Graphs of Equations
Graphing by Plotting Points
We have seen that the coordinate system provides a method for locating points in a plane. Furthermore,
we can plot sets of ordered pairs on the coordinate system to visualize the relationship between the two
variables. However,in most cases we will be interested in relations that are stated as equations. For
example, the equation x y 6. refers to the relation x, y|x y 6 , read ”the set of all pairs
x, y such that x y 6" . Every pair of numbers x, y that makes the equation true is called a
solution to the equation. The pair 2, 4 is a solution to the equation x y 6 because 2 4 6; but
the ordered pair 4, 4 is not a solution since 4 4 ≠ 6.
Question:
Answer:
How many solutions does the equation x y 6 have?
There are an infinite number of solutions.
Find three more pairs x, y such that x y 6.
Any pair of numbers whose sum is 6 is a solution. For example:
−5, 11, −2. 1, 8. 1, 1, 5, 0, 6, 6, 0, 12 , 5 12 , 2, 4
The plot of every point that corresponds to a solution to the equation x y 6 is the graph of the
equation x y 6:
Example 1:
Solution:
15
(-5,11)
10
(-2.1,8.1)
(0,6)
5
(.5,1.5)
(1,5)
(2,4)
(6,0)
-10
-5
0
5
10
-5
-10
The points labeled above are the solutions we listed in example 1; however, the graph consists of every
pair x, y that is a solution to the equation. Furthermore, every point on the graph satisfies the
equation x y 6..
Note that the above graph is a line. The graph of any linear equation is a line. A linear equation is one
that can be written in the form ax by − c 0, where a and b are not both 0. The equation x y 6
can be written in the form of a linear equation x y − 6 0, where a 1, b 1, and c −6.
IMPORTANT CONCEPT: The graph of an equation consists of all pairs x, y that are
solutions to the equation. Every solution to the equation is a point on the graph and
every point on the graph x, y is a solution to the equation.
©
: Pre-Calculus
- Xem thêm -