NOTICE: This standard has either been superseded and replaced by a new version or discontinued.
Contact ASTM International (www.astm.org) for the latest information.
Designation: D 945 – 92 (Reapproved 1997)
Standard Test Methods for
Rubber Properties in Compression or Shear (Mechanical
Oscillograph)1
This standard is issued under the fixed designation D 945; the number immediately following the designation indicates the year of
original adoption or, in the case of revision, the year of last revision. A number in parentheses indicates the year of last reapproval. A
superscript epsilon (e) indicates an editorial change since the last revision or reapproval.
This standard has been approved for use by agencies of the Department of Defense.
1. Scope
1.1 These test methods cover the use of the Yerzley mechanical oscillograph for measuring mechanical properties of
rubber vulcanizates in the generally small range of deformation
that characterizes many technical applications. These properties include resilience, dynamic modulus, static modulus,
kinetic energy, creep, and set under a given force. Measurements in compression and shear are described.2,3
1.2 The test is applicable primarily, but not exclusively, to
materials having static moduli at the test temperature such that
forces below 2 MPa (280 psi) in compression or 1 MPa (140
psi) in shear will produce 20 % deformation, and having
resilience such that at least three complete cycles are produced
when obtaining the damped oscillatory curve. The range may
be extended, however, by use of supplementary masses and
refined methods of analysis. Materials may be compared either
under comparable mean stress or mean strain conditions.
1.3 The values stated in SI units are to be regarded as the
standard. The values given in parentheses are for information
only.
1.4 This standard does not purport to address all of the
safety concerns, if any, associated with its use. It is the
responsibility of the user of this standard to establish appropriate safety and health practices and determine the applicability of regulatory limitations prior to use. For specific
precautionary statement see Note 2.
D 1207 Recommended Practice for Classifying Elastomeric
Compounds for Resilient Automotive Mountings5
D 4483 Practice for Determining Precision for Test Method
Standards in the Rubber and Carbon Black Industries4
2.2 SAE Standard:
SAE J16 Classification of Elastomer Compounds for Automotive Resilient Mountings6 7
3. Terminology
3.1 Descriptions of Terms Specific to This Standard:
3.2 effective dynamic modulus—calculated from the formula for simple harmonic motion in a damped free oscillation.
It is a composite index which includes the effect of such
diverse factors as nonlinearity of stress-strain, changing molecular energies, and heat losses.
3.3 point modulus—ratio of total stress (force/area) to total
strain (change in dimension/unstressed dimension) at one point
of the stress-strain curve. Sometimes called the “secant modulus,” it is equal to the slope of a line from the origin to the
chosen point.
3.4 static modulus—synonymous with “tangent modulus”
and is the slope of the tangent to the stress-strain curve at a
chosen point. It can provide a reference for comparison with
the effective dynamic modulus at that point.
4. Summary of Test Methods
4.1 Specimens are loaded by an unbalanced lever and the
resultant deflections are recorded on a chronograph. This
permits calculations to be made of static modulus at any stage
of a stepwise loading or unloading schedule. Creep and
recovery rates, including set under prescribed conditions, can
be obtained. Since the lever is supported on a knife edge, the
system can be impact-loaded to produce a damped free
oscillation trace. This trace yields a dynamic modulus, a
resilience index, an oscillation frequency, and a measurement
of stored energy.
2. Referenced Documents
2.1 ASTM Standards:
D 832 Practice for Rubber Conditioning for LowTemperature Testing4
1
These test methods are under the jurisdiction of ASTM Committee D-11 on
Rubber and are the direct responsibility of Subcommittee D11.14 on Time and
Temperature Dependent Physical Properties.
Current edition approved March 15, 1992. Published May 1992. Originally
issued as D945 – 48 T. Last previous edition D945 – 87.
2
A survey of some aspects of hysteresis and modulus in dynamic performance
of polymers is available in a paper by Payne, A. R., “The Role of Hysteresis in
Polymers,” Rubber Journal, January 1964, p. 36.
3
One method of correlating fundamental data from the Yerzley oscillograph with
dynamic tests at constant amplitude is described by Baldwin, F. P., in his paper,
“Determination of the Dynamic Properties of Rubberlike Materials by Means of a
Modified Yerzley Oscillograph,” The Rubber Age, April 1950.
4
Annual Book of ASTM Standards, Vol 09.01.
5
Discontinued—see 1971 Annual Book of ASTM Standards, Part 28.
Available from Society of Automotive Engineers, 400 Commonwealth Drive,
Warrendale, PA 15096.
7
The Yerzley oscillograph was originally described in detail in the paper by
Yerzley, F. L., “A Mechanical Oscillograph for Routine Tests of Rubber and
Rubber-Like Materials,” Proceedings, ASTM, Vol 39, 1939, p. 1180; also Rubber
Chemistry and Technology, Vol XIII, No. 1, January 1940, p. 149.
6
Copyright © ASTM, 100 Barr Harbor Drive, West Conshohocken, PA 19428-2959, United States.
1
D 945
position, B. Therefore, a deformation of 2.5 mm, for example,
will be registered on the oscillogram as a vertical displacement
of 25 mm.
6.1.3 The masses, MF, MG, and MH, derive from the mass of
accurately machined disks, 99.06 mm in diameter with a
central hole 12.7 mm in diameter. Standard masses shall be an
integral or fractional multiple either of 641.252 g (1.41372
lbm) for convenience of testing in inch-pound units or of
489.464 g for greater convenience of testing in SI units. The
lever ratio for the masses is 6.25:1 for the outer mass position
in reference to the inner specimen position. Using the 6.25:1
ratio, each unbalanced mass on the pen end of the beam
therefore will produce the following forces on the specimen on
the inner position at W5r:
5. Significance and Use
5.1 The rubber properties that are measurable by these test
methods are important for the isolation and absorptionof shock
and vibration. These properties may be used for quality control,
development and research.
5.2 Measurements in compression are influenced by specimen shape. This shape factor may be described as the ratio of
the loaded surface area to the unloaded surface area. In
applying data from a compression specimen, shape factor must
be incorporated into the mathematical transferral to the application.
6. Apparatus
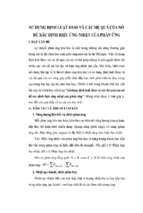
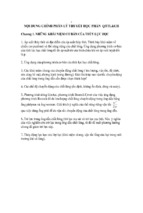
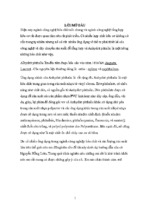
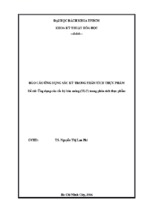
6.1 The essential features of the apparatus,7,8 (illustrated in
Fig. 1 and Fig. 2) are as follows:
6.1.1 The beam shall be supported at its center by a
knife-edge, A, and shall be so designed that a test specimen
placed beneath the micrometer can be loaded by placing
standard masses alternatively on front and back portions of the
cross-rod, F, at the pen end of the beam. A second knife-edge,
B, and a stabilizing arm, B8, (as shown in Fig. 2), shall be used
to apply load to the test specimen and to maintain parallelism
of the loading platens. Optional knife-edges, C and D, may be
used to extend the range of the oscillograph.
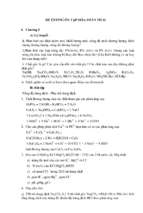
6.1.2 A pen shall extend lengthwise from the beam to record
deflections on the oscillogram automatically. From Fig. 2, it is
apparent that the deflection of the specimen under test will be
magnified by the travel of the pen in proportion to the lever
ratio which will be 10:1 when the sample is on the inner test
8
SI units
Inch-pound units
Mass Value
489.46 g
1.4137 lbm
Force Resulting
From 6.25:1 Ratio
30.0000 N
8.8357 lbf
6.1.4 It follows that positioning the masses on the inner
mass position, MG, will reduce the load values to half of the
foregoing values.
PART A—MEASUREMENTS IN COMPRESSION
7. Test Specimens
7.1 Solid Rubber Specimens:
7.1.1 At least two specimens shall be tested, except that at
least three shall be required if measurement of creep is to be
included. The test specimens for measurements in compression
shall be right circular cylinders chosen from the following
alternatives:
Available from Tavdi Co., Inc., P.O. Box 298, Barrington, RI 02806.
FIG. 1 Advanced Yerzley Oscillograph
2
D 945
FIG. 2 Diagrammatic Sketch of Advanced Yerzley Oscillograph
Shape
Factor
0.390
0.375
Shape
Factor
0.390
0.375
Primary
Practice
SI units
Inch-pound units
Height
12.5 6 0.25 mm
0.5 6 0.010 in.
parallel to each other and at right angles to the axis of the
cylinder. The area of the circular bases is 15.00 cm2 (2.323
in.2).
7.2.2 The specimen shall be not less than 6.4 mm (1⁄4 in.)
and not more than 29 mm (11⁄8 in.) in thickness. If the material
is too thick, it shall be sliced to the required thickness.
7.2.3 Unless otherwise specified in the detail specification,
materials thinner than 6.4 mm (1⁄4 in.) shall be plied up to
obtain the required thickness, in which case the report is to
include the number of plies.
Diameter
19.5 6 0.13 mm
0.75 6 0.005 in.
Reference Area
of Nominal
Circle
300 mm2
0.442 in.2
7.1.2 The specimens may be molded, or cut from finished
products and buffed to the specified dimensions. Test specimens shall be free from porosity, nicks, and cuts. (Molded
specimens are preferred for dimensional accuracy and consistency.)
7.2 Cellular Test Specimens:
7.2.1 Specimens of cellular rubber shall be prepared as
follows: The specimen shall be a circular cylinder cut with a
circular metal die 43.70 6 0.01 mm (1.720 6 0.001 in.) in
inside diameter for cutting the specimen in a drill press or
similar device for rotating the die. The pressure applied to the
die shall be sufficiently small to keep“ cupping” of the cut
surfaces to a minimum. In some cases, it may be necessary to
freeze the cellular rubber before cutting the specimen in order
to obtain parallel cut surfaces. To facilitate cutting of the
specimen with smooth-cut surfaces and square edges, the die
may be lubricated with water containing a wetting agent and a
corrosion inhibitor such as 0.5 % sodium chromate or with
silicone mold release emulsion before each specimen is cut. If
a lubricant is used, the specimen shall be permitted to dry
before testing. The circular bases of the specimens shall be
8. Conditioning
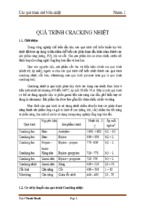
8.1 Expose the test specimens and the apparatus to the
temperature of the test for sufficient time to ensure temperature
equilibrium. For testing at low temperatures (below room
temperature), the section of the oscillograph to be enclosed
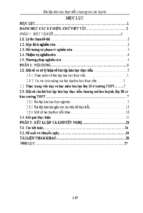
shall be one of those shown by broken lines in Fig. 3. The
enclosure shall be equipped with a shelf for storing test
specimens and supplied with a circulating atmosphere at the
temperature of test. Unless otherwise specified, the cold
chamber and testing conditions shall conform to the conditions
specified in Practice D 832. After the test specimens have been
conditioned at the test temperature, proceed in accordance with
Section 9. Similar conditioning requirements apply also to tests
at elevated temperatures.
9. Procedure
9.1 This procedure for solid rubber specimens includes
3
D 945
FIG. 3 Section of Oscillograph to be Enclosed for Tests at Other than Room Temperature
three categories of test operation which for clarity are described separately under subsequent section headings to provide data for purposes as follows:
9.1.1 In 9.4-9.6 for initial creep and set under a given load.
9.1.2 In 9.7-9.9 for Yerzley resilience and hysteresis, point
modulus, frequency in hertz, effective dynamic modulus, and
maximum impact energy absorbed at a given test load value.
9.1.3 In 9.10-9.14 for stepwise loading and unloading and
hysteresis loop, and stresses in pascals or in pounds-force per
square inch at any deformation.
9.1.4 Depending on the purpose of any test program, primary reliance may be placed on any one of the foregoing
categories, on a combination of two categories, or upon all
three. It is important, however, to record adequately all data
required to identify the test conditions fully.
9.2 Lock the beam of the oscillograph in position by means
of the release hook at the left end of the machine and remove
all masses. Place the test specimen centrally on the lower
platen between the grit sides of two pieces of 400 grit A
sandpaper (Note 1). Adjust the micrometer until the upper
platen rests snugly against the sandpaper without deforming
the test specimens; then lock the micrometer by means of the
set screw or lock nut. This setting can be verified as follows:
NOTE 1—Silicon carbide particles have an average size of 22 6 2 µm.
9.2.1 Upon disengaging the release hook the pen end should
retain its position. If it falls noticeably (even 0.02-mm or
0.001-in. change may be seen), the micrometer must be
readjusted downward.
9.2.2 When this adjustment is completed and verified,
reengage the hook. Now apply a small downward force by
hand on the pen end of the beam. If the added force depresses
the pen, the micrometer platen is too low. Readjust the
micrometer until the micrometer setting is correct. Opening
and closing the release hook should then have no effect on the
pen position.
9.3 Place the graph paper on the chronograph drum and
adjust its position so that the zero position of the pen point is
on one of the horizontal lines of the paper. An engineering
grade of graph paper ruled in 1-in. squares and then subdivided
4
D 945
9.8 This test is the natural sequel to the previous process for
creep, 9.4, or may be performed without a preceding creep and
set evaluation after establishing the horizontal reference line at
the top of the chart as described in 9.3. With the hook engaged,
verify the position of the test specimen with 400 grit A paper
and the micrometer adjustment in firm but non-deforming
contact with the specimen. With the estimated number of
masses required to produce a final deformation of 20 % and
with the drum stationary, disengage the hook. Allow the
ensuing oscillations to die out. Note the ultimate static deformation. If the deformation is not close to 25 mm (or to 1 in.)
as observed directly on the oscillogram, add or remove masses
as needed to attain the required 20 % compression. Rotate the
drum by hand to the left approximately one small square of the
oscillogram and disengage the hook. Repeat this conditioning
operation a sufficient number of times to obtain three successive lines of the same length. After the last oscillation, the pen
point should indicate 20 6 2 % deformation of the test
specimen.
9.9 After obtaining three successive lines of the same
length, start the chronograph with the drum rotating at a speed
of 4 r/min, disengage the hook, and record a set of oscillations.
If the vertical length of the first oscillation is shorter than the
length of the last conditioning line, there has been excessive
time between successive trials, and further conditioning as
necessary shall be performed until a satisfactory test is obtained. The motor may be stopped when an adequate number of
oscillations, at least three, have been recorded for a resilient
composition. When the pen is at rest, rotate the drum counterclockwise by hand and then clockwise through the horizontal
time span of the oscillations to record the final static equilibrium position of the beam. Reengage the hook.
9.10 This section is directed toward plotting of the loadcompression characteristics of a specimen in a complete
loading and unloading cycle for interpretation of its static
load-bearing characteristics. This procedure may be performed
before or after the procedure of 9.7, but cannot be performed
prior to the procedure of 9.4, since it would eliminate the
possibility of measurement of initial creep.
9.11 Verify that all masses have been removed from the
beam and that the sample is properly centered on the lower
platen.
9.12 Disengage the hook and apply sufficient pressure by
hand on the pen end of the beam to compress the test specimen
to 30 % deformation (1.5 in. on the graph for test specimens
0.50 in. in height) and release. Repeat this operation at least 3
times to condition the specimen for test.
into ten equal squares per inch shall be used for measurements
in inch-pound units. A quality grade of graph paper ruled in
1-cm squares subdivided in millimetre squares is preferable for
measurements in SI units, although it should be noted that for
4-r/min and 1-r/min speeds of the chronograph 25.4 mm on the
horizontal scale equals 1 and 4 s, respectively.
9.4 This section is directed toward measurement of initial
creep and set. With the beam elevated and with the hook
engaged prepare to add masses to the pen end of the beam prior
to recording both the initial impact on the sample and the
subsequent creep. Normally the test will be directed toward a
final total deformation of 20 % plus the value of the creep. If
creep of 2 % should develop, the total deformation thus would
be 20 % + 2 %, or 22 %. A tolerance of 62 % has been found
convenient. Trial and error with one sample may be used to
establish the necessary number of masses. When the load value
is established, proceed.
9.5 With the hook engaged, with a fresh test specimen with
sandpaper in position, with the correct micrometer setting, and
with the established number of masses installed, turn the drum
on to rotate at 4 r/min in order to draw the horizontal reference
line at the top of the chart. This will also take up slack in the
gear train driving the drum. As the drum approaches the
beginning of the second revolution, change the drum speed to
1 r/min. About three small squares into the second revolution
release the hook, allowing the beam to fall in an impact on the
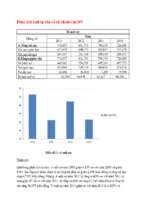
specimen, as indicated in Fig. 4. Allow the drum to rotate one
or more complete revolutions beyond the end of any oscillations. Stop the motor. The creep of the sample after the end of
the oscillations will be recorded on the chart for 1 min or more.
If desired, the creep for a longer time may be recorded by
timing a longer period and observing the further slow downward motion of the pen as a vertical downward trace. The
amount of further drift after the longer time interval can be
marked by a rotation of the drum one or two small squares to
the left and right by hand to form a cross on the trace line.
9.6 Set may be measured at any time by reengaging the
hook to remove the load from the specimen, and then carefully
turning the micrometer platen downward a measured distance
into contact with the sample to close the gap caused by the
short term set.
9.7 This section is directed toward the measurement of
Yerzley resilience and hysteresis, point modulus, frequency in
hertz, effective dynamic modulus, and impact energy absorbed
by the sample at the test load value. Taken alone, the procedure
described in this section is a rapid and informative test for
comparison of several properties of elastometers.
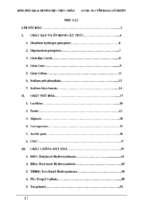
FIG. 4 Typical Compression Oscillogram
5
D 945
about 30 % of the required deformation in accordance with
9.16.1 and release. Repeat this operation 3 times to remove any
trapped air from the specimen.
9.16.9 With the hook still disengaged, rotate the drum chart
by turning the chronograph drum to the left displacing the chart
4 to 5 small divisions to the left of the pen point, thus marking
zero deflection.
9.16.10 Obtain at least 4 deflection readings by applying
approximately equal weights to the beam at intervals of 1 min
and record the corresponding deflections. Select the weights
applied to give deflection readings to include values on both
sides of the required deflection in accordance with 9.16.1. One
minute after the weight is applied, rotate the oscillogram to the
left by 2 small divisions and record the deflection in divisions
as D. Record the total number of 641.3-g (1.4137-lb) weights
on Rod F, Fig. 2, that produced the deflection D as nf in
accordance with 13.10.
9.13 With the hook still disengaged, rotate the chronograph
drum to the left clockwise, displacing the graph 4 or 5 small
divisions to the left of the pen point position. Thus marking
zero deflection.
9.14 Chart the loading test by placing the masses, MF or
MG, one at a time, alternately on front and back ends of the
cross rod and rotating the oscillogram exactly two 1-mm
divisions (or one 0.1-in. division as appropriate to the chart
used) to the left after each mass, except the last mass, has been
added. After 50 % deformation has been reached, or all masses
have been added, whichever comes first, chart the unloading
test by rotating the oscillogram to the right exactly in a reverse
number of small divisions and then removing the masses, one
at a time, from alternate sides of the balance beam and rotating
the oscillogram continuing exactly the same number of small
divisions to the right after each mass is removed. Add and
remove the masses at a uniform rate, using smooth motions. In
general, the time required for making the complete loading and
unloading curve, using 14 masses, ranges from 3 to 3.5 min.
Masses added at the G position have half the force value
compared with the F position. For most compositions, the
unloading curve will terminate below the horizontal line from
which the loading curve started.
9.15 When the oscillograph is not in use, leave a test
specimen between the platens to prevent damage to the knife
edges or to avoid personal danger in the event of accidental
release of the hook.
9.16 Procedure for Cellular Material:
9.16.1 Unless otherwise specified in the detail specification,
determine the compression resistance of the specimen at a
compression of 25 % of its original thickness.
9.16.2 Allow the specimen to rest undeflected and undistorted for at least 12 h before testing for compression resistance.
9.16.3 The specimen shall be free from mechanical damage.
Determine the thickness of the specimen in such a manner as
to indicate the perpendicular distance between the center
portion of the top and bottom faces and the value recorded to
the nearest 0.05 mm (0.002 in.), as T.
9.16.4 A perforated plate 64 mm (2 1⁄2 in.) square and a
circular depressor plate 45 mm (13⁄4 in.) in diameter fits into the
micrometer for compressing the specimen.
9.16.5 Lock the balance beam of the oscillograph in position by means of the hook at the left end of the machine and
remove all weights. Adjust the hook so that the static equilibrium position of the balance beam will be approximately
horizontal when the specimen is under the test deflection
desired.
9.16.6 Place the specimen between the perforated plate and
the depressor plate, adjust the micrometer until it rests on the
depressor plate without distorting the specimen, and lock the
micrometer in this position by means of the available set screw
or lock nut.
9.16.7 Place the graph paper on the chronograph drum and
adjust the position so that the zero position of the penpoint is
on one of the horizontal lines of the paper.
9.16.8 Disengage the hook and apply sufficient pressure by
hand on the pen end of the beam to compress the specimen
PART B—MEASUREMENTS IN SHEAR
10. Test Specimens
10.1 At least two specimens shall be tested and three shall
be required if measurement of creep is to be included. The test
specimens for measurements in shear shall be rectangular
sandwiches consisting of two blocks of the composition to be
tested adhered between parallel metal plates having dimensions
as given in Fig. 5 and as follows:
Dimensions of Shear Specimens
Primary Practice
Nominal Shear
Thickness, A
Nominal Shear
Area,
2 by B by C
SI units
Inch-pound units
12.5 mm
0.50 in.
600 mm2
0.884 in.2
10.2 The sandwiches are generally molded using brass or
steel plates (Fig. 5). Test specimens shall be free from porosity,
nicks, and cuts.
A
B
C
D
E
mm
12.5 6 0.02
12.7 6 0.02
23.62 6 0.02
38.10 6 0.033
3.18 6 0.01
FIG. 5 Shear Test Specimen
6
0.5
0.5
0.884
1.500
0.125
in.
6 0.001
6 0.001
6 0.001
6 0.001
6 0.0005
D 945
12.3 Place graph paper on the chronograph in accordance
with 9.3.
12.4 This section is directed toward measurement of initial
creep and set in shear. Proceed in accordance with 9.4, except
refer to Fig. 6 instead of Fig. 4 and omit the use of sandpaper
with the test specimen.
12.5 Proceed in accordance with 9.5.
12.6 Proceed in accordance with 9.6.
12.7 This section is directed toward the measurement of
Yerzley resilience and hysteresis, point modulus, frequency in
hertz, effective dynamic modulus, and impact energy absorbed
by the sample at the test load value. Taken alone, the procedure
described in this section is a rapid and informative test in shear
for comparison of several properties of elastomers.
12.8 Proceed in accordance with 9.8.
12.9 Proceed in accordance with 9.9.
12.10 This section is directed toward plotting of the loadshear characteristics of a specimen in a complete loading and
unloading cycle for interpretation of its static load-bearing
characteristics. This procedure may be performed before or
after the procedure of 12.7, but cannot be performed prior to
the procedure of 12.4, since it would eliminate the possibility
of measurement of initial creep.
12.11 Proceed in accordance with 9.11, referring to Fig. 6.
12.12 Proceed in accordance with 9.12, referring to Fig. 6.
12.13 Proceed in accordance with 9.13, referring to Fig. 6.
12.14 Chart the loading test by placing the masses, MF, one
at a time on opposite sides of the pen end of the beam and
rotating the oscillogram exactly two small divisions to the left
after each mass, except the last mass, has been added. After
50 % deformation is reached, or 14 masses have been added,
whichever comes first, chart the unloading test by rotating the
oscillogram to the right exactly two small divisions and then
removing the masses, one at a time, from alternate sides of the
balance beam and rotating the oscillogram exactly two small
divisions to the right after each mass is removed. An equivalent
alternative procedure suitable for the shear test is to add masses
MG on the cross rod, G, and to correspondingly rotate the
oscillogram 1 division for each step.
11. Conditioning
11.1 The conditioning requirements for shear specimens are
the same as that for compression (see Section 8).
12. Procedure
12.1 This procedure includes three categories of test operation which for clarity are described separately under subsequent section headings to provide data for purposes as follows:
12.1.1 In 12.4-12.6 for initial creep and set under a given
dead load.
12.1.2 In 12.7-12.9 for Yerzley resilience and hysteresis,
point modulus, frequency in hertz, effective dynamic modulus,
and maximum impact energy absorbed at a given test load
value.
12.1.3 In 12.10-12.14 for stepwise loading and unloading,
and hysteresis loop and stresses in pascals or in pounds-force
per square inch at any deformation.
12.1.4 Depending on the purpose of any test program,
primary reliance may be placed on any one of the foregoing
categories, on a combination of two categories, or upon all
three. It is important, however, to record adequately all data
required to identify the test conditions fully.
12.2 Lock the beam of the oscillograph in position by means
of the release hook at the left end of the machine, and remove
all masses. Remove the locating disk from the lower platen.
Support the metal plates of the test specimen with the end
plates provided to prevent spreading of the specimen under
load. Place the test specimen on the lower platen in such a
manner that the ring on the end plate drops into the counterbore
of the platen. Early models of the oscillograph require installation of vertical extension rods to accommodate shear specimens. Adjust the micrometer until the upper platen touches the
top surface of the test specimen without deforming it; then lock
the micrometer by means of the set screw or lock nut. This
setting can be verified as follows.
12.2.1 Upon disengaging the release hook the pen end
should retain its position. If it falls noticeably, (even 0.02-mm
or 0.001-in. change can be seen), the micrometer must be
readjusted downward.
12.2.2 When this adjustment is completed and verified,
reengage the hook. Now apply a small downward force by
hand on the pen end of the beam. If the added force depresses
the pen, the micrometer platen is too low. Readjust the
micrometer. When the micrometer setting is correct, opening
and closing the release hook should have no effect on the pen
position.
NOTE 2—Precaution: When the oscillograph is not in use, leave a test
specimen between the platens to prevent damage to the knife edges or to
avoid personal danger in the event of accidental release of the hook.
FIG. 6 Typical Shear Oscillogram
7
D 945
PART C—ANALYSIS OF THE
OSCILLOGRAM
NOTE 3—A variant of the resilience calculation is required in SAE J16
and Recommended Practice D 1207 as follows:
Yerzley Resilience, in percent, shall be determined as the average
computed from the second and third half cycles:
13. Calculation
13.1 The following mechanical properties in compression or
shear may be obtained directly from their respective oscillograms (Fig. 4 and Fig. 6) and shall be calculated as required in
accordance with 13.2-13.12, using the average of the values
from the two tests:
13.1.1 Initial creep, expressed in millimetres, inches, or
percent,
13.1.2 Initial set, expressed in millimetres, inches, or percent,
13.1.3 Yerzley resilience in percent,
13.1.4 Yerzley hysteresis in percent,
13.1.5 Point modulus in megapascals or pounds-force per
square inch,
13.1.6 Frequency in hertz,
13.1.7 Effective dynamic modulus in megapascals or
pounds-force per square inch,
13.1.8
Impact energy in the rubber spring (maximum) in
3
J/m or in inch-pounds per cubic inch of stock,
13.1.9 Plot of load versus deformation and recovery on
unloading,
13.1.10 Stress in megapascals or in pounds-force per square
inch to produce a specified deformation,
13.1.11 Deformation in millimetres, inches, or percent resulting from a specified load, and
13.1.12 Static (tangent) modulus in megapascals or poundsforce per square inch at a specified load or specified deformation.
13.2 Creep, expressed in millimetres, inches, or percent,
under a given load after any specified time interval shall be
derived from the vertical distance, PQ, on the oscillogram at
that load and elapsed time.
13.3 Set, expressed in millimetres, inches, or percent, may
be obtained on the conclusion of any test by measuring the
distance between the test specimen and the upper platen after
removing the load from the specimen by engaging the hook in
the end of the balance beam. Make this measurement by
turning the micrometer head until the platen again rests snugly
against the specimen and note the change. This distance is a
measure of the set in millimetres, or in inches. It may be
converted to a percentage of the original unstressed dimension
of the specimen. It can be considered a qualitative measurement for comparison with related samples under approximately
similar conditioning and time factors.
13.4 Yerzley Resilience, in percent, shall be computed from
the first cycle as follows:
Yerzley resilience, % 5 ~BC/AB! 3 100 ~Note 3!
Yerzley resilience, % 5 @~CD/BC! 1 ~DE/CD!# 3 50
(2)
where:
BC 5 vertical distance in millimetres or inches of the
upstroke of the first cycle of the damped sinusoidal
curve,
CD 5 vertical distance in millimetres or inches of the
downstroke of the second cycle of the damped
sinusoidal curve, and
DE 5 vertical distance in millimetres or inches of the
upstroke of the second cycle of the damped sinusoidal curve.
13.5 Yerzley Hysteresis is the percent of impact energy lost
by the sample due to internal friction. Numerically:
Yerzley hysteresis 5 ~100 2 Yerzley resilience!, %
(3)
13.6 Point Modulus is calculated by dividing the applied
stress in megapascals or in pounds-force per square inch by the
deformation, derived from the vertical distance AJ, expressed
as a decimal fraction of the unstressed height (in compression
tests) or of the unstressed thickness (in shear tests). The
numerical value of point modulus is dependent among other
things upon creep and set in the specimen. Determination of
point modulus based upon deformation from initial sample
dimension before stressing is analogous to service performance
of a new finished part.
13.7 Frequency—Determination of the frequency in hertz
shall be based on counting a convenient number of complete
cycles, then measuring the horizontal distance, JK, traversed
by this number of cycles, X, along the axis of the damped
sinusoidal curve. When the chronograph drum rotates at N rpm
and has a circumference C, calculate the frequency in hertz, f,
as follows:
f 5 ~NCX/60 JK!
(4)
where:
X 5 number of complete cycles under consideration,
JK 5 distance along the axis of the damped sinusoidal curve
for X cycles,
N 5 number of revolutions per minute of chronograph, and
C 5 circumference of oscillogram on drum.
13.8 Effective Dynamic Modulus9 in compression for the
specimen positioned at B, Kc, in megapascals based on the
cylindrical specimen 19.5 mm in diameter and 12.5 mm high,
shall be calculated as follows:
Kc 5 0.996 If 2
(5)
For the comparable shear specimen positioned at B, Ks,as
follows:
(1)
where:
BC 5 vertical distance in millimetres or inches of the
upstroke of the first cycle of the damped oscillatory
curve, and
AB 5 vertical distance in millimetres or inches of the
downstroke of the first cycle of the damped oscillatory curve.
Ks 5 0.498 If 2
where:
9
8
For derivation of K, refer to the paper by Yerzley, F. L.
(6)
D 945
The values 0.0813 slug·ft2 and 0.1160 slug·ft 2 are accepted
historically calculated values having approximate validity. The
value 0.0307 slug·ft2 for standard masses 3.25 in. in diameter
likewise has historic acceptance. When metricized, the foregoing value qualifications persist.
13.11 Impact Energy absorbed by the rubber spring (maximum), Ec, in joules per cubic metre of material at the end of the
first one-half cycle of the damped sinusoidal curve, applied to
tests of the 19.5-mm diameter cylinder, 12.5 mm high shall be
calculated as follows:
I 5 moment of inertia of the beam and masses used, kg·m2,
(see 13.10), and
f 5 frequency, Hz.
Similarly, calculate K c, in pounds-force per square inch,
based on the cylindrical specimen 0.75 in. in diameter and 0.50
in. high, as follows:
Kc 5 209.4 If 2
(7)
2
(8)
For Ks:
Ks 5 104.7 If
Ec 5 0.8 ~nF 1 0.5n G 2 nH! ~AB!
3 10 3 J/m3, using 489.462g masses
where:
I 5 moment of inertia of the beam and masses used, slug·ft2
(see 13.10).
13.9 Tests for Kc and K s may also be made with the test
specimen at the C and D positions with suitable mathematical
corrections. For example:
Kc 5 0.996 If
2
Kc 5 0.1594 If
2
MPa at position C, and Ks 5 0.0797 If
2
MPa
(10)
Kc 5 0.0623 If
2
MPa at position D, and Ks 5 0.0311 If
2
MPa
(11)
MPa at position B, and Ks 5 0.498 If
2
For the comparable shear sample Es:
E s 5 0.4 ~nF 1 0.5n G 2 nH! ~AB! 3 10 3 using 489.462g masses
(16)
where:
nF, n G, and nH
5 number of masses at positions F, G,
and H, respectively, and
AB
5 vertical distance in millimetres of the
downstroke of the first cycle of the
damped sinusoidal curve.
Similarly, calculate E c, in inch-pounds per cubic inch, based
on tests of the 0.75-in. diameter cylinder 0.50 in. high as
follows:
MPa
(9)
13.102 Total Moment of Inertia, I, of the beam in kg·m2 or
slug·ft is the sum of the moment of inertia of the beam and the
moments of inertia of all added masses. This is represented as
follows:
I 5 ~IB 1 I F ~nF 1 nH! 1 I GnG!
where:
IB 5 moment of inertia of beam,
IF 5 moment of inertia of a single standard mass
position F and H,
IG 5 moment of inertia of a single standard mass
position G,
nF 5 counted number of whole and fractional masses
position F,
nH 5 counted number of whole and fractional masses
position H, and
nG 5 counted number of whole and fractional masses
position G.
For convenience:
For the I-beam of the Advanced Yerzley Oscillograph:
Ec 5 4(n F + 0.5n G − nH)(AB), using 1.4137-lbm masses
For ES:
(12)
Es 5 2(n + 0.5nG − nH)( AB), using 1.4137-lbm masses
at
where:
AB 5 vertical distance in inches of the downstroke of the
first cycle of the damped-sinusoidal curve.
13.12 Static Modulus shall be determined from the slope of
the loading curve ( LM in Fig. 4 and Fig. 6) unless otherwise
specified. The loading and unloading deformation curves may
be obtained by projecting the horizontal lines scribed by the
pen to intersect the corresponding vertical line from which the
arc originated and then connecting these points of intersection,
thus forming the hysteresis loop. A convenient method of
determining the slope of a tangent line to curve LM and
converting it into inch-pound engineering units is as follows:
Place a straightedge in position to form a tangent line to curve
LM at a point representing the desired static deformation, select
a point where the extended tangent line crosses an intersection
on the paper, and count vertically 10 squares (dx 5 20 %
deformation) from there; then count the number of squares
horizontally, dy, until the tangent line is intercepted. This
number of squares on a compression oscillogram multiplied by
100 equals the static modulus in pounds-force per square inch
at the selected deformation. This number of horizontal squares,
dy, on a shear oscillogram multiplied by 25 equals the static
modulus in pounds-force per square inch at the selected
deformation.
13.13 Interpretation of Results:
13.13.1 Calculate the percent deflection of the specimen for
at
at
at
at
I 5 (0.1356 approx. + 0.00850n5 + 0.03129 n10) kg·m2 using 489.46-g masses
I 5 (0.1000 approx. + 0.00822n5 + 0.03220 n10) slug·ft2 using 641.5-g masses
The values 0.1356 kg·m2 and 0.1000 slug·ft 2 are representative values which are normally subject to replacement by
exact measured values for individual beams.
For the beam having a cross section of 1 by 1 in.:
I 5 ~0.0813 1 0.0307n! slug·ft2, using 641.252g masses
(15)
(13)
For the beam having a cross section of 1 by 1.5 in.:
I 5 ~0.1160 1 0.0307n! slug·ft2, using 641.252g masses
(14)
9
D 945
14.1.5 Appropriate added notes or observations.
each mass as follows:
Deflection, % 5 D/T
(17)
15. Precision and Bias
where:
D 5 deflection recorded on the oscillogram for each mass,
W, divisions, and
T 5 thickness of the original specimen, mm (in.).
15.1 This precision and bias section has been prepared in
accordance with Practice D 4483. Refer to Practice D 4483 for
terminology and other statistical calculation details.
15.2 Although prepared in format in accordance with Practice D 4483, the data generated for this test method precision
were obtained prior to the adoption of Practice D 4483. No
records exist for the original (raw) interlaboratory data. The
values of within- and between-laboratory standard deviation
have been used to construct Table 1.
15.3 A Type 1 (interlaboratory) precision was evaluated.
Both repeatability and reproducibility are short term, a period
of a few days separates replicate test results. A test result is the
value as specified by this test method.
15.4 Three different materials (rubbers) were used in the
interlaboratory program, these were tested in 12 laboratories on
3 different days. The results of the precision calculations for
repeatability and reproducibility are given in Table 1.
15.5 The precision of this test method may be expressed in
the format of the following statements which use what is called
an “appropriate value” or r, R, (r), or (R), that is, that value to
be used in decisions about test results (obtained with the test
method) for any particular test parameter.
13.13.2 Calculate the compressive stress of the specimen
for each mass as follows:
SI Equivalents:
Compressive stress, Pa 5 n F 3 100 000
(18)
Inch-Pound Equivalents:
Compressive stress, psi 5 n F 3 20
(19)
where:
nF 5 total number of 641.3-g (1.4137-lb) masses for each
deflection, D.
13.13.3 Unless otherwise specified in the detail specifications, test three specimens from each test unit.
13.13.4 Plot the average deflection in percent of the specimens tested for each mass against the average compressive
stress in pascals (or pounds-force per square inch) of the
specimens tested for each mass and draw a curve through the
points.
13.13.5 The compression resistance of the test unit shall be
the compressive stress required to produce a 25 % deflection as
read from the curve.
13.13.6 Record the compression resistance of the test unit to
the nearest 0.7 kPa (0.1 psi).
13.13.7 Record the percent the specimen was compressed.
13.13.8 If a plied-up specimen is tested, record the number
of plies.
14. Report
14.1 Report the following information:
14.1.1 Identification of test specimens,
14.1.2 Date of test,
14.1.3 Temperature of test,
14.1.4 Results from calculations (Section 13), and
10
D 945
TABLE 1 Type 1 Precision
NOTE 1—Sr5 within laboratory standard deviation.
r 5 repeatability (in measurement units).
(r) 5 repeatability (in percent).
SR5 between laboratory standard deviation.
R 5 reproducibility (in measurement units).
(R) 5 reproducibility (in percent).
Within Laboratory
Parameter or Property
Yerzley Resilience, (%)
Yerzley Hysteresis, (%)
Dynamic Modulus, (MPa)
Static Modulus, (MPa)
Impact Energy, (J/m3)
Frequency, (Hz)
Frequency, (Hz)
Range
25 to 90
10.0 to 73.5
1.9 to 3.8
1.1 to 9.3
85 to 383 (103)
2.5 to 3.5
3.5 to 8
Mean
57.5*
41.8
2.9
5.2
234 (103)
3.0
5.8
Sr
r
0.30
0.25
0.11
0.38
0.82 (103)
0.01
0.026
15.6 Repeatability— The repeatability, r, of this test method
has been established as the appropriate value for any parameter
tabulated in Table 1. Two single test results, obtained under
normal test method procedures, that differ by more than this
tabulated r (for any given level) must be considered as derived
from different or nonidentical sample populations.
15.7 Reproducibility— The reproducibility, R, of this test
method has been established as the appropriate value for any
parameter tabulated in Table 1. Two single test results obtained
in two different laboratories, under normal test method procedures, that differ by more than the tabulated R (for any given
level) must be considered to have come from different or
nonidentical sample populations.
15.8 Repeatability and reproducibility expressed as a per-
0.85
0.71
0.32
1.07
2.31 (103)
0.028
0.074
Between Laboratory
(r)A
Sr
R
1.47
1.70
11.0
20.6
1.0
0.93
1.3
1.78
0.94
0.64
4.57
18.7 (103)
0.01
0.12
5.0
2.66
1.83
13.0
53.0 (103)
0.028
0.32
(R)A
8.7
6.4
63
250
22.6
0.93
5.5
centage of the mean level, (r) and ( R), have equivalent
application statements as 15.6 and 15.7 for r and R. For the (r)
and (R) statements, the difference in the two single test results
is expressed as a percentage of the arithmetic mean of the two
test results.
15.9 Bias—In test method terminology, bias is the difference between an average test value and the reference (or true)
test property value. Reference values do not exist for this test
method since the value (of the test property) is exclusively
defined by the test method. Bias, therefore, cannot be determined.
The American Society for Testing and Materials takes no position respecting the validity of any patent rights asserted in connection
with any item mentioned in this standard. Users of this standard are expressly advised that determination of the validity of any such
patent rights, and the risk of infringement of such rights, are entirely their own responsibility.
This standard is subject to revision at any time by the responsible technical committee and must be reviewed every five years and
if not revised, either reapproved or withdrawn. Your comments are invited either for revision of this standard or for additional standards
and should be addressed to ASTM Headquarters. Your comments will receive careful consideration at a meeting of the responsible
technical committee, which you may attend. If you feel that your comments have not received a fair hearing you should make your
views known to the ASTM Committee on Standards, 100 Barr Harbor Drive, West Conshohocken, PA 19428.
This standard is copyrighted by ASTM, 100 Barr Harbor Drive, West Conshohocken, PA 19428-2959, United States. Individual
reprints (single or multiple copies) of this standard may be obtained by contacting ASTM at the above address or at 610-832-9585
(phone), 610-832-9555 (fax), or
[email protected] (e-mail); or through the ASTM website (http://www.astm.org).
11