Public Disclosure Authorized
Public Disclosure Authorized
Public Disclosure Authorized
Public Disclosure Authorized
V I E T N A M CO U N T RY ST U DY
i
70272
Economics of Adaptation to Climate Change
VIETNAM
ii
E C O N O M I C S O F A D A P TAT I O N T O C L I M AT E C H A N G E
EACC Publications and Reports
1. Economics of Adaptation to Climate Change: Synthesis Report
2. Economics of Adaptation to Climate Change: Social Synthesis Report
3. The Cost to Developing Countries of Adapting to Climate Change: New Methods
and Estimates
Country Case Studies:
1. Bangladesh: Economics of Adaptation to Climate Change
2. Bolivia: Adaptation to Climate Change: Vulnerability Assessment and Economic Aspects
3. Ethiopia : Economics of Adaptation to Climate Change
4. Ghana: Economics of Adaptation to Climate Change
5. Mozambique: Economics of Adaptation to Climate Change
6. Samoa: Economics of Adaptation to Climate Change
7. Vietnam: Economics of Adaptation to Climate Change
Discussion Papers:
1. Economics of Adaptation to Extreme Weather Events in Developing Countries
2. The Costs of Adapting to Climate Change for Infrastructure
3. Adaptation of Forests to Climate Change
4. Costs of Agriculture Adaptation to Climate Change
5. Cost of Adapting Fisheries to Climate Change
6. Costs of Adaptation Related to Industrial and Municipal Water Supply and
Riverine Flood Protection
7. Economics of Adaptation to Climate Change-Ecosystem Services
8. Modeling the Impact of Climate Change on Global Hydrology and Water Availability
9. Climate Change Scenarios and Climate Data
10. Economics of Coastal Zone Adaptation to Climate Change
11. Costs of Adapting to Climate Change for Human Health in Developing Countries
12. Social Dimensions of Adaptation to Climate Change in Bangladesh
13. Social Dimensions of Adaptation to Climate Change in Bolivia
14. Social Dimensions of Adaptation to Climate Change in Ethiopia
15. Social Dimensions of Adaptation to Climate Change in Ghana
16. Social Dimensions of Adaptation to Climate Change in Mozambique
17. Social Dimensions of Adaptation to Climate Change in Vietnam
18. Participatory Scenario Development Approaches for Identifying Pro-Poor Adaptation Options
19. Participatory Scenario Development Approaches for Pro-Poor Adaptation: Capacity
Development Manual
V I E T N A M CO U N T RY ST U DY
i
Economics of Adaptation
to Climate Change
VI ETNAM
Ministry of Foreign Affairs
Government of the Netherlands
ii
E C O N O M I C S O F A D A P TAT I O N T O C L I M AT E C H A N G E
© 2010 The World Bank Group
1818 H Street, NW
Washington, DC 20433
Telephone: 202-473-1000
Internet: www.worldbank.org
E-mail:
[email protected]
All rights reserved.
This volume is a product of the World Bank Group. The World Bank Group does not guarantee the accuracy of the data
included in this work. The boundaries, colors, denominations, and other information shown on any map in this work do not
imply any judgment on the part of the World Bank Group concerning the legal status of any territory or the endorsement or
acceptance of such boundaries.
RIGHTS AND PERMISSIONS
The material in this publication is copyrighted. Copying and/or transmitting portions or all of this work without permission
may be a violation of applicable law. The World Bank Group encourages dissemination of its work and will normally grant
permission to reproduce portions of the work promptly.
For permission to photocopy or reprint any part of this work, please send a request with complete information to the Copyright
Clearance Center Inc., 222 Rosewood Drive, Danvers, MA 01923, USA; telephone 978-750-8400; fax 978-750-4470;
Internet: www.copyright.com.
All images © The World Bank Photo Library, except
Pages 28, 40, 72, and inside back cover © Shutterstock
V I E T N A M CO U N T RY ST U DY
iii
Contents
Acronyms
Acknowledgments
vii
ix
Executive Summary
xi
1 Introduction
1
2 Projections of Climate Change and Sea Level Rise
5
Regional Projections
National Projections
Climate Scenarios
5
6
9
3 Agriculture
11
The Impact of Climate Change on Crop Production
The Macroeconomic Consequences of Climate Change
Adaptation to Climate Change
Macroeconomic Effects of Adaptation
15
19
22
26
4 Aquaculture
29
The Growth of Aquaculture in Vietnam
The Impact of Climate Change on Aquaculture
Economic Analysis of Adaptation
29
32
37
5 Forestry
43
The Impact of Climate Change on Forests
Adaptation Measures in the Forestry Sector
44
51
6 Adaptation at the Local Level: Social Analysis
55
Social Vulnerability to Climate Change
Adaptation to Climate Change at the Local Level: A Social Analysis
55
66
iv
E C O N O M I C S O F A D A P TAT I O N T O C L I M AT E C H A N G E
7 Coastal Ports
73
Coastal Ports and Sea Level Rise
Adaptation Costs and Options
73
75
8 Lessons Learned
77
References
80
Annexes (available on line at www.worldbank.org/eacc)
Tables
ES-1. Regional Vulnerability to Climate Change
ES-2. Change in Crop Production in 2050 due to Climate Change with No Adaptation
ES-3. Macroeconomic Effects of Climate Change Without/with Adaptation in 2050
1. Projected Climate Change for Southeast Asia, 2080–99 against 1980–99
2. Projected Increases in Annual Average Temperatures relative to 1980–99
3. Projected Changes in Annual Rainfall relative to 1980–99
4. Projected Sea Level Rise in Vietnam
5. Increases in Annual Average Temperatures by Climate Scenario and Zone
6. Increases in Annual Precipitation by Climate Scenario and Zone
7. Possible Impacts of Climate Change on Agriculture
8. Exposure to Hydro-climatic Risks by Agroecological Zone
9. Harvested Areas and Crop Yields by Agroecological Zones, 2007
10. Percentage Shares of Crop Production by Agroecological Zone, 2007
11. Typical Seasonal Crop Rotations by Agroecological Zone
12. Potential Impacts of Climate Change on Crop Yields
13. Impact of Yield Changes on Production by Scenario in 2030 and 2050
14. Total Impact of Climate Change on Production by Scenario in 2050
15. Population, GDP and Employment Projections, 2005–50
16. Changes in Baseline GDP and Aggregate Consumption due to Climate Change
17. Changes in Value-Added by Sector due to Climate Change
18. Changes in Household Consumption by Income Group due to Climate Change
19. Expansion in Crop Irrigation by 2050
20. Changes in Real GDP and Aggregate Consumption Without/with Adaptation
21. Present Values of Changes in Aggregate Consumption
22. Adaptation Results by Sector and Region, 2050
23. Changes in Household Consumption by Income Group Without/with Adaptation
xii
xiv
xv
5
7
7
7
8
8
11
12
13
13
14
17
18
18
20
21
21
22
25
25
27
27
27
V I E T N A M CO U N T RY ST U DY
24. Aquaculture Development Targets up to 2020
25. Main Salinity and Temperature Requirements for Catfish and Shrimp
26. Estimates of Catfish Pond Area (ha) that will be Subjected to Increments
of Maximum Flooding Depths in the Rainy Season under 50-cm SLR Scenario
27. Land Use Types that will be Subjected to > 4 ppt Maximum Salinity Intrusion
in the Dry Season under 50-cm SLR Scenario
28. Forest Area and Cover by Region, 2006
29. Classification of Forest Types by Location and Climate Characteristics
30. Impact of Climate Change on Stand Volumes of 7-year Acacia mangium
31. Estimated Areas Climatically Suited to some Forest Types
32. Dependency on Different Income Streams by Region
33. Regional Distribution of Minority Populations
34. Statistics on Female Status by Region
35. Literacy and Education Rates, 2001
36. Household Access to Water, 2005
37. Drivers and Impacts of Climate Change on Coastal Ports
v
32
34
36
37
43
44
48
48
49
58
59
60
63
64
75
Figures
1. Framework for Analysis of the Impacts of Climate Change
15
2. Flood Inundation with 30 cm Sea Level Rise in the Mekong Delta
16
3. Value of Production from Capture Fisheries and Aquaculture
29
4. Aquaculture Area and Production in Vietnam’s Southern Provinces, 2009
30
5. Value of (a) Brackish Water and (b) Catfish Produced in the Mekong River Delta
31
6. Global Warming and Fisheries/Aquaculture: Potential Impacts
33
7. Areas in An Giang, Dong Thap and Can Tho Provinces Subjected to Increments
35
of Maximum Flooding Depths for 50-cm SLR Scenario
8. Areas Subjected to Increments of Maximum Water Salinity for 50-cm SLR scenario
36
9. Steps in the Economic Analysis
38
10. Reduction in Net Income from Catfish Farming due to Climate Change
39
without Adaptation
11. Reduction in Net Income from Shrimp Farming due to Climate Change
39
without Adaptation
12. Poverty Map of Vietnam at District Level
57
13. Survey Location
67
14. Most Important Seaports
74
15. Volume and Distribution of Cargo Throughput
74
Boxes
1. CGE Modeling
19
vi
E C O N O M I C S O F A D A P TAT I O N T O C L I M AT E C H A N G E
V I E T N A M CO U N T RY ST U DY
vii
Acronyms
ADB
AEZ
CGE
CMI
CSIRO
DFID
EACC
FHH
GCM
GDP
GIS
GoV
GSO
IAE
IPCC
MARD
Asian Development Bank
Agroecological Zone
Computable general equilibrium
Climate moisture index
Commonwealth Scientific and
Industrial Research Organisation
Department for International
Development (UK)
Economics of Adaptation to
Climate Change
Female-headed household
General circulation model
Gross domestic product
Geographical information system
Government of Vietnam
General Statistics Office
Institute for Agriculture and
Environment
Intergovernmental Panel on
Climate Change
Ministry of Agriculture and Rural
Development
MoLISA
Ministry of Labor, Invalids, and
Social Affairs
MoNRE
Ministry of Natural Resources and
Environment
NCAR
National Center for Atmospheric
Research
NGO
Non-governmental organization
NTP-RCC National Target Program to
Respond to Climate Change
ppt
Parts per thousand
SIWRP
Southern Institute for Water
Resources Planning
SLR
Sea level rise
UNDP
United Nations Development
Programme
VHLSS
Vietnam Household Living
Standards Survey
VNĐ
Vietnamese Đong
Note: Unless otherwise noted, all dollars are U.S.
dollars, all tons are metric tons.
viii
E C O N O M I C S O F A D A P TAT I O N T O C L I M AT E C H A N G E
V I E T N A M CO U N T RY ST U DY
ix
Acknowledgments
This report is the outcome of a research effort
to which both national and international experts
have contributed in the context of the Economics
of Adaptation of Climate Change study (EACC)
implemented by the World Bank and funded by
the governments of the Netherlands, Switzerland,
and the United Kingdom.
The team effort in Vietnam was led and coordinated by Benoit Laplante with the support of
Huynh Thi Thanh Thuy. The synthesis report
was edited by Gordon Hughes (Consultant). We
would like to thank the following individuals and
organizations: Sergio Margulis (Team leader of
the EACC study), Douglas J. Graham (Environment Country Sector Coordinator), Laurent
Cretegny, Robin Mearns, Steve Jaffee, Anne
Kuriakose, Ian Noble, and Kiran Pandey (Coordinator EACC country studies) (World Bank);
David Corderi (Consultant); Tingju Zhu and Zhe
Guo (International Food Policy Research Institute); Le
Heng Nam, Nguyen Thuy Hang, Ha Le Thanh,
and Thuy Dung (Institute of Water Resources Planning); Nguyen Ngoc Anh, Nguyen Xuan Hien, Do
Duc Dung, Nguyen Vu Huy, Nguyen Huy Khoi,
Thi Lan Huong, Le Ngoc Anh, Tran Duc Dung,
and Cao Thi Tu Trinh (Southern Institute of Water
Resources Planning); Philip Adams, James Giesecke,
Michael Jerie, and Nhi Hoang Tran (Centre of
Policy Studies, Monash University); To Trung Nghia,
Le Hung Nam, Le Hong Tuan, Truong Trong
Luat, and Vu Dinh Huu (Institute of Water Resources
and Planning); Pham Quang Ha, Mai Van Trinh,
Tran Van The, and Vu Duong Quynh (Institute for
Agricultural Environment); Bao Thanh, Luong Van
Viet, Nguyen Thi Phuong, and Bui Chi Nam
(Sub-Institute of Hydrometeorology and Environment
of South Viet Nam); Tuyen Nghiem, Hue Le, and
Huoung Vu Dieu (Center for Natural Resources and
Environmental Studies); Pamela McElwee (Arizona
State University); Dang Thu Phuong (Challenge to
Change); Nguyen Van Be, Le Canh Dung, Nguyen
Hieu Trung, and Sinh Le Xuan (Can Tho University); Suan Pheng Kam, Marie Caroline Badjeck,
Michael Phillips, and Robert Pomeroy (World Fish
Center); Louise Teh and Lydia The (University of
British Columbia); Be Nam Vo Thi (Sub-National
Institute for Agricultural Planning and Projection); and
Hien Than Thi and Hue Nguyen Thu (Centre for
Marinelife Conservation and Community Development).
We would also like to thank Robert Livernash for
editorial services, Jim Cantrell for editorial input
and production coordination, and Hugo Mansilla
for editorial and production support.
x
E C O N O M I C S O F A D A P TAT I O N T O C L I M AT E C H A N G E
V I E T N A M CO U N T RY ST U DY
xi
Executive Summary
The Economics of Adaptation to Climate
Change (EACC) study aims to support countries
to understand the risks posed by climate change
and to design better strategies to adapt to climate
change. In doing so, a key objective of the study
is to help decision makers at the national level to
integrate robust adaptation strategies into their
development plans and budgets in a context of
high uncertainty, competing needs, and limited
financial resources. In addition to providing estimates of adaptation costs at the global level,1
the EACC study has implemented country-level
studies for Bangladesh, Bolivia, Ethiopia, Ghana,
Mozambique, Samoa, and Vietnam.2
et al. 2010, Almeida et al. 2010), social (McElwee
et al. 2010), and coastal ports (VIMARU 2010).
Further details can be found in the individual
sector reports prepared by teams of national and
international experts.
Vulnerability to
Climate Change
1 At the global level, the EACC study estimates that it will cost
between $70 and $100 billion each year to adapt to climate
change over the period 2010 to 2050.
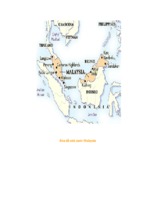
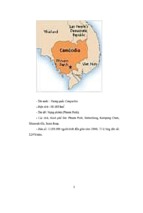
Vietnam is a long narrow country consisting of
an extensive coastline, two major river deltas, and
mountainous areas on its eastern and northeastern borders. Vietnam is heavily exposed to the
risks of weather variability and climate change.
Its vulnerability to weather risks has given the
country experience in designing and implementing measures to mitigate the effects of droughts,
flooding, storms, and similar events on agriculture
and other sectors of the economy. Assessing the
potential impacts of climate change and determining how best to adapt represents a new challenge, for which past experience may be a guide
but which is accompanied by large uncertainties.
2 The study was funded by the governments of the United
Kingdom, Netherlands, and Switzerland. Further details may be
found at: www.worldbank.org/eacc. In addition, the synthesis
report from Vietnam and the six underlying national sector
reports can be downloaded from the Environment site of the
World Bank’s web site for Vietnam: www.worldbank.org/vn/
environment.
In June 2009, the Ministry of Natural Resources
and Environment (MoNRE) published Vietnam’s official scenario for climate change. The
MoNRE scenario falls in the middle of a range of
This report provides a synthesis of key findings
of sector studies undertaken in Vietnam in the
context of the EACC study. The sector studies
were on agriculture (Zhu & Guo 2010), a separate
computable general equilibrium [CGE] analysis
based on agriculture findings (Adams et al. 2010),
aquaculture (Kam et al. 2010), forestry (Phuong
xii
E C O N O M I C S O F A D A P TAT I O N T O C L I M AT E C H A N G E
Table ES-1 Regional Vulnerability to Climate Change
Region
Northwest
NW
Northeast
NE
Red River
Delta
RRD
North
Central
Coast
NCC
South
Central
Coast
SCC
Central
Highlands
CHL
Mekong
River
Delta
MRD
Southeast
SE
EXPOSURE
Storms
1
3
4
4
4
2
2
3
Flooding
1
1
4
4
4
2
2
4
Salinity
0
0
1
2
2
0
1
4
SLR
0
0
2
2
2
0
3
4
Landslides
3
3
1
3
3
2
1
1
Drought
2
2
1
4
4
4
2
2
Average
1.2
1.5
2.2
3.2
3.2
1.7
1.8
3.0
SENSITIVITY
Poverty
4
3
2
4
2
4
1
2
Economic
diversification
4
4
2
4
3
4
2
2
Education
4
3
1
2
2
2
1
3
Health &
sanitation
4
1
2
1
1
1
1
3
Ethnic
minorities
4
3
0
1
1
4
1
2
Women &
children
4
3
1
2
3
3
1
2
Migrants
0
0
2
2
1
4
4
1
Urban
households
0
0
2
1
1
0
4
3
3.0
2.1
1.5
2.1
1.8
2.8
1.9
2.3
Average
alternative climate scenarios for Vietnam when
these are arranged by their climate moisture
indices. In addition to the MoNRE scenario, the
EACC study has made use of two other climate
scenarios—Dry (IPSL-CM4) and Wet (GISSER)—which represent the extremes of the distribution by climate moisture indices.
Rainfall projections across seasons are of particular interest. The dry seasons are projected to get
drier, with the March–May rainfall reductions
being higher in the southern part of the country;
the wet seasons are projected to get wetter, with the
June–August rainfall increases being higher in the
northern part of the country. Hence, it is expected
that rainfall will be concentrated even more than
now in the rainy season months, leading to an
increase in the frequency, intensity, and duration
of floods, and to an exacerbation of drought problems in the dry season. Sea level is projected to rise
approximately 30 cm by 2050 and up to 75 cm by
2100 under the medium scenario.
An analysis of vulnerability to climate change at
the sub-national level was carried out as part of
the social analysis. Exposure to climate change is
assessed by considering the number of households
potentially threatened by the effects of storm,
flooding, salinity intrusion, sea level rise (SLR)
and storm surges, landslides and flash floods,
and drought. Each region is assigned to categories ranked from 0 to 4 (low to severe exposure).
V I E T N A M CO U N T RY ST U DY
Similarly, sensitivity to the impacts of climate is
assessed on criteria that reflect vulnerability to the
consequences of climate change based on specific
socioeconomic characteristics—poverty, economic
diversification, education, and health and sanitation—and for specific social groups, including
ethnic minorities, women and children, migrant
populations, and urban populations. Again, each
region is assigned to categories ranked from 0 to 4
(low to extreme sensitivity). Unweighted averages
of the classifications were computed to generate indices of exposure and sensitivity. These are
shown in Table ES-1 (see also Figure 13 in main
text which shows the regions on a map).
The analysis indicates that exposure to the effects
of climate change is highest in the Central Coastal
regions (NCC & SCC) and in the Mekong River
Delta. On the other hand, sensitivity to the effects
of climate change is highest in the North-West
and Central Highland regions. The correlation
between exposure and sensitivity is negative, so
that regions with high exposure tend to have low
sensitivity and vice versa. The only region with
indices that are above the average on both measures is the Mekong River Delta.
Methodology
The sectors were chosen based on interest of the
Government, availability of data, the opportunity
to pilot different methodological approaches, and
the feasibility of carrying out an analysis. Some
other sectors that were not looked at (e.g., urban
infrastructure) could well be be subject to more
important climate change impacts. Detailed studies were carried out for agriculture (crop production), aquaculture, forestry, and coastal ports, as
well as a broader study on social vulnerability.
Each of the sector studies follows a broadly similar approach with the following steps:
Step 1: Establish a baseline scenario consisting of
projections of land use, production, value-added,
xiii
population growth, urbanization, and other variables without climate change. This provides the
reference scenario against which the impacts of
climate change without and with adaptation are
measured.
Step 2: Consider the relevant climate variables for
the sector and identify changes projected to 2050
or beyond for each of the climate scenarios. This
makes use of detailed information on precipitation by season and/or region.
Step 3: Identify the impact of changes in climate
on resource productivity and land use. This
included, for example, the effect of changes in
seasonal temperatures on rice yields or of seasonal
precipitation on coffee yields, as well as the effect
of flooding or saline intrusion on the amount of
land that can be used for rice production in the
Mekong River Delta.
Step 4: Using geographical information systems
(GIS) and other techniques, combine the information collected in Steps 2 and 3 to estimate the
overall impact of climate change on land use and
production by comparing estimates of yields and
production under (a) no climate change, and (b)
with climate change but no adaptation.
Step 4A: For agriculture, incorporate the results
from Step 4 into a macroeconomic model to assess
the consequences of changes in agricultural output
on agricultural prices, trade, GDP, economic activity in other sectors, and household consumption.
Step 5: Identify opportunities for (a) autonomous
adaptation undertaken by farmers and other producers in responses to changes in climate and
other conditions, and (b) planned adaptation,
which is likely to be initiated and at least partly
funded by the government.
Step 6: Estimate the production of crops, timber,
and so on under the new climate conditions after
the adaptation measures have been implemented.
xiv
E C O N O M I C S O F A D A P TAT I O N T O C L I M AT E C H A N G E
This provides the basis for identifying (a) the
effect of climate change with adaptation (the difference between the baseline scenario and the
scenario of climate change with adaptation), and
(b) the impact of adaptation itself (the difference
between the scenarios of climate change without
and with adaptation).
Step 6A: As for Step 4A, incorporate the results
from Step 6 into the macroeconomic model
to assess the benefits of adaptation in terms of
aggregate and sectoral economic activity and
household consumption.
Many of the adaptation options are “no regrets”
options that increase yields or production even
without climate change. This is not invariably
the case, for example there would be no need to
upgrade ports if sea level and storm surges do
not change. However, for agriculture and other
sectors it is difficult to identify measures that are
only justified under a specific set of climate conditions. For these sectors, adaptation is often a
matter of doing things that would in any event
have been economic under a wide range of climate conditions.
Agriculture
The impact of the alternative climate scenarios
on crop production has been examined using projections of runoff, which affects the availability of
irrigation water, plus agronomic models that take
account of temperature and rainfall patterns,
water availability for rainfed and irrigated crops,
and other factors to estimate the impact of climate change on crop yields.
Changes in yields without adaptation vary widely
across crops, agroecological zones, and climate
scenarios. As for other EACC studies, the results
reported do not take account of CO2 fertilization, because of the uncertainties about the extent
of this effect; taking this into effect might have
reduced the severity of some predicted productivity declines. For rice, the Dry scenario would lead
to reductions in yields ranging from 12 percent in
the Mekong River Delta to 24 percent in the Red
River Delta. The primary factors influencing rice
yields are the increase in average temperatures
and seasonal reductions in runoff.
There would be more extensive inundation of
crop land in the rainy season and increased saline
intrusion in the dry season as a consequence of
the combination of sea level rise and higher river
flooding. For the Mekong River Delta, it is estimated that about 590,000 ha of rice area could
be lost due to inundation and saline intrusion,
which accounts for about 13 percent of today’s
rice production in the region.
Table ES-2 shows the potential impact of climate
change without adaptation under alternative climate scenarios on production of six major crops
or crop categories relative to a 2050 baseline of
no climate change. Paddy rice production may
fall by 5.8 (MoNRE) to 9.1 (Dry) million tons
(mmt) per year.
Table ES-2 Change in Crop Production in 2050 due to Climate Change
with No Adaptation (million metric tons)
Climate
scenario
Impact
Paddy rice
Yields
Sea level
Total
Maize
Yields
Cassava
Yields
Sugar cane
Yields
Coffee
Yields
Vegetables
Yields
Dry
-6.7
-2.4
-9.1
-1.1
-1.9
-3.7
-0.4
-1.7
Wet
-5.8
-2.5
-8.4
-1.0
-2.6
-2.9
-0.4
-3.1
MoNRE
-3.4
-2.4
-5.8
-0.3
-0.6
-1.4
-0.1
-0.9
V I E T N A M CO U N T RY ST U DY
xv
These figures are not forecasts of what will actually happen. Farming involves a continuous process of
adaptation to weather, technology, economic and
other influences, so adaptation will certainly take
place. Rather, these projections provide a starting
point—based on the best available information
and subject to substantial uncertainty—for (a)
understanding the potential importance of climate change for crop production holding other
factors constant, and (b) assessing the type and
scale of adaptation that may be required, which
will require a combination of autonomous adaptation (by farmers) and planned adaptation (as a
consequence of government policy).
Macroeconomic impacts. As in the other EACC
country studies, a computable general equilibrium
(CGE) model has been used to examine the macroeconomic impacts of climate change. In Vietnam,
the CGE model was only used to take into account
the effects of climate change and adaptation for
the agricultural sector, so it does not attempt to
take account of all of the macroeconomic impacts
of climate change. The CGE model establishes
a baseline composition of economic activity up
to 2050, given data and assumptions about interindustry linkages for 158 sectors, including regional
crop production for the six crops examined above,
consumption for ten rural/urban household
groups, population, investment, and productivity
growth. This is used to simulate the effect of exogenous “shocks;” that is, deviations from the baseline
scenario, such as a reduction in crop production
due to climate change. The model is run assuming
that the aggregate level of investment and savings
remains constant in real terms, so that aggregate
consumption moves with gross domestic product
(GDP). The model takes account of the effects of
exogenous shocks on industry and services, international trade, commodity prices and the distribution
of consumption. A broad picture of its results may
be obtained by examining changes in total GDP,
aggregate consumption, and other variables under
Further, this assessment of the potential impact
of climate change on crop production needs to be
interpreted in a larger context. Changes in diets
and consumer preferences with falling demand
for rice, market liberalization, trade (which will
expose Vietnam to lower-cost competition), and
conversion opportunities to aquaculture and
more salt-tolerant varieties will all have important
effects on the demand for and the supply of agricultural products over the coming decades. The
impacts of climate change have to be assessed
against a background of wider economic and
social development.
Table ES-3 Macroeconomic Effects of Climate Change
Without/with Adaptation in 2050(Percentage deviations from baseline
with no climate change)
No adaptation (%)
Dry
(1)
GDP
-2.4
Wet
(2)
MoNRE
(3)
-2.3
-0.7
With adaptation (%)
Dry
(4)
Wet
(5)
MoNRE
(6)
-1.1
-0.7
0.7
Adaptation benefits (%)
Dry
(7)
1.3
Wet
(8)
1.6
MoNRE
(9)
1.3
Aggregate consumption
-2.5
-2.5
-0.7
-1.4
-0.8
0.6
1.1
1.7
1.3
Agricultural value-added
-13.9
-13.5
-5.8
-3.8
-3.4
5.4
10.0
10.1
11.2
-6.6
-6.1
-2.6
0.5
-0.3
4.8
7.1
5.8
7.4
1.1
0.8
1.0
0.0
1.1
0.2
1.1
0.3
0.9
Bottom quintile
-6.5
-6.3
-2.6
-1.9
-1.4
2.4
4.7
4.9
5.0
Top quintile
-1.6
-1.7
-0.4
-1.5
-1.0
0.0
0.1
0.7
0.0
REGIONAL GDP
North-Central Coast
South-East
RURAL HOUSEHOLD CONSUMPTION
xvi
E C O N O M I C S O F A D A P TAT I O N T O C L I M AT E C H A N G E
the alternative climate scenarios in 2050 relative to
a baseline with no climate change.
Total GDP and aggregate consumption in 2050
with no adaptation will be 2.4–2.3 percent lower
than the baseline under the Dry/Wet scenarios
but only 0.7 percent lower under the MoNRE scenario, shown in columns (1) through (3) of Table
ES-3. The reason for the reduction in GDP is the
decline in agricultural value-added of 13.9/13.5
percent under the Dry/Wet scenarios, which is
marginally offset by small increases in value-added
in industry and services. There are significant differences between the impact of climate change on
different regions, as illustrated by the estimates for
changes in regional GDP for the North- Central
Coast and South-East regions. The gain in the
South-East is a consequence of the concentration
of industry and services in the region.
The impact on household incomes is skewed,
with greater losses for those in the bottom rural
quintile (the poorest 20 percent of rural households arranged by expenditure per person) than
for the top quintile. Poor rural and urban households are most vulnerable because they rely
more heavily on the agricultural sector for their
incomes and they spend a higher proportion of
their income on food, which becomes relatively
more expensive.
Adaptation in agriculture. The study examined a range of adaptation options including
autonomous adaptations undertaken by farmers
as well as planned adaptation underpinned by
government spending in areas that will enhance
the capacity of farmers to adapt. The autonomous adaptations include changes in sowing
dates, switching to drought-tolerant crops, adoption of salinity-tolerant varieties of rice, adoption
of new varieties for other crops, and switching to
rice-fish rotations. The planned adaptations focus
on (a) increased spending on research, development, and extension with the goal of raising average crop yields by 13.5 percent relative to the
baseline, and (b) extending the area of irrigated
land by about 688,000 ha, roughly half for rice
and the remainder mainly for maize and coffee.
The total cost of these measures is estimated at
about $160 million per year at 2005 prices without discounting over the period 2010–50.
Deviations in GDP and other macroeconomic
variables from the baseline with adaptation for
the alternative climate scenarios are shown in
columns (4) through (6) of Table ES-3, while
columns (7) through (9) give the net benefits of
adaptation after allowing for the costs that are
incurred. The adaptation measures substantially
reduce the impact of climate change under
all scenarios. The expenditures on adaptation
for agriculture are clearly justified as the ratio
of their benefits to the costs that are incurred
is much greater than 1. The combination of
the MoNRE scenario with adaptation leads to
an increase in aggregate consumption, indicating that some, perhaps many, of the adaptation
measures are “no regrets” options that would be
justified even without climate change.
An important aspect of adaptation is that it offsets most of the disproportionate impact of climate change on poorer households. The bottom
quintile of rural households benefit most from
adaptation and the gap between the changes
in household consumption for the bottom and
top quintiles is almost eliminated. Adaptation
partly or wholly offsets both the reduction in
agricultural incomes and the increase in food
prices that accompany climate change without
adaptation.
Investments in flood and coastal protection were
not incorporated in the macroeconomic analysis.
Separate studies have indicated that the costs of
building/upgrading sea dikes and flood defenses
to protect urban infrastructure and the most valuable agricultural land would be about 1 percent
of total investment—about $540 million per year
at 2005 prices.
V I E T N A M CO U N T RY ST U DY
Other Sectors
Aquaculture. Aquaculture, especially in the
Mekong River Delta, is an important source of
employment and rural income. It is estimated
that some 2.8 million people are employed in
the sector, while export revenue is expected to be
about $2.8 billion in 2010. Higher temperatures,
an increased frequency of storms, sea level rise,
and other effects of climate change are likely to
affect fish physiology and ecology as well as the
operation of aquaculture. Some fish species, such
as catfish, may grow more rapidly with higher
temperatures but be more vulnerable to disease.
The main impacts of climate change on aquaculture seem likely to be a consequence of increased
flooding and salinity.
Parts of the aquaculture sector, particularly catfish farming, currently face uncertain economic
prospects, particularly as a result of rising prices
for feedstuffs and the costs of maintaining water
quality. Without adaptation, it is likely that climate
change will reduce profit margins, so that only
the most efficient aquaculturists who adopt best
practices will survive. Successful adaptation will
require a combination of better feed conversion
and improvements in marketing together with
investments in upgrading dikes to reduce flooding and salinity intrusion that will benefit other
sectors as well as aquaculture. Semi-intensive and
intensive shrimp producers may incur additional
costs of water pumping to maintain water and
salinity levels. Since the industry is both capitalintensive and growing rapidly, adaptation is likely
to be autonomous with the costs borne by operators. The total cost of adaptation is estimated at an
average of $130 million per year from 2010–50,
which is equivalent to 2.4 percent of total costs.
Forestry. The impact of climate change on forests is likely to be complex and long term. For
natural forests, the analysis suggests that there
will be a substantial reduction in the area of land
xvii
that is suitable for humid semi-deciduous forest,
which would be replaced by other forest types.
Mangrove forests will be affected by sea level rise
unless they are able to migrate inland. The area
of land under plantation forests with short rotations has increased rapidly over the past 20 years.
A forestry growth model suggests that climate
change will increase the variability of plantation
yields across the country without having a major
impact on the average yield. Thus, an important
adaptation need will be to ensure the best match
between soil, climate, and management practices
to obtain the highest yields from plantations.
A range of adaptation options was considered.
The key measures identified were (a) changes in
land use planning to facilitate the migration of
mangroves; (b) adoption of plantation species and
methods of silviculture that are more resilient to
droughts; (c) improvements in pest management,
including genetic selection and integrated pest
control strategies; and (d) use of herbicides or biological controls to limit the effect of exotic weed
species on tree growth. The financial costs of
adaptation are likely to be modest, but the institutional issues may be more difficult to deal with.
Coastal ports. Along its 3,200 km coastline,
Vietnam has a total of 116 ports. In addition,
new terminals are being constructed and planned
all along the coastline, particularly in the south
around Ho Chi Minh City and in the north
around Hai Phong. Given the nature of its location, this infrastructure is at risk from sea-level rise
and storm surges. Impacts include accelerated
depreciation of structures and flooding of port
facilities such as warehouses.
Adaptation options examined in the study include
(a) raising quay walls, (b) improving surface drainage to reduce flooding, and (c) increased expenditure on the maintenance and replacement of port
infrastructure. The cost of adaptation for all ports
would be less than $500 million, or about $12 million per year without discounting at 2005 prices.
xviii
E C O N O M I C S O F A D A P TAT I O N T O C L I M AT E C H A N G E
Social Analysis
Up to now government policies have focused on
sector-wide assessments for the whole country
and on “hard” adaptation measures—such as
sea dikes, reinforced infrastructure, and durable
buildings. Little attention has been paid to “soft”
adaptation measures like increasing institutional
capacity or the role of collective action and social
capital in building resilience. Most adaptation
options identified at the field sites and during participatory scenario development workshops were
aimed at improving response capacity and disaster risk reduction—such as forecasting, weather
monitoring—and managing climate risk. Notably, adaptation options that reduce poverty and
increase household resilience or that integrate
climate change into development planning were
not emphasized.
Overall, many of the adaptation options observed
at the field sites and/or proposed in workshops
were highly cost-effective and do not require
large expenditures. Moreover, they were largely
in line with the adaptation options considered
for the climate scenarios in the sector analyses.
These adaptation measures included shifting
planting dates, adopting drought-tolerant crops,
and switching to salinity-tolerant varieties of rice.
The diversity of preferred adaptation responses
reflected the impressive variety of Vietnam’s vulnerability zones and confirm the need for a mix
of both autonomous and planned adaptation, a
mix of hard and soft options, and adaptation to
be carried out at the national, subnational, and
community levels.
Lessons and
Recommendations
Climate change will have a significant impact on
some regions and sectors of Vietnam’s rural economy. Still, in macroeconomic terms the impacts
of climate change on agriculture and related sectors, even with no adaptation, appear to be relatively modest. In practice, there will be substantial
autonomous adaptation even without active government intervention, since farmers will change
the crops and crop varieties that they grow and
their methods of farming.
The major concern is the extent to which climate change will hit poor households, partly
because of the decline in agricultural incomes
and partly because of an increase in food prices
relative to the general cost of living. The lowest 20 percent of households—either urban or
rural—arranged by household expenditure per
person will experience larger reductions in real
standards of living due to climate change than
the top 20 percent of households.
Thus, the primary focus of policies to adapt to
climate change for the sectors covered under the
EACC studies, should be to protect the poor, the
vulnerable, and those least able to respond to
changing climatic stresses. The goal should be
to provide farmers and others with the tools and
resources that will enable them to respond to climate change itself and to the new risks that will
accompany climate change. The key elements
will be: