ADBI Working Paper Series
The Effect of Exchange Rate
Changes on Trade in East Asia
Willem Thorbecke
No. 263
January 2011
Asian Development Bank Institute
The author is a senior research fellow at ADBI in Tokyo. He thanks Ramkishen Rajan for
valuable comments and Atsuyuki Kato for excellent research assistance. Any errors are
the author’s responsibility.
The views expressed in this paper are the views of the authors and do not necessarily
reflect the views or policies of ADBI, the Asian Development Bank (ADB), its Board of
Directors, or the governments they represent. ADBI does not guarantee the accuracy of
the data included in this paper and accepts no responsibility for any consequences of
their use. Terminology used may not necessarily be consistent with ADB official terms.
The Working Paper series is a continuation of the formerly named Discussion Paper series;
the numbering of the papers continued without interruption or change. ADBI’s working
papers reflect initial ideas on a topic and are posted online for discussion. ADBI encourages
readers to post their comments on the main page for each working paper (given in the
citation below). Some working papers may develop into other forms of publication.
Suggested citation:
Thorbecke, W. 2011. The Effect of Exchange Rate Changes on Trade in East Asia. ADBI
Working Paper 263. Tokyo: Asian Development Bank Institute. Available:
http://www.adbi.org/workingpaper/2011/01/21/4339.effect.exchange.rate.changes.trade.east.asia/
Please contact the author(s) for information about this paper.
[email protected]
Asian Development Bank Institute
Kasumigaseki Building 8F
3-2-5 Kasumigaseki, Chiyoda-ku
Tokyo 100-6008, Japan
Tel:
Fax:
URL:
E-mail:
+81-3-3593-5500
+81-3-3593-5571
www.adbi.org
[email protected]
© 2011 Asian Development Bank Institute
ADBI Working Paper 263
Thorbecke
Abstract
This paper considers how exchange rates affect East Asian trade. The evidence indicates
that exports produced within regional production networks depend on exchange rates
throughout the region while labor-intensive exports depend on exchange rates in the
exporting country. These results make sense since the majority of the value-added of
processed exports come from imported parts and components while most of the valueadded of labor-intensive exports comes from the domestic economy. Recent findings also
indicate that imbalances between the People’s Republic of China (PRC) and the United
States are a major outlier and that an appreciation of the PRC yuan (CNY) is necessary to
reduce these imbalances.
JEL Classification: F32, F41
1
ADBI Working Paper 263
Thorbecke
Contents
1.
Introduction ................................................................................................................ 1
2.
East Asian Production Networks and Exchange Rate Changes ................................. 1
2.1
2.2
2.3
East Asian Production Networks ....................................................................... 2
The Impact of Exchange Rate Changes on Processing Trade .......................... 4
Impact of Exchange Rate Volatility.................................................................... 6
3.
Labor-Intensive Exports from East Asia ..................................................................... 6
4.
Exchange Rates and Trans-Pacific Rebalancing ..................................................... 11
5.
Conclusion ............................................................................................................... 14
References ......................................................................................................................... 16
ADBI Working Paper 263
Thorbecke
1. INTRODUCTION
East Asia’s share of the world’s goods exports nearly doubled between 1982 and 2008,
increasing from 13% to 23%. The share of People’s Republic of China (PRC) alone
increased 10 times, from less than 1% to 9.4% during this period. Despite this explosion of
exports, there were (until recently) only a few studies that investigated trade elasticities for
the PRC (for instance, see International Monetary Fund [IMF] 2005). Since 2005, however,
several papers have investigated the factors influencing trade in the PRC and the rest of
Asia. The evidence indicates that exchange rate changes, by altering countries’ international
price competitiveness, significantly affect their exports and imports.
This paper summarizes some of these recent findings. Rather than attempting to make an
incremental contribution to this literature, it steps back and looks at the big picture by
enumerating some of the key lessons that have emerged from the existing studies.
The evidence indicates that exchange rate effects differ between sophisticated products
such as laptop computers and mobile phones produced within regional production networks
and simple labor-intensive goods such as textiles and footwear produced primarily by
domestic factors of production. In the first case, exchange rates appreciations throughout the
region would cause a larger decrease in exports than appreciations in final assembly
countries such as the PRC or Thailand alone. In the second case, appreciations in the
exporting country would cause a large decrease in exports. These results make sense since
the majority of the value-added of sophisticated processed exports comes from outside of
the assembly country while the lion’s share of the value-added of labor-intensive exports
comes from the exporting country itself.
The findings presented here also highlight the unusual nature of trade imbalances between
the United States (US) and the PRC. Before the crisis, the US ran large trade deficits with
East Asia, oil-producing countries, and the rest of the world. Since October 2008, however,
the US deficit with most regions has fallen but its deficit with the PRC has remained
intransigent. Evidence from a gravity model indicates that imbalances between the PRC and
the US are a major outlier in the global economy. Results from dynamic ordinary least
squares (DOLS) estimation indicate that, to reduce these imbalances, an appreciation of the
yuan against the dollar is probably necessary.
This paper is organized as follows. The next section considers how exchange rates affect
trade within East Asian production networks. Section 3 considers the effect of exchange rate
changes on labor-intensive exports from developing and emerging Asia. Section 4
addresses issues related to trans-Pacific rebalancing. Section 5 concludes.
2. EAST ASIAN PRODUCTION NETWORKS AND
EXCHANGE RATE CHANGES
In Asia, production networks developed in response to the 70% appreciation of the
Japanese yen against the dollar between 1985 and 1995. Japanese firms lost their price
competitiveness, and responded by shifting labor-intensive assembly operations to other
Asian countries. At first they channeled foreign direct investment (FDI) and intermediate
goods to the Republic of Korea (hereafter Korea), Taipei,China, and other newly
industrialized economies (NIEs). However, as the Korean won, Singapore dollar, and NT
dollar appreciated, they relocated lower-end labor-intensive assembly to the PRC and the
Association of South East Asian Nations (ASEAN). Firms in the Asian NIEs also began
transferring factories to developing Asia, mainly ASEAN (Malaysia, Indonesia, and Thailand
primarily) and the PRC. Consequently, “triangular trading patterns” developed in East Asia
(see Gaulier, Lemoine, and Unal-Kesenci 2005). Higher skilled workers in Japan, Korea, and
Taipei,China produced sophisticated technology-intensive parts and components and
1
ADBI Working Paper 263
Thorbecke
shipped them to the PRC and ASEAN for assembly by lower skilled workers and re-exported
to the rest of the world.
2.1
East Asian Production Networks
The resulting cross border production networks involve complicated combinations of intrafirm trade, arms-length transactions, and outsourcing (Kimura and Ando 2005). They are
typically centered around multinational corporations (MNCs) in developed Asia that produce
with the help of affiliates, subsidiaries, subcontractors, suppliers, and service providers in
other parts of East Asia (see Borrus, Ernst, and Haggard 2000). These networks have
allowed MNCs to exploit comparative advantage by slicing up long production processes
and allocating the production blocks created in this way throughout Asia. As Fukao et al.
(2002) discussed, the production processes of an industry (e.g., the electronics industry)
have been split into fragmented production blocks that can be located in different countries
based on differences in factor endowments in the fragmented production blocks between
developing, emerging, and developed economies in the region.
Parts and components often flow back and forth several times between the countries for
processing. The final assembly typically takes place by lower skilled workers in ASEAN and
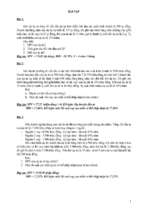
the PRC. In recent years, final assembly has become increasingly centered in the PRC. This
is seen in Figure 1, which presents final electronic goods exports from East Asian countries.
The figure shows that more and more processed exports have come from the PRC
especially post 2000.
Figure 1: Final Electronics Exports from East Asian Countries and Regions to the
World
450,000
Millions of US Dollars
400,000
350,000
300,000
Japan
PRC
ASEAN 4
NIEs
250,000
200,000
150,000
100,000
2006
2007
2008
1999
2000
2001
2002
2003
2004
2005
1993
1994
1995
1996
1997
1998
0
1990
1991
1992
50,000
Source: CEPII-CHELEM Database.
Table 1 sheds further light on the PRC’s processing trade. Imports for processing refer to the
parts and components such as hard disk drives that are imported into the PRC duty free and
intended solely to produce goods for re-exports. Processed exports refer to final goods such
as computers that are produced in this way. The table indicates that two-thirds of the imports
for processing come from East Asia, while the US and Europe account for only 5% each. For
processed exports, about 20% goes to East Asia, the US, Europe, and Hong Kong, China.
Imports for processing come largely from East Asia while processed exports go throughout
the world, so the PRC runs deficits of about US$100 billion with East Asia and surpluses of
almost US$100 billion with Europe and of more than US$100 billion with the US and Hong
Kong, China.
2
ADBI Working Paper 263
Thorbecke
Table 1: The PRC’s Processing Trade, 2006–2009
Korea
Taipei,China ASEAN4
Japan
Hong
Singapore Kong,
China
US
Europe
R.O.W
Total
Imports for Processing (%)
2006
15.08
19.04
10.51
15.89
2.63
2.11
5.23
4.99
24.52
100.00
2007
15.24
18.75
10.65
16.11
2.40
1.98
4.93
5.03
24.91
100.00
2008
15.63
18.07
2009
16.95
16.96
Processed Exports (%)
2006
3.95
2.19
10.26
16.20
2.28
1.62
5.20
5.72
25.01
100.00
9.73
15.53
2.18
1.32
4.80
5.51
27.03
100.00
3.21
10.35
2.96
22.34
25.23
17.85
11.90
100.00
2007
3.98
1.92
3.25
9.35
2.84
22.42
23.54
18.59
14.10
100.00
2008
4.75
1.88
3.27
9.22
2.79
21.01
22.20
18.71
16.16
100.00
2009
4.96
1.86
3.40
9.13
Balance in processing trade (billions of US dollars)
2006
-28.29
-50.01
-17.40
1.76
3.36
20.57
22.68
17.50
16.54
100.00
6.65
107.24
111.98
75.06
-18.12
188.87
2007
-31.57
-57.18
-19.18
-1.63
8.73
131.18
127.25
96.29
-4.65
249.24
2008
-27.07
-55.71
-16.72
0.99
10.19
135.76
130.20
104.67
14.46
296.77
-25.50
-43.72
-11.41
3.56
12.72
116.46
117.61
84.93
9.92
264.57
2009
Notes: ASEAN4 includes Indonesia, Malaysia, Philippines, and Thailand. Europe includes Austria, Belgium, Denmark, Finland, France, Germany, Greece, Ireland, Luxembourg,
Netherlands, Italy, Portugal, Spain, Sweden and United Kingdom.
Source: China Customs Statistics.
3
ADBI Working Paper 263
2.2
Thorbecke
The Impact of Exchange Rate Changes on Processing Trade
Since much of the value added comes from other East Asian countries, one would expect
that exchange rate changes in other countries in the region would affect the PRC’s
processed exports. Ahmed (2009) and Thorbecke and Smith (2010) and Thorbecke (2010a)
have presented evidence supporting this. We outline the main findings of each below.
Ahmed (2009) employed an autoregressive distributed lag model and quarterly data over the
1996Q1 – 2009Q2 period and disaggregated PRC yuan (CNY) exchange rate changes into
those relative to East Asian countries and those relative to other countries. After 2003, he
deflated PRC exports using the US Bureau of Labor Statistics (BLS) deflator for imports
coming from the PRC and before 2003 he backcasted this series using the BLS deflator for
imports coming from non-industrial countries. He reported that a 10% appreciation of the
CNY relative to non-East Asian countries would reduce the PRC’s processed exports by
17% and that a 10% appreciation in other East Asian countries would reduce the PRC’s
processed exports by 15%.
Thorbecke (2010a) also tested whether exchange rate changes in the supply chain countries
affect processed exports. Exports were measured in US dollars and deflated using the US
producer price index, the US consumer price index, and the Hong Kong, China export price
deflator. Since many of Hong Kong, China’s exports are re-exports from the PRC, this last
measure may be a useful proxy for PRC export prices. Encompassing tests indicated in
every case that models including both exchange rates in supply chain countries and the
PRC exchange rate are preferable to models including only the PRC exchange rate. Results
using dynamic ordinary least squares estimation and quarterly data over the 1993Q42008Q1 period indicated that a 10% appreciation of the CNY alone would reduce processed
exports by 14% and a 10% appreciation of other East Asian currencies would reduce
processed exports by 19%. These results imply that exchange rate changes in other East
Asian countries have a large effect on the PRC’s processed exports.
Thorbecke and Smith (2010) constructed a single integrated exchange rate variable to
measure changes in the relative foreign currency costs not just of the PRC’s value-added
but of the PRC’s entire output of processed exports. Exports were deflated using the BLS
deflator for imports coming from non-industrial countries, the US consumer price index, and
the Hong Kong, China export price deflator. Using DOLS estimation and an annual panel
data set including exports to 33 countries over the 1992–2005 period, they reported that a
10% appreciation throughout the region would reduce processed exports by 10%.
The results of Ahmed (2009), Thorbecke (2010a), and Thorbecke and Smith (2010) thus
indicate that exchange rates throughout Asian supply chain countries exert important effects
on processed exports. 1 One gets a different picture of the price competitiveness of the
PRC's processed exports by taking account of exchange rate changes in other East Asian
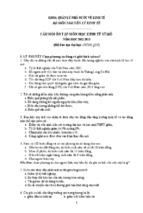
countries. Figure 2 shows the real effective exchange rate (REER) of the CNY, the real
exchange rate in supply chain countries other than the PRC, and a single integrated
exchange rate (IRER) that is a weighted average of the CNY exchange rate and the
exchange rate in supply chain countries. The real exchange rate in supply chain countries
was calculated by weighing real exchange rate changes in individual supply chain countries
by each country’s value-added in the PRC's processed exports. The weights for the IRER
were also determined by the proportion of the value-added coming from the PRC and from
1
Exchange rate changes can only generate expenditure-switching effects if there is sufficient pass- through of
exchange rate changes to tradable prices. The IMF (2005) estimates that a 10% appreciation of the yuan raises
the foreign currency prices of China’s exports by 5%. Vigfusson, Sheets, and Gagnon (2007) found that 10%
currency appreciations would raise the foreign currency prices of the Asian NIEs’ exports by 7% and of Japan’s
exports by 5%. Thus there should be sufficient exchange rate pass-through for exchange rate appreciations in
Asia to reduce exports.
4
ADBI Working Paper 263
Thorbecke
supply chain countries. Figure 2 shows that the CNY appreciated by 20% between 2005 and
2010. The IRER, however, appreciated only by 8% over this period. In an arithmetic sense,
the effect of the CNY appreciation on the IRER since 2005 has been almost exactly offset by
the 20% depreciation of the Korean won and the 14% depreciation of the NT dollar over this
period.
Figure 2: PRC's Real Effective Exchange Rate, Weighted Exchange Rate for Supply
Chain Countries, and Integrated REER for the PRC's Proceeded Exports
Log Real Exchange Rate
4.9
Yuan Real Effective Exchange Rate
4.8
4.7
Integrated Exchange Rate
(PRC and Supply Chain Countries)
4.6
4.5
4.4
Real Exchange Rate in
Supply Chain Countries
4.3
20
04
Q
1
20
04
Q
3
20
05
Q
1
20
05
Q
3
20
06
Q
1
20
06
Q
3
20
07
Q
1
20
07
Q
3
20
08
Q
1
20
08
Q
3
20
09
Q
1
20
09
Q
3
20
10
Q
1
20
10
Q
3
4.2
Source: International Monetary Fund, Bank for International Settlements, and calculations by the author.
This fact helps explain the puzzle that Cline (2010) discusses concerning why the PRC's
bilateral trade surplus with the US did not narrow when the CNY appreciated between 2005
and 2008. Part of the explanation, as Cline discussed, is that exchange rate changes affect
trade with a lag. Another part of the explanation, though, is that depreciations in other East
Asian supply chain countries offset much of the effect of the appreciation of the CNY.
The IMF (2005) argued that imports for processing should vary one-for-one with processed
exports. Imports for processing should thus flow elastically into assembly economies in
response to an increase in the demand for processed exports in the rest of the world. IMF
(2005) also noted that the price elasticity of imports for processing should be small because
these goods are not produced domestically, resulting in little potential for import
substitution. 2
In previous work Cheung, Chinn, and Fujii (2010), Marquez and Schindler (2007), and
Garcia-Herrero and Koivu (2007) reported that an appreciation of the CNY is often
associated with a decrease in imports from the rest of the world (i.e., the coefficient is wrongsigned). The wrong sign could occur because an exchange rate appreciation will reduce the
demand for processed exports and thus the demand for imports for processing.
2
However, the huge surpluses in processing trade that have emerged since 2005 suggest that firms in recent
years have been able to source more intermediate goods from within the PRC. Thus the demand for imports for
processing may have become more price elastic in recent years.
5
ADBI Working Paper 263
2.3
Thorbecke
Impact of Exchange Rate Volatility
While there is no evidence that an appreciation in the importing country would substantially
increase imports for processing, there is both theoretical and empirical evidence indicating
that exchange rate volatility between supply chain countries would deter processing trade.
This effect arises because the service link cost for production blocks separated by national
borders is an increasing function of risk and uncertainty, and exchange rate volatility
increases risk and uncertainty.
In a recent survey of Japanese MNCs, Ito et al. (2008) found that exchange rate stability
between Asian currencies is essential for the uninterrupted flow of parts and components
within regional production networks.
Both Thorbecke (2008) and Hayakawa and Kimura (2009) presented econometric evidence
that exchange rate volatility reduces the flow of parts and components within regional trade
networks. Thorbecke (2008), using DOLS estimation and annual data over the 1985–2005
period reported that exchange rate volatility caused a large decline in the flow of parts and
components within East Asian production networks. Hayakawa and Kimura (2009), using a
gravity equation and annual data over the 1992–2005 period, found that exchange rate
volatility significantly reduced trade in intermediate goods within East Asian production
networks.
Carlos Ghosn, chief executive officer of Nissan Motor Corporation, recently commented that
exchange rate volatility was harmful to fragmented production networks because it militated
against long-term planning (see Crooks 2010). As a result, Nissan planned to shift
production from Japan to dollar-linked economies such as the PRC to avoid mismatches
between currencies in which costs are incurred and currencies in which revenues are
generated.
Interestingly, exchange rate volatility may not be as harmful to production networks centered
on the US. Turkcan and Keskinel (2009) examined the impact of exchange rate volatility on
fragmentation in the US auto parts industry. Using DOLS estimation over the 1996–2008
period, they reported that exchange rate volatility has a positive but insignificant effect on US
auto industry exports. Future research should investigate whether exchange rate volatility
has different effects on production networks centered in East Asia and those centered in the
US.
3. LABOR-INTENSIVE EXPORTS FROM EAST ASIA
While East Asian economies export large volumes of sophisticated processed exports, they
also exported almost US$400 billion in labor-intensive manufacturing exports in 2008. These
goods tend to be produced largely with domestic inputs, and much of the value-added is
supplied domestically. For instance, Koopman, Wang, and Wei (2008) reported that the
PRC’s value-added in electronic computers was less than 5% in 2002, while its value-added
in wearing apparel was almost 70%.
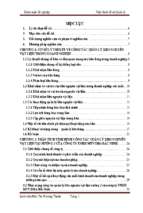
Figure 3 shows exports of labor-intensive manufacturing goods from East Asian countries
and regions to the world. Labor-intensive exports are defined to include carpets, clothing,
fabrics, furniture, knitwear, leather, and yarns. The main exporters of these goods are the
labor-abundant developing and emerging economies such as the PRC, Indonesia, and Viet
Nam. Exports from capital-abundant developed economies such as Japan are miniscule, as
one would expect. One would expect significant competition between Asian countries in
exporting labor-intensive goods to third markets. Profit margins for these goods are thin (see
Ito et al. 2008), and exporters will face pressure to pass through exchange rate changes into
import prices.
6
ADBI Working Paper 263
Thorbecke
Figure 3a: Value of Labor-Intensive Manufacturing Exports from East Asian Countries
and Regions to the World
300
Billions of US Dollars
250
PRC
200
150
100
50
ASEAN- 6
NIEs
Japan
19
80
19
82
19
84
19
86
19
88
19
90
19
92
19
94
19
96
19
98
20
00
20
02
20
04
20
06
20
08
0
Figure 3b. Value of Labor-Insentive Manufacturing Exports from ASEAN Countries to
the World
25
Viet Nam
Billions of US Dollars
20
15
Indonesia
10
Thailand
Malaysia
5
Philippines
Singapore
19
80
19
82
19
84
19
86
19
88
19
90
19
92
19
94
19
96
19
98
20
00
20
02
20
04
20
06
20
08
0
Source: CEPII-CHELEM Database.
7
ADBI Working Paper 263
Thorbecke
Thorbecke and Zhang (2009) and Thorbecke (2010b) found labor-intensive exports from the
PRC and ASEAN countries to be very sensitive to both exchange rates in the exporting
country and to exchange rates in other countries exporting labor intensive exports to third
markets. In both cases, exports were measured in dollars and deflated using BLS price
deflators for the categories of labor-intensive exports employed. Using DOLS estimation and
an annual panel data set including exports to 30 countries over the 1987–2006 period,
Thorbecke and Zhang (2009) reported that for the PRC a 10% appreciation of the CNY
would reduce labor-intensive exports by about 17% and a 10% depreciation among
competing countries will decrease exports by about 9%. Using DOLS estimation and an
annual panel data set including exports to 25 countries over the 1983–2007 period,
Thorbecke (2010b) found that for ASEAN countries, a 10% appreciation in the exporting
country would reduce that country’s labor-intensive exports by about 20% and a 10%
depreciation among competing countries would decrease the ASEAN country’s exports by
about 12%. These results support the claim that profit margins for these goods are thin, and
that there is extensive competition between labor-abundant countries in exporting to third
markets.
Figure 3 shows that the PRC is the largest exporter of labor-intensive goods. There is a
close correspondence between labor-intensive exports and the PRC customs regime called
“ordinary” exports. As Gaulier, Lemoine, and Unal-Kesenci (2005) discussed, ordinary
exports are produced primarily using local PRC inputs. Since the PRC is a labor-abundant
country, ordinary exports are largely labor-intensive goods. Feenstra and Wei (2010) report
that the largest category of ordinary exports is textiles.
Table 2 disaggregates the PRC’s ordinary trade by country and region. About 25 of ordinary
imports come from East Asia, about 15 from Europe, less than 10 from the US, and more
than 40 from the rest of the world. Many of the ordinary imports coming from the rest of the
world in recent years have been commodities. The largest recipient of the PRC’s ordinary
exports have been the US and Europe. The PRC runs surpluses with the US and Europe in
ordinary trade and deficits with Asia. With the world as a whole, it ran a slight deficit overall
in ordinary trade in 2009.
8
ADBI Working Paper 263
Thorbecke
Table 2: The PRC’s Ordinary Trade, 2006–2009
2006
2007
2008
2009
Hong
Singapore Kong,
China
Ordinary Imports (%)
Korea
Taipei,China ASEAN4
Japan
8.03
7.05
6.15
6.47
4.55
4.26
3.51
3.73
12.66
11.77
10.88
11.75
6.01
6.43
5.46
6.22
1.52
1.24
1.33
1.21
US
Europe
R.O.W
Total
0.93
1.06
1.00
0.69
8.50
8.41
8.21
9.39
15.79
15.78
13.95
15.95
42.02
44.01
49.49
44.58
100.00
100.00
100.00
100.00
7.71
6.40
5.17
6.04
16.60
14.90
14.13
14.84
17.91
18.70
19.15
18.77
34.46
37.72
38.77
38.92
100.00
100.00
100.00
100.00
40.81
44.19
46.60
28.46
21.94
33.05
47.00
14.24
3.46
14.47
-26.55
-32.04
83.14
109.87
89.91
-4.59
Ordinary Exports (%)
2006
2007
2008
2009
5.47
5.48
5.95
4.24
2.11
1.90
1.77
1.55
5.09
5.19
5.72
6.19
8.98
7.76
7.57
7.80
1.67
1.97
1.75
1.64
Balance in normal trade (billions of US dollars)
2006
2007
2008
2009
-3.96
-0.69
4.18
-12.11
-6.37
-8.04
-8.37
-11.74
1.15
0.36
6.64
-0.47
-4.76
-8.65
-12.11
-21.44
1.89
5.29
3.97
2.20
28.97
29.89
28.55
28.30
Notes: ASEAN4 includes Indonesia, Malaysia, Philippines, and Thailand. Europe includes Austria, Belgium, Denmark, Finland, France, Germany, Greece, Ireland, Luxembourg,
Netherlands, Italy, Portugal, Spain, Sweden and United Kingdom.
Source: China Customs Statistics.
9
ADBI Working Paper 263
Thorbecke
Many have found that ordinary exports are sensitive to appreciations in the CNY. Marquez
and Schindler (2007), for instance, used ordinary least squares and monthly data over the
January 1997 to July 2006 sample period. To avoid using proxies for PRC trade prices, they
employed the share of the PRC’s imports relative to world imports as their left hand side
variable. They also employed the International Monetary Fund, Bank for International
Settlements, and Federal Reserve Board measures of the REER. They found that,
depending on the exchange rate measure, a 10% appreciation of the CNY would have
reduced the PRC’s ordinary exports by between US$51 and 63 billion in 2006.
Ahmed (2009) employed an autoregressive distributed lag model and quarterly data over the
1996Q1 – 2009Q2 period. He deflated PRC exports by using the US Bureau of Labor
Statistics (BLS) deflator for imports coming from the PRC after 2003 and by backcasting this
series before 2003 using the BLS deflator for imports coming from non-industrial countries.
In one of his preferred specifications, he included foreign consumption as an explanatory
variable. In this case, he reported that a 10% appreciation of the CNY would reduce the
PRC’s ordinary exports by 19%.
Cheung, Chinn, and Fujii (2010) employed DOLS techniques and quarterly data over the
1993Q3 – 2004Q2. They deflated PRC exports using the US producer price index (PPI) for
finished goods, the price indices constructed by Gaulier, Lemoine, and Unal-Kesenci (2006,
hereafter GLÜ-K), and the Hong Kong, China unit value index. They reported that a 10%
appreciation of the CNY would reduce the PRC’s ordinary exports by between 3% and 6%.
Thorbecke and Smith (2010) also employed DOLS estimation and an annual panel data set
including exports to 33 countries over the 1992–2005 period. They deflated exports using
the BLS deflator for imports coming from non-industrial countries, the US consumer price
index, and the Hong Kong, China export price deflator. They found that a 10% appreciation
of the CNY would reduce ordinary exports by about 12%.
While the results indicate that an appreciation of the CNY should reduce ordinary exports,
the results are ambiguous for ordinary imports. Cheung, Chinn, and Fujii (2010) deflated
PRC imports using the US PPI, the GLÜ-K index, and the Hong Kong, China unit value
index. Employing DOLS and quarterly data over the 1993Q3 – 2004Q2, they reported that
an appreciation of the CNY was associated with a decline in ordinary imports (i.e., the
coefficient had the wrong sign). Marquez and Schindler (2007) examined the share of the
PRC’s imports relative to rest of the world imports. They found that a 10% appreciation of
the CNY caused ordinary imports to increase by about US$15 billion. These conflicting
results could arise because some ordinary imports are used to produce goods for re-exports.
An exchange rate appreciation that reduces the PRC’s exports will reduce the demand for
these imported inputs.
To correct for this bias, Thorbecke (2009, 2010c) examined the imports of final consumption
goods into East Asian countries. These goods are intended primarily for the domestic market
rather than for re-export. Data on consumption goods imports were measured in US dollars
and deflated using the BLS price indices for consumption goods. Using DOLS techniques
and quarterly data on consumption goods imports from 27 countries over the 1985–2006
period, Thorbecke (2009) found that a 10% appreciation of the CNY would increase the
PRC’s consumption imports by about 13%. In follow up work focusing only on countries that
provided at least one of consumption imports into individual East Asian countries, Thorbecke
(2010c) reported exchange rate appreciations in other East Asian countries also raised
consumption imports. 3 Thus an appreciation of the currency that raises consumers’
purchasing power should increase the demand for consumption imports.
3
Using this new specification, there is no longer evidence that an appreciation of the CNY will increase the
PRC’s consumption imports. One reason why the PRC’s exchange rate elasticity may no longer be statistically
significant is that only 11 countries are included in the sample of countries exporting to the PRC. These include
the US and several Asian countries whose currencies were closely linked with the dollar for many years. Since
10
ADBI Working Paper 263
Thorbecke
4. EXCHANGE RATES AND TRANS-PACIFIC
REBALANCING 4
Before the crisis, the US ran large trade deficits with East Asia, oil-producing countries, and
the rest of the world. Since October 2008, however, the US deficit with most regions has
fallen but its deficit with the PRC has remained intransigent. This fact is documented in
Table 3. The table shows exports, imports, and the trade balance between the US and the
rest of the world before and after the Lehman Brothers fall in September 2008. Exports and
imports both exhibited sharp drops beginning in October 2008. The sample is thus divided
into the year before the crisis (October 2007–September 2008), the first year after the
Lehman shock (October 2008–September 2009), and the second year after the Lehman
shock (October 2009–September 2010). For non-East Asian countries, the deficit fell by 76%
during the post-crisis period and equaled US$227 billion between October 2008 and
September 2009. For the PRC, it fell by less than 12% and equaled US$237 billion between
the fourth quarter of 2008 and the third quarter of 2009. Columns (7) through (9) indicate that
this pattern is continuing, with the PRC making up 44% of the US deficit during the first year
after the Lehman shock and 42% during the second year after Lehman.
the CNY was pegged to the dollar for most of the sample period, there might not have been enough exchange
rate variation in the data to give the tests sufficient discriminatory power.
4
This section draws on Thorbecke (2010d).
11
ADBI Working Paper 263
Thorbecke
Table 3: Exports, Imports, and Trade Balance between the US and other Countries and Regions before and after the Lehman Brothers
Shock, (Billions of US dollars)
Country
or
Region
Year before the Lehman Brothers
Shock
(1)
(2)
(3)
Exports
Imports
Bilateral
to the US from
trade
balance with
the US
the US
First Year
Shock
(4)
Exports
to the US
after the Lehman Brothers
(5)
Imports
from
the US
(6)
Bilateral
trade
balance with
the US
Second Year after
Brothers Shock
(7)
(8)
Exports
Imports
to the US from
the US
the Lehman
(9)
Bilateral
trade
balance with
the US
People’s
337
Republic
of China
Rest
of 233
East Asia
71
266
300
63
237
348
86
262
130
102
168
96
72
195
120
75
Rest
of 1,581
the World
(excluding
East Asia)
World
2,150
1,097
484
1,126
899
227
1,300
1,018
281
1,298
852
1,594
1,059
535
1,843
1,224
618
Notes: The year before the Lehman Brothers shock is from October 2007 to September 2008. The first year after the Lehman Brothers shock is from October 2008 to September 2009.
The second year after the Lehman Brothers shock is from October 2009 to September 2010. Rest of East Asia includes Japan, the Republic of Korea, and Taipei,China.
Sources: US Census Bureau (Available at: http://www.census.gov/)
12
ADBI Working Paper 263
Thorbecke
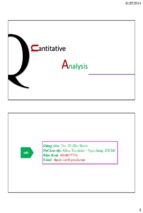
Thorbecke and Komoto (2010) highlighted the unusual nature of the PRC’s exports to the
US. They estimated a gravity model that sought to explain trade between 30 countries over
the 1988–2007 period using income in the exporting and importing countries, the real
exchange rate, distance, a common language dummy, importer and exporter fixed effects,
dummy variables for Mexico and Canada, and a time trend. Exports were measured in
dollars and deflated using the consumer price index. They found that the PRC exports to the
world and the US imports from the world in 2007 were both much more than the model
predicted. They also found that in the PRC’s case the main outlier was exports to the US
and in the case of the US, the main outlier was imports from the PRC. The PRC’s exports to
the US in 2007 were US$200 billion more than the model predicted. These results are
presented in Figure 4.
Figure 4a: The PRC's Predicted and Actual Exports, 2007
350
300
U.S
Actual exports (US$ billion)
250
200
150
JPN
100
MEX NLD
GER
UK
AUTPOL
AUS FRA
IND
ITA
SWE
MYS
THA SGP
SWZ
FIN
IDN
0KSA
NOR
DNK IRE PHL
CAN
50BRZESP
TUR
0
KOR
TAI
50
10
150
200
250
300
350
Predicted exports (US$ billion)
Figure 4b: US Predicted and Actual Imports, 2007
400
350
Actual imports (US$ billion)
300
CAN
PRC
250
MEX
200
150
JPN
100
GER
50
KSAMYS
KOR
TAI ITA FRA
NLD
THA IND
IR BRZ SWZ
ESP
SWE
AUTDNKSGP
0 TURNO PHL IDNFINAUS
POL
0
50
UK
100
150
200
250
300
350
400
Predicted imports (US$ billion)
Notes: Predicted exports or imports represent the sum of predicted exports or predicted imports from 31 countries based on a
gravity model. The gravity model includes income in the exporting and importing countries, the real exchange rate, distance, a
common language dummy, importer and exporter fixed effects, dummy variables for Mexico and Canada, and a time trend as
explanatory variables. AUS=Australia, AUT=Austria, BRZ=Brazil, CAN=Canada, DNK= Denmark, ESP= Spain, FRA=France,
FIN=Finland, GER=Germany, IDN=Indonesia, IND=India, IRL=Ireland, ITA=Italy, JPN= Japan, KOR=Korea, KSA=Saudi
Arabia, MEX=Mexico, MYS=Malaysia, NLD= Netherlands, NOR=Norway, PHL=Philippines, POL=Poland, PRC= People’s
Republic of China, SGP= Singapore, SWE=Sweden, SWZ= Switzerland, TAI=Taipei,China, THA=Thailand, TUR=Turkey,
UK=United Kingdom, US= United States
Source: Thorbecke and Komoto (2010).
13
ADBI Working Paper 263
Thorbecke
The massive imbalances between the PRC and the US have been financed by the
accumulation of US Treasury securities (external reserves) by the People’s Bank of China
(PBoC). Many argue that continued foreign reserve accumulation by the PBoC is
unsustainable because it produces an increasingly inefficient allocation of resources. Both
private and social rates of return are much higher for investments in the PRC economy than
for investments in US securities. For instance, investing in education would pay high
dividends by helping PRC firms to assimilate new technologies and move up the value
chain.
A related issue to the PRC’s foreign reserve accumulation is whether sterilization measures
by the PBoC have worked well. If not, maintaining the current exchange rate arrangement
will prove problematic. Concerning this issue, Ouyang, Rajan, and Willett (2010) conclude
that the PBoC’s sterilization was effective and the PRC played the role of the reserve sink,
like Germany in the Bretton Woods system. On the other hand, Wang (2009) found that the
share of sterilization was only 43% if M2 rather than the monetary base is examined. In
addition, from the results of recursive estimation, both papers agree to the view that the
sterilization has been getting more difficult year by year.
If the PRC were to stop accumulating additional reserves and invest in the domestic
economy, its currency would appreciate. How would this affect trans-Pacific imbalances?
Cheung, Chinn, and Fujii (2010), using DOLS methods and quarterly data over the 1993 to
2006 period, report that a 10% appreciation of the CNY would reduce the PRC’s exports to
the US by between 8% and 20%. Thorbecke (2006), using DOLS and Johansen maximum
likelihood estimation (MLE) and quarterly data over the 1988 to 2005 period, finds that a
10% appreciation of the CNY would reduce the PRC’s exports to the US by between 4% and
14%. An appreciation of the CNY against the US dollar should thus help reduce imbalances
between the two countries.
If the PRC does not let the CNY appreciate and if the imbalances prove unsustainable, how
else would adjustment occur? Cheung, Chinn, and Fujii (2010) and Thorbecke (2006) both
reported that a fall in income in the US would not affect the PRC’s exports. One explanation
for this is the “Walmart effect” discussed by Petri and Plummer (2009). They argued that
since PRC exports are at low price points within product categories, the demand for PRC
imports may increase even as overall demand shrinks. The idea that there is a tenuous
relationship between PRC exports and US income is supported by recent experience. The
CNY remained tightly pegged to the US dollar, and a once-in-a-generation crisis barely
reduced either the PRC’s exports to the US or its trade surplus. A real appreciation of the
CNY is thus probably necessary to reduce imbalances between the PRC and the US.
If a real appreciation cannot be achieved by nominal exchange rate adjustment, it is likely
that it will be achieved by inflation in the PRC and deflation in the US. This would be painful
for both countries.
5. CONCLUSION
This paper has surveyed recent research on the relationship between exchange rates and
trade in Asia. The results indicate that exports produced within regional production networks
depend on exchange rates throughout East Asia. The continuous flow of parts and
components within regional production networks also depends on relative exchange rate
stability in the region. Labor-intensive exports depend on exchange rates in the exporting
country. Finally, imbalances between the PRC and the US are sensitive to changes in the
CNY/US dollar exchange rate.
These results indicate that, while Asian economies cooperate in regional production and
distribution networks, they also compete in the export of labor-intensive manufacturing
goods to third markets. This competition makes individual countries in Asia resistant to
14
ADBI Working Paper 263
Thorbecke
allowing their currencies to appreciate unilaterally relative to the currencies of neighboring
currencies. However, if trans-Pacific imbalances are unsustainable, exchange rates will have
to appreciate eventually.
In this case it would be desirable for East Asian currencies to appreciate in concert against
external currencies while maintaining relative stability vis-à-vis each other. This outcome
would benefit East Asia in several ways. Relative stability in intra-regional exchange rates
would facilitate the flow of parts and components within regional production networks.
Appreciations would allow Asian consumers to import more from the rest of the world and
give Asian firms an incentive to produce for domestic markets. Concerted appreciations
would also help prevent unpleasant outcomes such as beggar-thy-neighbor policies and
excessive reserve accumulation.
How could Asia achieve a concerted appreciation? A crucial first step would be for the PRC
to keep making progress towards its self-proclaimed goal of adopting a regime characterized
by a multiple-currency, basket-based reference rate with a reasonably wide band. In this
case, the huge surpluses generated within East Asian production networks would cause
currencies in the region to appreciate together. Market forces could then allocate these
appreciations across supply chain countries as a function of the size of their surpluses in
processing trade.
15
ADBI Working Paper 263
Thorbecke
REFERENCES
Ahmed, S. 2009. Are Chinese exports sensitive to changes in the exchange rate?
International Finance Discussion Papers No. 987. Federal Reserve Board.
Borrus, J., D. Ernst, and S. Haggard. 2000. International Production Networks in Asia.
London and New York, NY: Routledge.
Cheung, Y., M. Chinn, and E. Fujii. 2010. China’s current account and exchange rate. In
China's Growing Role in World Trade, edited by R. Feenstra and S. J. Wei. Chicago,
IL: University of Chicago Press.
Cline, W. R. 2010. Estimating the impact of the exchange rate on the trade balance and jobs.
Real Time Economic Issues Watch, Peterson Institute for International
Economics, www.piie.com/realtime/?p=1806, 1 November, Washington DC.
Crooks, E. 2010. Nissan to shift output to dollar economies. Financial Times. 21 November.
Feenstra, R., and S. J. Wei. 2010. Introduction. In China's Growing Role in World Trade
edited by R. Feenstra, S.J. Wei, forthcoming. Chicago, IL: University of Chicago
Press.
Fukao, K., H. Ishido, K. Ito and Y. Yoshiike (2002). Vertical intra-industry trade and foreign
direct investment in East Asia. Asian Development Bank Institute Research Paper
No. 51. Tokyo: Asian Development Bank Institute.
Garcia-Herrero, A., and T. Koivu. 2007. Can the PRC trade surplus be reduced through
exchange rate policy? BOFIT Discussion Papers 6. Helsinki: Bank of Finland Institute
for Economies in Transition.
Gaulier, G., F. Lemoine, and D. Unal-Kesenci. 2005. China’s integration in East Asia:
production sharing, FDI, and high-tech trade. CEPII Working Paper No. 2005-09,
Centre D’Etudes Prospectives et D’Information Internationales.
Gaulier, G., F. Lemoine, and D. Unal-Kesenci. 2006. China’s emergence and the
reorganization of trade flows in Asia. CEPII Working Paper No. 2006-05, Centre
D’Etudes Prospectives et D’Information Internationales.
Hayakawa, K., and F. Kimura. 2009. The effect of exchange rate volatility on international
trade in East Asia. Journal of the Japanese and International Economies 23 (4): 395–
406.
IMF. 2005. Asia-Pacific Economic Outlook. Washington DC: IMF.
Ito, T., S. Koibuchi, Y. Sasaki, K. Sato, J. Simizu, K. Hayakawa, and T. Yoshimi. 2008.
Currency invoicing and foreign exchange risk management: A case Study of
Japanese Firms. RIETI Discussion Paper 08-J-009. Tokyo: Research Institute of
Economy, Trade and Industry.
Kimura, F., and M. Ando. 2005. Two-dimensional fragmentation in East Asia: Conceptual
framework and empirics. International Review of Economics and Finance 14(3): 317–
348.
Koopman, R., Z. Wang, and S. Wei. 2008. How much of PRC exports is really made in
China? Assessing domestic value-added when processing trade is pervasive. NBER
Working Paper 14109. Cambridge, MA: National Bureau of Economic Research.
Marquez, J., and J. Schindler. 2007. Exchange rate effects on China’s trade. Review of
International Economics 15(5): 837–853.
16