A Marketer's Guide
to Facebook Metrics
A Marketer’s Guide to Facebook Metrics
Whether you’ve invested big in social or are starting to consider a new strategy for 2014,
one of the key aspects to think about is social media metrics - namely which to value,
how to use them, and most importantly, where to get access to them in the best way.
The first question you may ask is, “why should I be
In the modern age, all marketers are taught to turn
interested in social media metrics?” If you care about
to data to find the answers and to look for areas
increasing your brand awareness, your online sales and
of improvement for their brands, and social media
beating your competitors, then you need to be measuring
platforms, particularly Facebook, are at the forefront
the right things in order to improve your Facebook
of that. The key questions, once a belief in social and
presence to work towards these goals. Improvement
in optimization are established, are which metrics
is not possible without understanding and optimization.
should your brand focus on and how to measure them.
The first step is to understand what is available to you, both in the native analytics of Facebook, known as Facebook
Insights, and in the more advanced capabilities of platforms like Socialbakers. This white paper will cover what
is available in each to allow you to start to think about which you are most likely to find useful in your personal analysis.
Marketers claim that using Social Media
brings them the following benefits
Develop loyal fans
More marketplace intelligence
More exposure
Increasing traffic
2
A Marketer’s Guide to Facebook Metrics
We will cover what the key things you would use each metric for are, how easy it is to mine this data, and what you
could do with the data from each. We will talk a lot about public (comparable) metrics and private (non-comparable)
metrics in this piece. An appreciation of the difference is key, with private metrics often being useful but they are
much less able to be put into a contextual setting, unlike public metrics which can be compared to your competitors
to benchmark your performance.
On top of that, public metrics are translatable across all newsfeed-based
platforms, including Facebook, Twitter, Google+, and others, so you can compare your success on each channel.
First, we will review Facebook insights to let you know what it does and how it limits you, before discussing a plethora
of public & private metrics and their uses. Next, we will review the metrics to judge the most useful, leaving you
in a position with a lot more knowledge to decide what to measure, and how, for your brand going forward in 2014.
Your Page
Private Metrics in Native Tool
Private and Public Metrics
in Social Analytics Tool
Competitor’s
Page
Public Metrics in API
3
A Marketer’s Guide to Facebook Metrics
FACEBOOK INSIGHTS
Facebook launched their new Insights analytics for pages in June 2013. The rollout has replaced
the old system gradually from this point, with a more modern-looking platform with more available
data. Facebook Insights is a really useful system to understand the more basic elements of your
social media analytics requirements.
Facebook Insights covers some of the key metrics
Insights has a new element where you can compare
mentioned below and contains both public and private
your page demographics against the Facebook average,
metrics; however, it’s one major flaw is that it doesn’t
and your reach and engagement by demographic
include any real data to compare to on the public
compared to your total audience, but there are no
metrics, especially in terms of other companies.
metrics which easily allow you to compare to competitors
or other relevant pages.
However, if you do want to pull out reams of data purely on your page, Facebook Insights does have its uses. There
are six main tabs containing data on your Likes, Reach, Visits, Posts, and People, as well as an Overview tab covering
some headline figures. There is also the ability to download extensive spreadsheets containing all of this data broken
down by day at a page or post content level. This data is useful, but can be quite time consuming to analyse and
comprehend, as well as not having that critical context of comparing it to other pages.
If you’re new to Facebook as a business, we’d definitely recommend exploring Insights and seeing what is there
for yourself as a first step. Our recommendation would be to not stop there though in your quest to truly understand
your performance.
4
A Marketer’s Guide to Facebook Metrics
METRICS
Public Metrics
In this section, we will cover some of the key public metrics that are comparable to your competitors, including how
to get them, why to measure them, and what kind of actions you take from the results to improve your performance.
Page Size
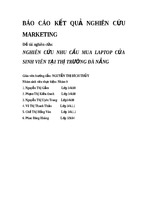
Page size is the first metric many people will concentrate on, particularly when their business is new to Facebook.
Page size, when viewed alone, is really a vanity metric as the amount of fans you have is irrelevant if you are not
engaging them and therefore not reaching the majority of them with your content. However, page size is a valid
metric as part of a collection of metrics.
The size of your page, and the rate of its growth can be gleaned from Facebook Insights, and from paid
analytics platforms. The advantage of using an analytics platform for metrics such as Page Size is that you can,
in one view, compare your page size and growth over time to another page to really quickly see if you are on track
or underperforming in your sector.
Page size is important to measure over time, for a number of reasons. If you are using Facebook advertising,
the size of your page may be a key goal and therefore having an eye on this metric may help you define success.
On the other hand, from a more organic standpoint, measuring your page growth over time can help you to see what
other marketing campaigns or content initiatives are driving new people to your page and causing new interactions
with your brand.
8 000
Porsche
Growth of Total Fans
Jaguar
6 000
4 000
2 000
0
Nov 11
Nov 18
Nov 25
Dec 02
Key actions you could take from a deeper understanding of this metric include further optimization of your advertising
campaigns, and a re-balancing of your other efforts that are potentially boosting your page size over time.
If the data shows that your page is not growing fast enough then you could consider Facebook advertising if you are
not already using this medium, or alternative methods such as promoting your Facebook presence on your after-sales
material, email marketing communications, or in your physical locations - all dependent upon your business type.
5
A Marketer’s Guide to Facebook Metrics
Engagement Rate
Engagement rate is an important metric for Facebook page owners, and one that is discussed the most. A strong
engagement rate can drive a brand forward, generating increased reach for each post. A weak engagement rate can
make your page feel empty and as if no one is interested in your brand, and your organic reach from each post will
continue to decline.
We calculate engagement rate like this:
# Likes + Comments + Shares
on a given date
# of wall posts made by page
Average Post
Engagement Rate
on a given date
Total Fans
on a given date
As you can see, engagement rate is tied to the relative size of the page, meaning that this is a metric which can
be used at a level playing field. You can compare your small, local businesses Facebook engagement rate
to a multi-national brand and the formula will hold true.
Facebook Insights doesn’t really provide this metric, instead preferring to break out raw interactions over time instead
of presenting an engagement percentage based on audience size. You can calculate it yourself using the above
formula and Facebook Insight’s spreadsheet data, however, this is labour intensive and again doesn’t provide you
with the numbers for the competition. We recommend using an analytical tool for engagement tracking, as you
can then engagement rate over time and compare it to key competitors to see how you are performing overall, and
at what times you are particularly over or underperforming.
Once you have this data, you can use it to optimize your content strategy by amending what you talk about or the way
you post on Facebook - using the data to improve your engagement is a critical part of Facebook page management.
By understanding what is and isn’t engaging for your specific audience you are able to constantly improve and make
sure your engagement rate is always improving - allowing you to have a better relationship with your audience.
Most Engaging Post Types
Porsche
Album
Link
0,79 % 0,58 %
0,02 %
Photo
Video
0,1600 %
0,03 %
Jaguar
Album
Link
0,40 % 1,06 %
Photo
0,42 %
Video
6
A Marketer’s Guide to Facebook Metrics
Shareability
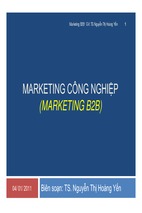
Shares/shareability is a great metric to study as an indicator of the quality and relevance of your content. Shares
are more powerful than likes and comments due to a user choosing to share that content with their audience
in it’s full form. This can boost your reach massively as your content is shared with non-fans in News Feed stories.
This, as part of interactions and overall engagement rates, affect Facebook’s EdgeRank algorithm, which optimises
the content users see in News Feed based on their interactions with a page. In essence, the more often users engage
with your content, the more likely they are to see your future posts.
Combine shareability with metrics such as engagement rate and page size to start to see your page’s true
performance in comparison to your other companies. Shareability stats are easiest to find in Socialbakers platform,
particularly when comparing to competitors data for a holistic view.
Actions you may take from tracking your shareability rates include changing your content strategy, changing posting
times, and amending content types to try to boost this metric. Measure each shift in strategy carefully, to allow you
to see which change has made the most positive impact upon your shareability - allowing you to continually improve.
15 000
120k
100k
10 000
80k
7 500
60k
5 000
40k
2 500
20k
0
Nov 11
Nov 18
Nov 25
Dec 02
Total Shares per Period
Shares per Day
Shareability
12 500
0
Response Rates/Times
These are key social customer service metrics. Response rate is the percentage of customer queries that are replied
to, and response time is the average time it takes a page to respond to those queries. A higher response rate and low
response time implies that a page is offering good customer service.
Response rates and times aren’t shown in Facebook Insights, but are a metric that can be calculated publicly
by studying posts of your page and your competitors. However, this is a very time consuming way of acquiring this
data. Paid social analytics platforms are a must for measuring these metrics as they will collate all of the response
rate and response time data into a single view - saving you a lot of data collation legwork.
Many pages will set themselves response rate and response time targets (similar to a call answering target in a traditional
call center), by benchmarking these metrics against other companies.
If the data shows that your page is lagging in this area, there are a number of possible causes and solutions - from
re-training, to the hiring of dedicated resources, all the way through to analyzing the route of the problems and
improving your overall offering.
7
A Marketer’s Guide to Facebook Metrics
People Talking About This
People talking about this (PTAT) is a metric that has historically been used to measure page awareness and
interactions over time. This metric is available to all through Facebook Insights, analytics platforms and in the front
end of the Facebook system.
PTAT has been a very popular metric amongst marketers since its launch and it includes key elements such as page
likes, likes, comments, shares, RSVP’s, check ins - in essence all interactions with a page.
The issue with PTAT is that it is not the most actionable metric as you cannot break it down into the component parts,
meaning that you can’t find out exactly what is and isn’t performing well so that you can optimize.
PTAT is a comparable metric as you view this in analytics platforms, and pull it off from any page by visiting the
“Likes” page within Facebook. Facebook itself, and marketers, are beginning to move away from this metric in favour
of more advanced metrics including those discussed above and below.
Private Metrics
In this section we’ll cover some of the key private metrics that you just can’t compare properly with competitors
through any social media platforms. Despite of this restriction, some of these metrics are still worth measuring as part
of your Facebook analytics. To see your public and private metrics in one place, you can connect your Socialbakers
Analytics account to Facebook Insights & Google Analytics to receive all of your data in one place.
Reach (organic vs paid)
Reach is an important metric that can be drawn from Facebook Insights for your page. The reach of each of your
posts is indicative of your engagement rate, as the higher your reach on a certain post, the better your engagement
is likely to have been in the run up to that post.
There are two types of reach, organic (which contains viral) and paid. Organic reach is your content being seen
by people who already like your page, with viral being their friends seeing your content based on any interaction that
creates a story in users’ NewsFeeds. Paid reach is purely generated by Facebook’s advertising products, namely
promoted posts.
This data is available in graphical format from Facebook Insight’s ‘Reach’ tab, and is worth keeping an eye on over
time to get a general view of your page’s performance. If your reach is low relative to your audience size (regularly
under 8%) the best course of action is to investigate your engagement rate to see where improvements can be made.
Improving your engagement will improve your reach.
In order to improve your reach, another option is to consider using Facebook’s promoted posts option or to try to grow
your audience with new fans who will see your engaging content going forward. This can be a great way to revitalise
your page and boost your reach for the long-term.
8
A Marketer’s Guide to Facebook Metrics
Non-public interactions/clicks
Non-public interactions such as clicks are naturally a key part of your Facebook analytics. Knowing how many
people are clicking through from your posts to your website, and on which posts they are doing so allows you
to optimize your content to have a better chance of driving ROI, particularly if you are an E-Commerce business.
This can be viewed in most analytics platforms, Facebook Insights, or just in Google Analytics when filtering by traffic
source. As with reach, non-public interactions are an important element to track, however these are non-comparable
meaning that you can’t ascertain whether your performance is good or bad. However, with this metric, comparing
and optimizing against yourself, post by post can be a useful technique.
Improving your click-through rate can have a positive impact upon your bottom-line. If your click-through rate is low,
or dropping against your previous posts, consider testing new posting methods. The use of ‘click-pointers’ such
as a semi-colon or an arrow can increase clickthrough rate for instance, there is also the potential to use more call
to action led copy in your posts leading to the link, such as “Click here for” to guide the user to your desired action.
Frequency & Unique Reach
The frequency metric is the amount of times someone was reached, allowing you to also be able to look at Unique
Reach. This is a Facebook-specific metric, but one that is quite useful in terms of deciphering whether you have
a broad audience, or a core audience of users who are always reached.
Again, this can be found in many analytics platforms and Facebook Insights, but unfortunately is not comparable
to other brands. If you have a low number of users seeing a lot of your content it may be worth trying to broaden
your content horizons to try to capture the interest of other users within your fan base.
Should your unique reach be low and your frequency be high, this means your content is only reaching a few people
but many times. The options here are similar to boosting your reach, with tactics to consider including focusing on
building your overall engagement rate, looking to grow your audience with new fans, and boosting to your posts within
your current audience for improved unique reach.
9
A Marketer’s Guide to Facebook Metrics
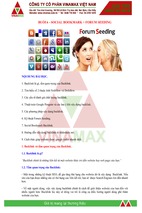
Audience demographics
Studying audience demographics is again highly useful, but unfortunately another area without competitor context.
However, Facebook Insights does allow you to compare the demographics of your pages audience to the total
Facebook audience, giving you a very broad comparison to consider.
Your audience demographics are important to know so that you can plan your Facebook content strategy with your
actual audience in mind. If your Facebook page isn’t representative of your target audience the best way to combat
this is through Facebook Page Like advertisements, where you can target certain demographics only in order to force
a re-balancing of your audience.
Understanding where your audience over-index compared to the total Facebook audience is useful in a number
of ways, and allows you to plan, activate and acquire in a more intelligent way.
Fans by gender and age
35 331
17 890
14 975
7 431
1 864
1 643
856
8 146
4 418
1 494
45-64
55-64
1 513
729
9 791
22 184
13-17
Male
18-24
25-34
35-44
65+
Female
Gender
13-17
18-24
25-34
35-44
45-64
55-64
65+
Total
Male
1 643
14 975
35 331
17 890
7 431
1 864
1 513
80 647
856
8 146
22 184
9 791
4 418
1 494
729
47 618
Female
10
A Marketer’s Guide to Facebook Metrics
Reach Engagement
Reach engagement is a new metric unique to Socialbakers Analytics which allows you to see the engagement from
the reach of your post, as opposed to comparing the interactions to your total audience on the page. This is only
available when connecting your Facebook to Socialbakers and is a non-comparable metric as it is based on reach
figures which are private.
This metric allows you to see your content’s true engagement from the people that have seen it, which is useful,
particularly if you are receiving a lot of shares and non-fan views.
Reach engagement is worth measuring alongside your main engagement rate as a secondary indicator. Although
it’s a private metric it’s very much worth keeping an eye on for your page.
Metrics Review
There are literally hundreds of Facebook metrics you can study to analyse the performance of your page. Without
putting this data into context by comparing to other companies, you are flying blind. Your private metrics may look
impressive, but without understanding your competitors performance you will never truly know where you stand.
Despite this, private metrics are worth studying and analysing, however they do not hold the same power as public
metrics.
Public API Data
Admin’s API Data
Insights
Analytics
Socialbakers
data cloud
Free Statistics
Socialbakers Analytics
Facebook Insights is useful as a native analytics platform, however, paid analytics services provide a wealth of extra
competitive data for your public metrics to allow you to make important comparisons quickly and easily. Socialbakers
Analytics allows you to view a quick KPI check, for your page and a competitor to see all of the key metrics straight
away in a comparative manner. This includes absolute change in fans, number of admin posts, people talking about
this figures, average page and post engagement rate, and number of total interactions - providing a useful dashboard
to see key metrics in one place.
Another key element is that Socialbakers aggregates industry data to allow you to see how you are performing
against the industry average rather than just a competitor to see how you are doing relative to your sector.
11
A Marketer’s Guide to Facebook Metrics
Socialbakers is a multi-channel platform, allowing you to compare your metric across Facebook, Twitter & YouTube.
This allows you to compare against your presence on other platforms as another comparison, allowing you to see
which platforms are performing better for you than others.
Ferrari
Lamborghini
Luxury Cars Label
Abs. Change in Fans
119 950
117 524
259 898,17
Rel. Change in Fans
+0,96 %
+1,89 %
+3,26 %
98 903
54 747
130 269,83
163
23
73,17
Avg. Page ER
0,17 % (+0,01 %)
0,18 % (-0,14 %)
0,33 % (-0,19 %)
Avg. Post ER
0,03 % (+0,00 %)
0,12 %(-0,09 %)
0,16 % (-0,10 %)
652 594
178 806
554 697,00
1 653
645
1 152,00
0,00 %
4,69 %
4,50 %
PTAT
Admin Posts
Total Interactions
User Posts
RR for Questions
Abs.
Change
in Fans
RR
for
Questions
Rel.
Change
in Fans
User
Posts
Total
Interactions
PTAT
Avg.
Post
ER
Avg.
Page
ER
Admin
Posts
Remember, that with Socialbakers you can connect your Facebook Insights data also, to enable you to see all of your
private and public metric together in one place. You can also connect Google Analytics, meaning that all of the above
data is available to you easily on one platform. Connecting the two allows you to see additional private metrics in the
Socialbakers platform and increase the power of it even further.
When it comes to engagement rate, shareability, page size and other public metrics it is crucial to understand how
you are performing against the sector as well as a competitor to get a more holistic view of the data and to allow you
to improve.
Conclusion
In conclusion, Facebook analytics are crucial to study for a great number of reasons, with the most important being
to improve your performance on the platform.
The key metrics are engagement rate, shareability, interactions and page size/fan growth at a public level, with
private metrics such as post reach and clicks also being key to measuring your success on Facebook.
In contrast Socialbakers Analytics allows you to analyse your page’s data alongside your competitors in one easy
place. The ability to compare across platforms, to pull in your private Facebook Insights metrics, and to look
at historical data makes Socialbakers the most powerful analytics platform out there to track all of your key metrics.
12
A Marketer’s Guide to Facebook Metrics
Key Differences between Socialbakers Analytics
and Facebook Insights
Features
Understand the performance of your page compared with competition
Insights
No ability to compare
with competition
Benchmark Page to the overall industry
Compare all monitored pages directly on the Dashboard
Understand how Socially Devoted* the Brand is in social media
General information about Brand’s audience
Export Data to Excel or text format
Measure Engagement of different post types (pictures, video, links...)
Pages’ Key Influencers
Monitor and analyze competitor’s activites
Receive comparitive analysis with new Charts section
* See explanation in the text
Only for your Pages
Can’t measure for competition
or industry’s best
13
A Marketer’s Guide to Facebook Metrics
Make the Right Decisions
Based on Comparative Social Analysis
of Your Competitors & Industry.
by
www.socialbakers.com
14
- Xem thêm -