YYePG Proudly Presents, Thx For Support!
YYePG Proudly Presents, Thx For Support!
World Economic
Situation and
Prospects 2006
asdf
United Nations
New York, 2006
YYePG Proudly Presents, Thx For Support!
This report is a joint product of the Department of Economic and Social Affairs (DESA),
the United Nations Conference on Trade and Development (UNCTAD) and the five
United Nations regional commissions (Economic Commission for Africa (ECA),
Economic Commission for Europe (ECE), Economic Commission for Latin America
and the Caribbean (ECLAC), Economic and Social Commission for Asia and the Pacific
(ESCAP), and Economic and Social Commission for Western Asia (ESCWA)). It provides
an overview of recent global economic performance and short-term prospects for the world
economy and of some key global economic policy and development issues. One of its
purposes is to serve as a point of reference for discussions on economic, social and related
issues taking place in various United Nations entities in 2006.
For further information, please contact:
In New York
In Geneva
Mr. José Antonio Ocampo
Under-Secretary-General
Department of Economic
and Social Affairs
Room DC2-2320
United Nations, New York 10017, U.S.A.
Phone: (212) 963-5958
Fax: (212) 963-1010
E-mail:
[email protected]
Mr. Supachai Panitchpakdi
Secretary-General
United Nations Conference on
Trade and Development
Palais des Nations, Room E-9050
1211 Geneva 10, Switzerland
Phone: (41) (22) 917-5806/5634
Fax: (41) (22) 917-0465
E-mail:
[email protected]
YYePG Proudly Presents, Thx For Support!
Executive Summary
iii
Executive Summary
The global outlook
Moderate world economic growth in 2006
World economic growth slowed noticeably in 2005 from the strong expansion in 2004. The
world economy is expected to continue to grow at this more moderate pace of about 3 per
cent during 2006.1 This rate of growth is, nonetheless, the same as the average of the past
decade. The United States economy remains the main engine of global economic growth, but
the dynamic growth of China, India and a few other large developing economies is becoming
increasingly important. Economic growth slowed down in most of the developed economies
during 2005, with no recovery expected in 2006. Growth will moderate further to 3.1 per cent
in the United States of America, while lacklustre performance will still prevail in Europe,
with growth reaching a meagre 2.1 per cent in 2006. The recovery in Japan is expected to
continue, albeit at a very modest pace of around 2 per cent.
Strong, yet insufficient growth
in the poorest countries
Generally, economic growth in most parts of the developing world and the economies in
transition is well above the world average. On average, developing economies are expected
to expand at a rate of 5.6 per cent and the economies in transition at 5.9 per cent, despite the
fact that these economies may face larger challenges during 2006. While China and India
are by far the most dynamic economies, the rest of East and South Asia is expected to grow
by more than 5 per cent. Latin America is lagging somewhat behind, with growth of about
3.9 per cent, but African economic growth is expected to remain solidly above 5 per cent.
Growing at 6.6 per cent, the least developed countries (LDCs) are faring even better, reaching the fastest average rate of growth they have had for decades. Even if these record levels
are sustained, per capita income growth is still not strong enough in many of these countries
to make sufficient progress towards the Millennium Development Goal of halving extreme
poverty by 2015. Much of the economic buoyancy of developing countries has resulted from
high export commodity prices, which may not be sustainable in the longer run. In contrast,
developing countries and LDCs that are net importers of oil and agricultural products have
been hurt by the high cost of oil and food imports.
Lacklustre employment growth worldwide
The employment situation worldwide remains unsatisfactory. The slowdown in growth partly
explains this. More importantly, though, employment creation is falling short of the increment in labour supply in the majority of countries. Consequently, in a large number of countries, unemployment rates are still notably higher than the levels prior to the global downturn
of 2000-2001. Despite strong growth performance, many developing countries continue to
face high levels of structural unemployment and underemployment which limit the impact of
growth on poverty reduction.
1
Growth is estimated at market prices. World output growth as measured with purchasing power paritybased weights is estimated at 4.3 per cent for 2005 and projected to reach 4.4 per cent in 2006.
YYePG Proudly Presents, Thx For Support!
iv
World Economic Situation and Prospects 2006
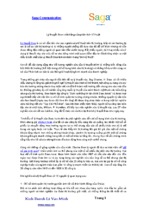
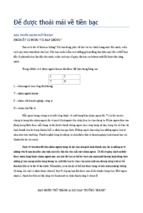
World economic growth slows down, but still robust for the decade
12
Volume of
world exports
Annual percentage change
10
World output
8
6
4
2
0
-2
1996
1997
1998
1999
2000
2001
2002
2003
2004
2005
2006
Growth in developing countries and economies in transition
stronger than in developed countries
Annual percentage change
2004
10
2005
2006
8
6
4
2
0
Developed
economies
Economies in
transition
Developing
economies
Least developed
countries
Slower growth in most developing-country regions, stronger growth in Africa
10
Annual percentage change
2004
2005
8
2006
6
4
Sources:
UN/DESA and Project LINK.
Note:
Figures for 2005 are partly
estimated. Figures for 2006
are forecasts.
2
0
Africa
East Asia
(excluding
China)
South Asia
(excluding
India)
YYePG Proudly Presents, Thx For Support!
Latin
America
Western
Asia
China
India
Executive Summary
v
Rising inflation, mainly due to oil price increases
Driven mainly by higher oil prices, inflation rates have edged up worldwide. Core inflation
rates, which exclude such highly volatile components as the prices of energy and food, have
been more stable, indicating that the pass-through of higher oil prices to overall inflation is
limited. In most parts of the world, economic agents seem to expect inflation to remain low
and stable. Worldwide inflation is forecast to remain tame during 2006. Nonetheless, certain
inflationary pressures will need to be addressed, particularly if oil prices stay high.
The negative consequences of
higher oil prices will be felt more
Higher oil prices are taking a greater toll in a growing number of oil-importing countries.
Following the initial rise in oil prices, many countries adopted measures to protect domestic consumers by introducing or strengthening energy price controls and subsidies. These
measures are becoming less and less viable as high oil prices persist and more of the price
increases are passed on to consumers. For the longer run, policies in energy-importing countries should aim at improving their energy efficiency and at developing alternative energy
sources. Oil-exporting countries continue to benefit from the higher oil prices, but at the
same time the windfall gains from oil revenues are creating inflationary pressures and real
exchange-rate appreciation. The macroeconomic policy challenge is to turn these gains into
investments in future economic and human development.
Global imbalances
constitute a downside risk
Global imbalances are widening further
The projected growth and relative stability of the world economy are subject to some degree
of uncertainty. The possibility of a disorderly adjustment of the widening macroeconomic
imbalances of the major economies is a major risk which could harm the stability and growth
of the world economy.
Global imbalances widened further during 2005. The current-account deficit of
the United States surpassed $800 billion, matched by increased surpluses elsewhere, particularly in Europe, East Asia and oil-exporting countries. In several parts of the world, growing
savings surpluses appear to be essentially caused by stagnating or reduced investment rates.
Investment has been ‘anaemic’ worldwide
The global investment rate has been on a long-term declining trend, reaching an historic low
in 2002, with a very slight recovery thereafter, but remaining below 22 percent of world gross
product. Accordingly, it may be inappropriate to speak of a “global savings glut”, as some
analysts have defined the macroeconomic condition of the world economy. Rather, investment demand has been “anaemic” in most of those countries running current-account surpluses, China being the notable exception among the largest economies. More specifically,
since 2001, the growth of non-residential business investment has been remarkably weak in
a large number of countries, regardless of their current-account balance position and despite
YYePG Proudly Presents, Thx For Support!
vi
World Economic Situation and Prospects 2006
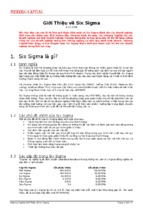
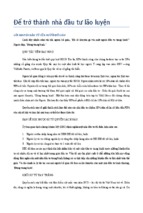
Widening global imbalances
400
Current-account balances in billions of dollars
Emerging Asia
European Union +
Norway, Switzerland
200
Japan
0
Major oil exporters
Other developing
countries and economies
in transition
-200
United States
-400
-600
Sources:
UN/DESA and Project LINK.
Note:
Figures for 2005 are
partly estimated.
-800
-1 000
1996
1997
1998
1999
2000
2001
2002
2003
2004
2005
generally buoyant corporate profits and low interest rates worldwide. There are prospects that
investment demand will pick up in 2006, which would strengthen economic growth. This will
not take away the risk of a disorderly adjustment of the macroeconomic imbalances of the
major economies, however.
Disorderly adjustment of global
imbalances is a clear and present danger
Despite low interest rates worldwide and ample liquidity in global financial markets, there
are strong reasons to be concerned about the sustainability of the global imbalances. The
current-account deficit of the United States continues to increase at a rapid pace. The concomitant rise in the United States net foreign liability position could eventually erode the
willingness of foreign investors to buy dollar-denominated assets. This could lead to a precipitous fall in the value of the United States dollar and an abrupt and disorderly adjustment
of the global imbalances.
Exchange-rate realignment is not the solution
During 2005, exchange rates of the major currencies did not move in directions indicated by
the global imbalances. The United States dollar rebounded strongly vis-à-vis the euro and Japanese yen. This has not helped to reduce the external deficit of the United States. In contrast,
a depreciation of the dollar might achieve that, but, given the size and nature of the deficit,
a very large devaluation would be needed. This in turn is undesirable, as orderly adjustment
of the global imbalances should avoid a free fall of the dollar. A strong depreciation of the
international reserve currency would imply large wealth losses for those holding dollar assets,
YYePG Proudly Presents, Thx For Support!
Executive Summary
vii
undermining confidence in the dollar and triggering a swift retreat of foreign investors from
such assets. The dollar did depreciate somewhat against the currencies of many developing
countries during 2005, causing negative wealth effects, particularly for those holding large
dollar reserves. None of this did much to prevent the global imbalances from widening, as was
the case with the depreciation of the dollar against the euro and the yen in 2003 and 2004.
Policy dilemmas in managing exchange
rates and reserves in developing countries
A number of developing countries have to deal with policy dilemmas in response to upward pressures on their exchange rates and increases in their foreign reserves. Many have
opted for intervening in foreign-exchange markets to avoid further loss in competitiveness,
while simultaneously undertaking active monetary policies to avoid that the expansion of the
money supply due to reserve increases leads to inflationary pressures. Exchange-rate policies and management of reserves may face conflicting policy objectives. On the one hand,
maintaining exchange-rate competitiveness is a crucial objective of macroeconomic policy
in open economies and failure to do so can have important effects on economic growth and
employment generation. On the other hand, the accumulation of reserves in these economies
represents a transfer of resources to the countries issuing the reserve currencies at a price
equivalent to the difference between the costs of their external borrowing and the (lower)
returns from their holdings of foreign reserve assets. The challenge is to find the adequate
balance between the desired degree of exchange-rate competitiveness and the cost of accumulating large foreign-exchange reserves.
Other downside risks
Oil prices are expected to remain high
The recent upward trend in oil prices has been mainly demand driven. As a consequence, the
negative global welfare effects have been largely compensated by continued income growth
worldwide. In the near term, though, the global oil market is expected to remain tight. Due
to underinvestment in global oil-production capacity over the past decade, the oil market is
nearing supply constraints. Oil prices should therefore be expected to remain high in the near
future. Furthermore, they may prove highly vulnerable to shocks, such as natural disasters
or terrorist attacks. World economic growth will be hit more severely if further oil price
increases are caused by supply shocks, as was the case with the oil shocks of the 1970s and
early 1980s. More recently, foreign direct investment (FDI) in the oil sector has increased
worldwide and governments of many oil-exporting countries have announced new investment plans and production incentives. Over time, this should raise production capacity. If, in
addition, oil importers take measures to reduce consumption of fossil energy structurally, the
price of oil may come down in the medium run.
An end to the house price bubble?
A reversal in house prices in economies that have experienced substantial and prolonged
appreciation in the value of houses could pose another downside risk to stable growth of
the world economy. The booming housing sector has been a major driver of output growth
YYePG Proudly Presents, Thx For Support!
viii
World Economic Situation and Prospects 2006
in many of these countries, and significant wealth effects coming from housing appreciation have boosted household consumption. However, various housing indicators in these
countries are at historical highs, and there are discernible signs of continuing speculative
activities. A cooling of house prices will therefore lead to a moderation of overall economic
growth, as already witnessed in Australia, the United Kingdom of Great Britain and Northern
Ireland and several other European countries. Moreover, declining house prices will heighten
the risk of default and could trigger bank crises. A number of these economies are also running large external deficits and have low household savings. A sharp fall in house prices in
one of the major economies could, then, precipitate an abrupt and destabilizing adjustment
of the global imbalances.
The cost of an avian influenza pandemic
The risks of an avian influenza pandemic should not be precluded. The recent outbreak of avian influenza in some countries has already caused significant economic losses and has claimed
70 lives worldwide. The world is not yet adequately prepared for an outbreak of pandemic
proportions. The possible macroeconomic costs of such a pandemic could be enormous.
Policy challenges to address
the global imbalances
International macroeconomic
policy coordination is needed
To mitigate the risk of a disorderly adjustment in the global imbalances, the major economies
should coordinate their macroeconomic policies over the medium run. It should be recognized
that an orderly adjustment of the imbalances will take some time. This is so, firstly, because
savings and investment patterns are not easily changed, and, secondly, because the adjustment
of the widely divergent net foreign asset and liability positions will require a prolonged shift
in the savings-investment balances of the major economies. Concretely, the adjustment will
require measures that will stimulate savings in the deficit countries and investment, or, more
generally, domestic spending in the surplus countries. More specifically, the United States
should stimulate household savings and reduce public dissaving. Europe should keep interest
rates down to stimulate private demand as room for fiscal expansion seems limited in most
countries. More efforts should be made to revitalize investment, which the structural reform
policies of recent years have failed to achieve. In Japan, financial sector reform should continue, and fiscal incentives to stimulate private investment demand should be strengthened
further. Most Asian surplus countries should boost public and private investment rates, while
China should boost broad-based consumption demand. Oil-exporting countries may increase
social spending and investment in their oil production capacity as well as in the diversification of their production structures. Given its nature, the International Monetary Fund would
provide the natural forum for international policy coordination.
YYePG Proudly Presents, Thx For Support!
Executive Summary
ix
Galvanizing financial resources for achieving the MDGs
In addition, all major economies should contribute to the mobilization of the additional financial resources to assist the poorest countries in achieving the Millennium Development
Goals, in compliance with international agreements. To support an orderly and equitable
global adjustment process, the major surplus countries in developed and emerging Asia and
Europe, as well as the major oil-exporting countries, could further contribute to global development by channelling more of their excess savings to the developing countries, which are
lacking adequate investment finance for their economic and social infrastructure needs.
International trade
World trade continues to expand, but non-oil
commodity prices are likely to come down
International trade is still providing an important impetus to the growth of the world economy. Trade flows continue to expand at double the pace of world output. The larger developing
countries, such as China and India, have seen sustained and strong export dynamics. A fair
number of other developing countries have gained from substantial improvement in their
terms of trade over the past few years, thanks largely to increases in the prices of oil and other
commodities. However, a number of oil-importing countries that export agricultural commodities have suffered important terms-of-trade losses, because some of their export prices
fell, because oil prices outpaced their export prices, or for both reasons. In general, prices
of primary commodities seem to have reached a plateau, and the outlook for many non-oil
commodities is for a decline in prices.
Little progress in multilateral trade negotiations…
Multilateral trade negotiations in the context of the Doha Round moved forward with the
Sixth World Trade Organization (WTO) Ministerial Conference in Hong Kong Special Administrative Region (SAR) of China in December 2005. Contrary to low expectations, and
even predictions of another failure, the results achieved could be qualified as very modest
and marginal, but nevertheless positive. The ministerial commitment “to complete the Doha
Work Programme fully and to conclude the negotiations launched at Doha successfully in
2006” will require considerable political will from the participants in order to make tough
decisions and conclude negotiations within a very tight time frame.
The agreement reached at the Hong Kong Ministerial Conference represents a
small step towards completing that agenda. First, a deadline was set to eliminate agricultural
export subsidies in developed countries by 2013. This agreement, however, is conditional
upon future agreements on full negotiating modalities as well as upon the establishment of
multilateral discipline on export competition measures, such as export credits, export credit
guarantees or insurance programmes, trade-distorting practices of State-trading enterprises
and food aid. Despite these caveats, the agreement represents a substantial systemic advance
by bringing agricultural trade further under the umbrella of general multilateral trade rules,
which prohibit the use of export subsidies. Secondly, agreement was reached on a limited
“development package” for LDCs. This consists of several commitments, including the permanent granting of duty-free and quota-free market access by developed countries and de-
YYePG Proudly Presents, Thx For Support!
x
World Economic Situation and Prospects 2006
veloping countries. In practical terms, the value of such treatment of exports from LDCs will
directly depend on the inclusiveness of product coverage. If, for example, textiles and clothing (which account for roughly 20 per cent of LDC exports) are excluded by some developed
countries, the gains of such a decision would be marginal. Some progress was achieved in
developing the Aid for Trade initiative, which should provide additional assistance to developing countries, particularly LDCs, to improve their supply capacity and trade infrastructure
in a manner which will allow them to benefit from the increased opportunities brought about
by trade liberalization. Third, a decision was made by developed countries to eliminate all
export subsidies for cotton in 2006. This decision is expected to have limited economic
impact in the medium term. Domestic support measures for cotton producers in developed
countries affect developing country cotton exporters much more strongly, particularly those
in Western Africa. These trade- and price-distorting measures still have to be dealt with in the
context of overall negotiations on agriculture.
… and trends towards renewed protectionism
Paralleling these advances, signs of increased protectionism and other distortions to world
trade have emerged. In the aftermath of the expiration of the Agreement on Textiles and Clothing, the European Union and the United States introduced limits on imports of certain Chinese textiles. The use of non-tariff barriers has increased worldwide, partially offsetting the
advances brought about by lower tariffs. Finally, there has been a mushrooming of regional
and bilateral free trade agreements. These have eroded the scope of the application of most
favoured nation tariffs and often exclude products of export interest to developing countries.
Such trade policies may well hamper the successful completion of the Doha Round.
Finance for development
Despite more favourable financing
conditions for developing countries…
Access to international finance has improved for developing countries over the past year.
Private capital inflows to emerging market economies declined in 2005, yet market access
continued to be favourable, and external financing costs dropped to historical lows. These
conditions have favoured the emerging market economies in particular. Developments need
to be followed with caution. The exceptionally low risk premiums for the external borrowing
by these countries may risk financial market overexuberance. This could be followed by a
sharp reversal of the capital flows in the future, causing costly destabilizing effects should
the global adjustment process entail rising interest rates or substantial swings in the exchange
rates of the major currencies.
…. net transfers flow from poor to rich
Despite growing private equity financing and foreign direct investment, developing countries
transfer in the aggregate more resources to developed countries than they receive. This net
transfer refers to the net inflow of financial resources less interest and other investment income payments. The pattern of negative transfers has lasted for about ten years and reflects
the growing export surpluses of developing countries. The magnitude of these transfers has
YYePG Proudly Presents, Thx For Support!
Executive Summary
xi
risen steadily from about $8 billion in 1997 to $483 billion in 2005. Net transfers to the
poorest countries in sub-Saharan Africa are still positive, but also on the decline, reaching $2
billion in 2005, down from $7.5 billion in 1997.
More aid, but still not enough
Official development assistance has recently increased in nominal terms, but the amount
of aid received by the LDCs in recent years, after excluding resource flows for emergency
assistance, debt relief and reconstruction, was only marginally higher than a decade ago.
More encouraging, however, is the prospect of development aid over the medium term as
significant progress has been made on commitments by major donors to deliver increased
and more effective aid. Nonetheless, even with these commitments, the share of ODA in the
gross national income (GNI) of Development Assistance Committee (DAC) countries would
reach 0.36 per cent, still far short of the 0.7 per cent target reaffirmed in the 2005 World Summit Outcome, and hence is also short of the estimated needs to finance actions by developing
country Governments in order to meet the Millennium Development Goals.
Enhanced South-South cooperation
New commitments have been made to strengthen and widen cooperation among developing
countries, or South-South cooperation, the United Nations being at the forefront of efforts to
foster such cooperation. Besides technical cooperation, other forms of South-South cooperation have been flourishing, such as monetary and financial cooperation, debt relief and grant
assistance.
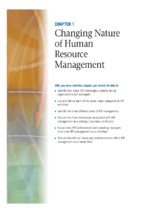
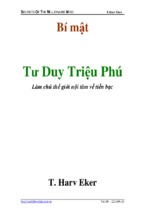
Increasing, but insufficient official development assistance (ODA)
0.40
0.36
140
0.35
120
0.30
0.30
0.26
0.25
ODA as a
percentage
of GNI
(left scale)
100
80
0.22
0.20
60
Total ODA
(right scale)
0.15
40
0.10
20
Total ODA to Africa
(right scale)
0.05
0
YYePG Proudly Presents, Thx For Support!
2010
2009
2008
2007
2006
2005
2004
2003
2002
2001
2000
1999
1998
1997
1996
1995
1994
1993
1992
1991
1990
0.00
ODA (in billions of 2004 dollars)
Percentage of GNI of DAC countries
0.33
Source:
OECD/DAC.
Note:
Data for 2005-2010 are
projections based on pledges
by DAC member states.
xii
World Economic Situation and Prospects 2006
Slow progress has been made in the
implementation of the HIPC debt-relief initiative
The implementation of the Heavily Indebted Poor Country (HIPC) Initiative for debt relief
continues to move forward, albeit slowly. Most debt indicators of developing countries are
improving. However, the HIPCs continue to face difficulties in reconciling the objectives
of achieving and maintaining debt sustainability, promoting long-term growth and reducing poverty, as some of them have to engage in borrowing to meet the increased needs for
financing their poverty reduction strategies. Unless they receive additional grant financing,
many of these countries would have to rely on new borrowing to fund their poverty reduction
expenditures, creating the possibility of a new cycle of large-scale external borrowing and
unsustainable debt.
Rising to the challenge of poverty reduction
The recent improvement in the growth of many poor countries is still not strong enough to
enable them to achieve the Millennium Development Goal of halving poverty by 2015 or
to meet the other internationally agreed development goals. At the 2005 World Summit, the
world’s leaders reiterated their political commitments already expressed at the previous highlevel international meetings on development issues, particularly the commitments contained
in the Millennium Declaration and the Monterrey Consensus. The challenge for all countries
is to live up to these commitments at the agreed level and within the agreed time frame.
YYePG Proudly Presents, Thx For Support!
Contents
xiii
Contents
I.
II.
III.
Executive Summary ...........................................................................................................
iii
Contents ..............................................................................................................................
xiii
Global outlook ....................................................................................................................
1
Macroeconomic prospects for the world economy..................................................................................................
Moderation of world economic growth expected ...................................................................................
Stabilizing international economic environment for developing countries .............................................
Lacklustre employment growth................................................................................................................
Impact of higher oil prices on inflation and income ................................................................................
Widening global imbalances....................................................................................................................................
Global investment anaemia, not a savings glut ......................................................................................
Widening net foreign asset positions and exchange-rate adjustment ...................................................
Downside risks of the global outlook.......................................................................................................................
Disorderly adjustment of imbalances ......................................................................................................
Additional oil price shocks .......................................................................................................................
End of the housing market bubble ...........................................................................................................
Other risks ................................................................................................................................................
Policy challenges and the case for international macroeconomic policy coordination...........................................
Current macroeconomic policy stance .....................................................................................................
Dealing with higher oil prices and inflated house prices ........................................................................
Redressing imbalances through coordinated policies .............................................................................
Galvanizing aid, trade and finance for achieving the MDGs ...................................................................
1
1
7
9
10
12
14
17
22
22
23
23
24
25
25
26
27
29
International trade .............................................................................................................
31
Trade flows: trends and outlook ...............................................................................................................................
Commodity prices and markets ................................................................................................................................
Non-oil commodities ................................................................................................................................
World oil markets .....................................................................................................................................
Trade policy developments and trends ....................................................................................................................
Doha negotiations: keeping the Round alive ...........................................................................................
Bilateral and regional trade agreements .................................................................................................
Non-tariff barriers: a rising trend in world trade .....................................................................................
Textiles and clothing: post-ATC developments ........................................................................................
Annex: Developments in non-oil commodity markets .............................................................................................
31
36
36
41
45
45
52
53
56
59
Financial flows to developing and transition economies...............................................
65
Net transfers of financial resources.........................................................................................................................
Net private capital flows: sustained positive investor sentiment and ample liquidity ...........................................
Increasing foreign direct investment .......................................................................................................................
65
66
70
YYePG Proudly Presents, Thx For Support!
xiv
World Economic Situation and Prospects 2006
IV.
International financial cooperation ..........................................................................................................................
Official flows: IMF is a net receiver of resources from developing countries .........................................
Official development assistance: more but still not enough ...................................................................
Initiatives to enhance aid effectiveness ..................................................................................................
South-South Cooperation is increasing ...................................................................................................
HIPC Initiative and other debt-relief measures .......................................................................................
Governance of the global financial system..............................................................................................
Multilateral surveillance ..........................................................................................................................
International standards and codes ..........................................................................................................
The modalities for official liquidity provision ..........................................................................................
Policies on crisis resolution .....................................................................................................................
IMF engagement with low-income countries ..........................................................................................
72
72
73
75
76
77
81
82
83
83
85
87
Regional developments and outlook ...............................................................................
89
Developed market economies ..................................................................................................................................
North America: imbalances and risks increase .......................................................................................
Developed Asia and the Pacific: ending deflation in Japan ....................................................................
Western Europe: a weak recovery in 2005 ..............................................................................................
The new EU members: dynamic but uneven growth ...............................................................................
Economies in transition ............................................................................................................................................
South-eastern Europe: dynamic growth continues but at a slower pace ...............................................
The CIS: strong growth prevails despite some slowdown ......................................................................
Developing economies .............................................................................................................................................
Africa: GDP growth continues to be robust .............................................................................................
East Asia: solid growth amidst increased downside risks ......................................................................
South Asia: a sustained broad-based growth .........................................................................................
Western Asia: boom conditions persist amidst uneven growth .............................................................
Latin America and the Caribbean: export-led growth .............................................................................
89
90
93
96
99
101
103
105
107
107
111
114
117
121
Annex
Statistical tables .................................................................................................................
125
Boxes
I.
I.
II.
II.
II.
III.
IV.
IV.
IV.
IV.
1.
2.
1.
2.
3.
1.
1.
2.
3.
4.
Major assumptions for the baseline global economic forecast for 2006 ................................................................
Prospects for the least developed countries............................................................................................................
WTO dispute settlement and commodities .............................................................................................................
The accession of Saudi Arabia and Tonga to WTO .................................................................................................
Monitoring development gains from trade: UNCTAD’s Trade and Development Index ..........................................
Basel II Capital Adequacy Framework .....................................................................................................................
The role of housing markets in the transmission of monetary policy......................................................................
Economic growth and labour-market outcomes in Eastern Europe and the CIS .....................................................
Avian influenza: worries in Asia ...............................................................................................................................
Oil windfall, booming stock markets and real estate sectors: is there a bubble on the way? ...............................
YYePG Proudly Presents, Thx For Support!
2
3
40
48
51
84
100
102
113
120
Contents
xv
Figures
I.
I.
I.
I.
I.
I.
I.
II.
II.
1.
2.
3.
4.
5.
6.
6.
1.
2.
II.
II.
II.
II.
II.
II.
III.
III.
IV.
IV.
IV.
IV.
IV.
3.
4.
5.
6.
7.
8.
1.
2.
1.
2.
3.
4.
5.
IV. 6.
IV. 7.
IV. 8.
Distribution of per capita GDP growth among developing countries ......................................................................
Global current-account imbalances, 1996-2005 ......................................................................................................
Global savings and investment rates, 1970-2004....................................................................................................
Fixed investment rates in major developed and developing economies, 1990-2004..............................................
Net foreign asset positions of major economies, 1994-2005..................................................................................
(a) Reserve accumulation and real exchange rates in Asia and Latin America, 2004-2005 ...................................
(b) Reserve accumulation and money supply growth in Asia and Latin America, 2004-2005 ................................
United States: Merchandise exports, petroleum and non-petroleum imports, January 2004-September 2005 ....
Selected regions and economies: share of merchandise
exports to China in total merchandise exports, 2000 and 2005 ..............................................................................
Selected economies: merchandise trade balance, 2003-2006 ................................................................................
Non-fuel annual average commodity price indices, 1970-2005 ..............................................................................
Prices of primary commodities and manufactures, 2000-2005 ...............................................................................
Oil prices, January 2003-October 2005....................................................................................................................
Brent oil: premium over OPEC basket, January 2003-November 2005 ...................................................................
Non-tariff trade barriers, 1994 and 2004 .................................................................................................................
Yield spreads on emerging market bonds, 1 January 2004-30 November 2005 .....................................................
Net official development assistance by DAC countries, 1990-2010 .......................................................................
Real interest rates in the euro area, Japan and the United States: January 1999-October 2005..........................
Standardized rates of unemployment in the EU-15, Japan and the United States: January 1999-October 2005..
CPI inflation in the EU-15, Japan and the United States: January 1999-October 2005 ..........................................
Annual rates of real GDP growth in Western Europe: selected countries, 2000-2006 ...........................................
Quarterly changes in real GDP in South-eastern Europe and the
Commonwealth of Independent States, first quarter 2002-third quarter 2005 .......................................................
Real GDP growth in Africa: the five fastest and five slowest performers in 2005 ..................................................
Growth in textile and clothing exports from selected South Asian
countries to the European Union and the United States, 2001-2005 ......................................................................
Latin America and the Caribbean: current-account balance, 2002-2005 ................................................................
5
13
15
16
18
21
21
32
33
35
37
38
42
44
54
68
75
89
92
94
96
104
109
115
123
Tables
I.
I.
III.
III.
III.
III.
1.
2.
1.
2.
3.
4.
Growth of world output, 1996-2006.........................................................................................................................
Frequency of high and low growth of per capita output, 2003-2006 ......................................................................
Net transfer of financial resources to developing economies and economies in transition, 1995-2005................
Net financial flows to developing countries and economies in transition, 1993-2005 ...........................................
Inflows of foreign direct investment, 2003-2005 .....................................................................................................
Outflows of foreign direct investment as a percentage of gross
fixed capital formation in selected developing economies, 2002-2004 ..................................................................
YYePG Proudly Presents, Thx For Support!
2
4
65
67
70
71
xvi
World Economic Situation and Prospects 2006
Explanatory Notes
The following symbols have been used in the tables
throughout the report:
BTA
bilateral trade agreement
CACs
collective action clauses
..
Two dots indicate that data are not available or are not
separately reported.
CAFTA
Central American Free Trade Agreement
CCL
Contingent Credit Line (IMF)
A dash indicates that the amount is nil or negligible.
CDB
Caribbean Development Bank
CGES
Center for Global Energy Studies
CIS
Commonwealth of Independent States
COM
common organization market
CPI
consumer price index
CTG
Council on Trade in Goods
–
-
A hyphen (-) indicates that the item is not applicable.
-
A minus sign (-) indicates deficit or decrease, except as
indicated.
.
A full stop (.) is used to indicate decimals.
/
A slash (/) between years indicates a crop year or
financial year, for example, 1990/91.
-
Use of a hyphen (-) between years, for example,
1990-1991, signifies the full period involved, including
the beginning and end years.
Reference to “dollars” ($) indicates United States
dollars, unless otherwise stated.
Reference to “tons” indicates metric tons, unless
otherwise stated.
Annual rates of growth or change, unless otherwise stated,
refer to annual compound rates.
In most cases, the growth rate forecasts for 2004 and 2005 are
rounded to the nearest quarter of a percentage point.
Details and percentages in tables do not necessarily add to
totals, because of rounding.
CVM
countervailing measures
DAC
Development Assistance Committee (of OECD)
EBRD
European Bank for Reconstruction and Development
EC
European Community
ECA
Economic Commission for Africa
ECB
European Central Bank
ECE
Economic Commission for Europe
ECLAC
Economic Commission for Latin America
and the Caribbean
EMBI
Emerging Markets Bond Index
EMU
European Monetary Union
ESM
Emergency Safeguard Measures (GATS)
EU
European Union
EURIBOR
Euro Interbank Offered Rate
FDI
foreign direct investment
The following abbreviations have been used:
Fed
United States Federal Reserve
ACP
African, Caribbean and Pacific (Group of States)
FSAP
Financial Sector Assessment Programme (IMF)
AD
anti-dumping
FSI
Financial Stability Institute
AfDB
African Development Bank
FSF
Financial Stability Forum
AfDF
African Development Fund
FTA
free trade agreement
ADB
Asian Development Bank
GATS
General Agreement on Trade in Services
AGOA
African Growth and Opportunity Act (United States)
GATT
General Agreement on Tariffs and Trade
AIG
Accord Implementation Group
GCC
Gulf Cooperation Council
AoA
Agreement on Agriculture
GDP
gross domestic product
APEC
Asia-Pacific Economic Cooperation
GNI
gross national income
APF
Africa Partnership Forum
GNP
gross national product
APRM
African Peer Review Mechanism
GSP
Generalized System of Preferences
ASEAN
Association of Southeast Asian Nations
HICP
Harmonized Index of Consumer Prices
ATC
Agreement on Textiles and Clothing
HIPC
heavily indebted poor countries
BIS
Bank for International Settlements
IADB
Inter-American Development Bank
BoJ
Bank of Japan
IASB
International Accounting Standards Board
bpd
barrels per day
IBRD
International Bank for Reconstruction and Development
YYePG Proudly Presents, Thx For Support!
Explanatory notes
xvii
IBSA
India-Brazil-South Africa (Dialogue Forum)
PRGF
Poverty Reduction and Growth Facility (IMF)
ICAC
International Cotton Advisory Committee
ICF
Investment Climate Facility for Africa
Project
LINK
ICO
International Coffee Organization
ICT
information and communication technologies
international collaborative research group for
econometric modelling, coordinated jointly
by the Development Policy and Analysis Division
of the United Nations Secretariat, and the
University of Toronto
IDA
International Development Association
PRS
poverty reduction strategy
IEA
International Energy Agency
PRSPs
Poverty Reduction Strategy Papers
IF
Integrated Framework for Trade-Related Technical
Assistance for the Least Developed Countries
PSI
Policy Support Instruments
IFAD
International Fund for Agricultural Development
PTA
preferential trade agreement
IFIs
international financial institutions
QIS
Quantitative Impact Studies
IFRS
International Financial Reporting Standards
R&D
research and development
IIF
Institute of International Finance
RMG
ready-made garment
IMF
International Monetary Fund
IMFC
International Monetary and Financial Committee
IPMA
International Primary Market Association
IPNs
international production networks
IT
information technology
ITCB
International Textiles and Clothing Bureau
LDCs
least developed countries
LME
London Metal Exchange
M&As
mergers and acquisitions
mbpd
million barrels per day
MCA
Millennium Challenge Account
MCC
RTAs
regional trade agreements
SARS
severe acute respiratory syndrome
SCM
Agreement on Subsidies and
Agreement Countervailing Measures
SDRs
special drawing rights (IMF)
SDT
special and differential treatment
SGP
Stability and Growth Pact (EU)
SIDS
small island developing States
SOEs
State-owned enterprises
SPS/TBT
Sanitary and Phytosanitary Measures
and Technical Barriers to Trade
Millennium Challenge Corporation
TCMCS/
TRAINS
Coding System of Trade Control Measures/
Trade Analysis and Information System
MDGs
Millennium Development Goals
TDI
Trade and Development Index (UNCTAD)
MDRI
Multilateral Debt Relief Initiative
TNCs
transnational corporations
MFN
most favoured nation
TQ
tariff quota
MRAs
mutual recognition agreements
MTS
multilateral trading system
TRADE Act
of 2005
Tariff Relief Assistance for
Development Economies Act of 2005
NAMA
non-agricultural market access
TRIPs
trade-related intellectual property rights
NGLs
natural gas liquids
UN/DESA
NPV
net present value
Department of Economic and Social Affairs
of the United Nations Secretariat
NTBs
non-tariff barriers
UNCTAD
United Nations Conference on Trade and Development
NYBOT
New York Board of Trade
UNDP
United Nations Development Programme
ODA
official development assistance
UNICEF
United Nations Children’s Fund
OECD
Organization for Economic Cooperation
and Development
UNFPA
United Nations Population Fund
WGP
world gross product
OPEC
Organization of the Petroleum Exporting Countries
WHO
World Health Organization
OPT
Occupied Palestine Territory
WIDER
PA
Palestinian Authority
World Institute for Development
Economics Research (UNU)
pb
per barrel
WFP
World Food Programme
PPP
purchasing power parity
WTO
World Trade Organization
YYePG Proudly Presents, Thx For Support!
xviii
World Economic Situation and Prospects 2006
The designations employed and the presentation of the material in this publication do not imply the expression of any opinion whatsoever on the part
of the United Nations Secretariat concerning the legal status of any country, territory, city or area or of its authorities, or concerning the delimitation
of its frontiers or boundaries.
The term “country” as used in the text of this report also refers, as appropriate, to territories or areas.
Data presented in this publication incorporate information available as of 15 December 2005.
For analytical purposes, the following country groupings and
subgroupings have been used:a
Developed economies (developed market economies):
European Union, Iceland, Norway, Switzerland Canada, United States of
America, Australia, Japan, New Zealand.
Major developed economies (the Group of Seven):
Canada, France, Germany, Italy, Japan, United Kingdom of Great Britain and
Northern Ireland, United States of America.
European Union:
Austria, Belgium, Cyprus, Czech Republic, Denmark, Estonia, Finland, France,
Germany, Greece, Hungary, Ireland, Italy, Latvia, Lithuania, Luxembourg, Malta,
Netherlands, Poland, Portugal, Slovakia, Slovenia, Spain, Sweden, United
Kingdom of Great Britain and Northern Ireland.
EU-10:
Cyprus, Czech Republic, Estonia, Hungary, Latvia, Lithuania, Malta, Poland,
Slovakia, Slovenia.
EU-8:
All countries in EU-10, excluding Cyprus and Malta.
Economies in transition:
South-eastern Europe:
Albania, Bosnia and Herzegovina, Bulgaria, Croatia, Romania, Serbia and
Montenegro, The former Yugoslav Republic of Macedonia.
Commonwealth of Independent States (CIS):
Armenia, Azerbaijan, Belarus, Georgia, Kazakhstan, Kyrgyzstan, Republic
of Moldova, Russian Federation, Tajikistan, Turkmenistan, Ukraine,
Uzbekistan.
Net fuel exporters:
Azerbaijan, Kazakhstan, Russian Federation, Turkmenistan, Uzbekistan.
Net fuel importers:
All other CIS countries.
Developing economies:
Latin America and the Caribbean, Africa, Asia and the Pacific (excluding
Japan, Australia, New Zealand, and the member States of CIS in Asia).
Subgroupings of Latin America and the Caribbean:
South America:
Argentina, Brazil, Chile, Colombia, Ecuador, Paraguay, Peru, Uruguay,
Venezuela (Bolivarian Republic of).
Mexico and Central America:
Costa Rica, El Salvador, Guatemala, Honduras, Nicaragua, Panama,
Mexico.
Caribbean:
Barbados, Cuba, Dominican Republic, Guyana, Haiti, Jamaica, Trinidad and
Tobago.
Subgroupings of Africa:
North Africa:
Algeria, Egypt, Libyan Arab Jamahiriya, Morocco, Tunisia.
Sub-Saharan Africa, excluding Nigeria and South Africa
(commonly contracted to “sub-Saharan Africa”):
All other African countries except Nigeria and South Africa.
a
For definitions of country groupings and
methodology, see World Economic and Social
Survey, 2004 (United Nations publication,
Sales No. E.04.II.C.1, annex, introductory
text).
Subgroupings of Asia and the Pacific:
Western Asia:
Bahrain, Iraq, Israel, Jordan, Kuwait, Lebanon, Oman, Qatar, Saudi Arabia,
Syrian Arab Republic, Turkey, United Arab Emirates, Yemen.
East and South Asia:
All other developing economies in Asia and the Pacific (including China,
unless stated otherwise). This group is further subdivided into:
South Asia:
Bangladesh, India, Iran (Islamic Republic of), Nepal, Pakistan, Sri Lanka.
East Asia:
All other developing economies in Asia and the Pacific.
For particular analyses, developing countries have been
subdivided into the following groups:
Oil-exporting countries:
Algeria, Angola, Bahrain, Bolivia, Brunei Darussalam, Cameroon, Colombia,
Congo, Ecuador, Egypt, Gabon, Iran (Islamic Republic of), Iraq, Kuwait, Libyan
Arab Jamahiriya, Mexico, Nigeria, Oman, Qatar, Saudi Arabia, Syrian Arab
Republic, Trinidad and Tobago, United Arab Emirates, Venezuela (Bolivarian
Republic of), Viet Nam.
Oil-importing countries:
All other developing countries.
Least developed countries:
Afghanistan, Angola, Bangladesh, Benin, Bhutan, Burkina Faso, Burundi,
Cambodia, Cape Verde, Central African Republic, Chad, Comoros, Democratic
Republic of the Congo, Djibouti, Equatorial Guinea, Eritrea, Ethiopia,
Gambia, Guinea, Guinea-Bissau, Haiti, Kiribati, Lao People’s Democratic
Republic, Lesotho, Liberia, Madagascar, Malawi, Maldives, Mali, Mauritania,
Mozambique, Myanmar, Nepal, Niger, Rwanda, Samoa, Sao Tome and
Principe, Senegal, Sierra Leone, Solomon Islands, Somalia, Sudan, TimorLeste, Togo, Tuvalu, Uganda, United Republic of Tanzania, Vanuatu, Yemen,
Zambia.
Landlocked developing countries:
Afghanistan, Armenia, Azerbaijan, Bhutan, Bolivia, Botswana, Burkina Faso,
Burundi, Central African Republic, Chad, Ethiopia, Kazakhstan, Kyrgyzstan, Lao
People’s Democratic Republic, Lesotho, Malawi, Mali, Moldova (Republic of),
Mongolia, Nepal, Niger, Paraguay, Rwanda, Swaziland, Tajikistan, The former
Yugoslav Republic of Macedonia, Turkmenistan, Uganda, Uzbekistan, Zambia,
Zimbabwe.
Small island developing States:
American Samoa, Anguilla, Antigua and Barbuda, Aruba, Bahamas, Barbados,
Belize, British Virgin Islands, Cape Verde, Commonwealth of Northern
Marianas, Comoros, Cook Islands, Cuba, Dominica, Dominican Republic, Fiji,
French Polynesia, Grenada, Guam, Guinea-Bissau, Guyana, Haiti, Jamaica,
Kiribati, Maldives, Marshall Islands, Mauritius, Micronesia (Federated States
of), Montserrat, Nauru, Netherlands Antilles, New Caledonia, Niue, Palau,
Papua New Guinea, Puerto Rico, Samoa, Sao Tome and Principe, Seychelles,
Singapore, Solomon Islands, St. Kitts and Nevis, St. Lucia, St. Vincent and the
Grenadines, Suriname, Timor-Leste, Tonga, Trinidad and Tobago, Tuvalu, U.S.
Virgin Islands, Vanuatu.
Heavily Indebted Poor Countries (countries that have reached their Completion
Points or Decision Points):
Benin, Bolivia, Burkina Faso, Burundi, Cameroon, Chad, Democratic Republic
of the Congo, Ethiopia, Gambia, Ghana, Guinea, Guinea-Bissau, Guyana,
Honduras, Madagascar, Malawi, Mali, Mauritania, Mozambique, Nicaragua,
Niger, Rwanda, Sao Tome and Principe, Senegal, Sierra Leone, Uganda, United
Republic of Tanzania, Zambia.
The designation of country groups in the text and the tables is intended solely
for statistical or analytical convenience and does not necessarily express
a judgement about the stage reached by a particular country or area in the
development process.
YYePG Proudly Presents, Thx For Support!