ĐẠI HỌC QUỐC GIA HÀ NỘI
TRƯỜNG ĐẠI HỌC CÔNG NGHỆ
Trần Tiến Công
MULTI AGENT SYSTEM FOR TRAFFIC SIMULATION IN
VIETNAM
Ngành: Công nghệ thông tin
Chuyên ngành: Khoa học máy tính
Mã số: 60.48.01
LUẬN VĂN THẠC SĨ KHOA HỌC MÁY TÍNH
NGƯỜI HƯỚNG DẪN KHOA HỌC: PGS. TS. BÙI THẾ DUY
Hà Nội - 2013
ORIGINALITY STATEMENT
‘I hereby declare that this submission is my own work and to the best of my
knowledge it contains no materials previously published or written by another
person, or substantial proportions of material which have been accepted for the
award of any other degree or diploma at University of Engineering and
Technology (UET/Coltech) or any other educational institution, except where
due acknowledgement is made in the thesis. Any contribution made to the
research by others, with whom I have worked at UET/Coltech or elsewhere, is
explicitly acknowledged in the thesis. I also declare that the intellectual content
of this thesis is the product of my own work, except to the extent that assistance
from others in the project’s design and conception or in style, presentation and
linguistic expression is acknowledged.’
Hanoi, October 7th, 2013
Signed ........................................................................
i
ABSTRACT
The VTS is a system that allows users to design different road systems as well as
to create different simulation scenarios with different agent profiles. It was built
in 2010 based on the theory of Agent and Multi Agent System. During 2011 and
2012, it was improved and many experiments were performed regarding to the
real data collected from VOV traffic online. The results are promising and we
hope that it could be able to help the traffic planners to solve the sore issues of
traffic in Vietnam at the moment.
PUBLICATION
*The Duy Bui, Duc Hai Ngo, Cong Tran, Multi-agent based Simulation of
traffic in Vietnam, 13th International Conference, PRIMA, Kolkata, India, pp.
636-648, 2010
ii
TABLE OF CONTENT
List of Figures .................................................................................................... v
List of Tables ..................................................................................................... v
List of Abbreviations ......................................................................................... vi
Acknowledgement............................................................................................ vii
Chapter 1. Introduction ..................................................................................... 1
1.1. Motivation, objectives and approach ...................................................... 1
1.2. Outline of the thesis ............................................................................... 2
Chapter 2. Literature Review ............................................................................ 3
2.1. Models of traffic simulation ................................................................... 3
2.1.1. Scope ............................................................................................... 3
2.1.2. Time ................................................................................................ 9
2.1.3. Multi-agent system for traffic simulation ....................................... 11
2.2. Conclusion ........................................................................................... 14
Chapter 3. Vietnam Traffic Simulator ............................................................. 15
3.1. Introduction to multi-agent system ....................................................... 16
3.1.1. Agent ............................................................................................. 16
3.1.2. Multi Agent Systems – MAS ......................................................... 18
3.1.3. Agent based model – ABM ............................................................ 19
3.1.4. ABM development ......................................................................... 19
3.2. Modeling .............................................................................................. 20
3.2.1. The road system ............................................................................. 21
3.2.2. Agents representing traffic participants .......................................... 22
3.2.3. Agent’s planning ............................................................................ 23
3.3. Improvement ........................................................................................ 26
3.3.1. Additional Features ........................................................................ 26
iii
3.3.2. Correction ...................................................................................... 27
Chapter 4. Evaluation ...................................................................................... 29
4.1. Method ................................................................................................. 29
4.2. Results ................................................................................................. 34
4.3. Discussion ............................................................................................ 37
Chapter 5. Conclusion ..................................................................................... 38
5.1. Conclusion ........................................................................................... 38
5.2. Future development.............................................................................. 38
REFERENCES................................................................................................. 39
iv
List of Figures
Figure 1. VISSIM visual interfaces .................................................................................................... 4
Figure 2.VISSIM statistic fuction ....................................................................................................... 4
Figure 3.Traffic light simulation system ............................................................................................10
Figure 4. Highway simulation system................................................................................................12
Figure 5. A part of highway road.......................................................................................................13
Figure 6. Road Area ..........................................................................................................................22
Figure 7. Connection road areas. .......................................................................................................22
Figure 8. Detecting possible collisions. .............................................................................................26
Figure 9. Interface and simulation of the traffic light .........................................................................27
Figure 10. Some examples of real time traffic data ............................................................................30
Figure 11. the Khuat Duy Tien – Tran Duy Hung crossroad in the simulator .....................................30
Figure 12. the Khuat Duy Tien – Tran Duy Hung crossroad captured by the traffic camera ................31
Figure 13. Distribution of inflow vehicles in real data .......................................................................33
Figure 14. Timegraph of inflow inflow vehicles in real data ..............................................................33
Figure 15. The worst case of achieved results ....................................................................................34
Figure 16. The best case of achieved results ......................................................................................34
Figure 17. Normalization of achieved results .....................................................................................35
Figure 18. The decrease rate of velocity ............................................................................................36
Figure 19. Traffic light data observation ............................................................................................36
List of Tables
Table 1. An example of randomized parameters ................................................................................28
Table 2. Parameters of KDT – TDH crossroad ..................................................................................30
Table 3. The information query form.................................................................................................32
Table 4. An example of query data ....................................................................................................32
Table 5. Default parameters of the simulation....................................................................................32
v
List of Abbreviations
MAS – Multi agent system
ABM – Agent Based Model
VTS – Vietnam Traffic Simulator
VISSIM – Visual Traffic Simulation System
KDT – Khuat Duy Tien
TDH – Tran Duy Hung
PH – Pham Hung
HL – Hoa Lac
vi
Acknowledgement
First and foremost, I would like to express my deepest gratitude to my
supervisor, Ass.Prof. Bui The Duy, for his patient guidance and continuous
support throughout the years. He always appears when I need help, and responds
to queries so helpfully and promptly. I would like to give my honest
appreciation to my co-partner Ngo Duc Hai for his kindly support although he
had to prepare for his study oversea. I would also like to thank my friend, Vu
Tien Thanh, for his kindly help. I sincerely acknowledge all my lectures in
University of Engineering and Technology, Vietnam National University, Hanoi,
for guidance in my master study. Finally, this thesis would not have been
possible without the support and love of my family. Thank you!
vii
Chapter 1.
1.1.
Introduction
Motivation, objectives and approach
In Vietnam, the transportation system is now facing many problems in terms of
congestions and accidents. Especially in big cities like Hanoi, the transportation
system is chaotic, due to narrow roads, increasing number of vehicles, and lack
of consciousness to follow the traffic rules from participants. Many solutions
have been proposed and implemented which imposed a great effect on the
development of the transportation system itself as well as awareness of the
whole society. However, most of these solutions usually require a huge financial
effort to be able to prove effectiveness. Therefore, a method which helps reduce
the cost of improving the current transportation situation should draw attention
of researchers. It is the reason why I was motivated to do my thesis regarding to
this theme.
In developed countries, transportation planners always have to have a strategic
vision which can identify a clear plan to develop the transport system. Such
knowledge could be attained by experimenting on traffic simulators. With
information provided by these simulators, the policy makers can figure a way to
reduce the cost of traffic infrastructure building. Literally, the use of multi agent
system in simulating the behavior of the society is a common trend of solving
problems like transportation. Following this trend, we started to build the
Vietnam Traffic Simulator (VTS) based on the multi agent system model under
the guidance of Assc. Prof. Bui The Duy in 2010[17]. This thesis mainly aims to
strengthen the correctness of the VTS.
To phrase it another way, the completion of the evaluation for this simulator is
the main target of this thesis. It requires some approaches in both proactive and
reactive ways. With the base knowledge acquired from research of MASs, I
1
added some additional features and improved the structure of VTS to be more
suited for the traffic in Vietnam. To be more specified, I had gathered data from
many sources, had added a function, had corrected the behavior of the simulator
and then I implemented to evaluation phase.
1.2.
Outline of the thesis
The outline of the thesis is as following: Chapter 2 will be the literature review
about traffic simulation models and the approach based on the Multi-agent
model. Chapter 3 is about some main features of Vietnam Traffic Simulator,
including some new improvement after the short paper presented in PRACSYS
2010 [17]. The evaluation steps will be presented in chapter 4. The last chapter
is the conclusion and future research.
2
Chapter 2.
2.1.
Literature Review
Models of traffic simulation
Traffic simulation can be used to: find treatments for a problem of a traffic
system; test new designs of transportation facilities before the commitment of
resources to construction; analyze safety of a system; or train traffic
management personnel [6]. Due to the complexity of the transportation system,
there are two ways of modeling it with regards to scope and time. In this section
we will introduce some models that are used to be the base stones of Vietnam
Traffic Simulator with regards to three categories: time, scope and multi-agent
based system.
2.1.1. Scope
Simulation models of traffic can be categorized by level of detail: macroscopic
[4, 8], microscopic [1, 9, 10, 11], mesoscopic [2, 7], and nanoscopic [3]. A
macroscopic model describes entities and their activities and interactions at a
low level of detail. For example, the traffic stream may be represented in some
aggregate manner such as a statistical histogram or by scalar values of flow rate,
density and speed. A microscopic model describes both the system entities and
their interactions at a high level of detail. A mesoscopic model generally
represents most entities at a high level of detail but describes their activities and
interactions at a much lower level of detail than would a microscopic model.
With nanoscopic models, nano simulation attempts to model drivers’ steering
behaviour and more detailed components of perception-reaction time in order to
depict the the human performance.
* Visual Traffic Simulation System
3
In this subsection we introduce a system named Visual Traffic Simulation
System (VISSIM) which is one of the mesoscopic systems developed by
Thomas Fotherby [14]. This system is diverse in many kinds of traffic systems
simulations. In details, it provides function to design the transportation
infrastructure with detailed information of flowing vehicles such as numbers of
cars, trucks and their velocities.
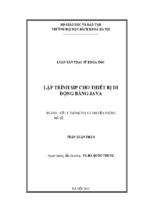
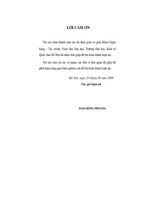
Figure 1. VISSIM visual interfaces
Figure 2.VISSIM statistic fuction
This system consists four application components: Road Network Designer,
Traffic Modelling Designer, Visual Simulation, Application Results. We will
summarize some main features of these components that are being used as
suggestions for VTS as below:
4
Road Network Designer
This section of the application should allow a user to quickly design simple
schematic road diagrams (road networks)
Variables:
- The application should be to-scale (e.g. x screen pixels per metre).
- The application should start by showing a drawing panel as a blank
designing area (representing a x*x m square area).
- Assume terrain is always flat (a simplification).
Drawing techniques:
- Lanes are drawn on the panel in straight-line sections. Each new
section of the lane follows on from the previous section.
- Any existing lane should be able to be extended with another identical
lane next to it (space permitting).
- Existing lanes should be able to be deleted.
Junction models:
- When the ends of three or more lane-sections overlap a junction should
form.
- Lanes should also be able to pass over or under other lanes. Therefore
there are 4 options at any point where lanes cross other lanes.
Panel features:
- There should be buttons for: create Lane, create Road, Add Lane,
Delete Lane.
- Road designs should be able to be saved and loaded.
Traffic-Modelling Tool (Pre-condition: a valid road network.)
For the application to be realistic and produce useful results the user must be
able to specify the traffic data that the simulator will use. This data may be
based on real observations obtained from electronic detection devices and traffic
surveys.
5
Road network facts:
- A junction has inputs and outputs.
- Each junction has unique input and output traffic-flow intensities.
- The input traffic-intensity of one junction will be a function of the
output traffic-intensities of other junctions.
- A certain amount of cars will enter the system according to some kind
of control element.
- A car can start at any input into the system and go to any output.
- All cars should eventually exit the system (No infinite loops).
Requirements:
- For each input to the system users should be able to specify the
average or exact number of cars per minute that will enter. This will
require labelling of the roads in the designed road network.
- There should be an option to randomise the car input data each time
the simulation is run, or otherwise the simulation will run with
precisely the same data (the same number of cars enter at the same
time).
Panel features:
- Traffic-flow models should be able to be saved and loaded.
Visual Simulation (Pre-condition: A valid road network.)
This section should present animated graphics with drawn-to-scale vehicles
moving through the geometry of the system. The traffic that is animated is
generated and controlled according to statistics specified by the "trafficmodelling tool".
Vehicle behaviour model:
- Cars obey a speed limit. This is their "top speed". An example maybe
between 50 and 60 kilometres/hour (31-37mph).
- Cars enter the system at top speed at positions and times according to a
set traffic-model specified by the "traffic-modelling tool".
- Cars do not collide.
6
- Cars can only enter the system if they are in a valid position. (Not a
collision).
- Cars can only change lanes at junctions. (No U-turns).
- Cars will always try to go at their top speed when possible but their
speed is governed by the "car-following model" described below.
- Cars can only change speed by accelerating or decelerating.
Acceleration will be a constant value (for example 5m/s2). Deacceleration measures should be sensible (i.e a car should not be able
to stop in no time).
- Cars do not take independent decisions. A car travel route and the lane
it is in depends entirely on its starting position and the statistical
decisions of the junctions it passes through.
Car following model:
- A Car will travel at its top speed limit unless it is within 10m of
another car.
- It must de-accelerate to match the other cars speed by the time there is
a 3m distance.
- It must never go within 1m of another car on the same lane.
Car pull-up model:
- Cars follow this model when pulling up to red lights, give-way signs or
if there is stopped traffic ahead.
- At a suitable distance before the obstruction the car will de-accelerate
with a constant value to stop in time.
Lane changing behaviour model:
- The project is simplified to not include overtaking.
- A car will only change lane at junctions according to the junction
traffic-model statistics.
Vehicle behaviour at give-way junctions
- Cars on the main route are unaffected and travel as normal according
to the car-following model.
7
- Cars on the slip roads "pull up" to the give-way line to check for
oncoming traffic.
- Cars on the slip-road can join the main-route if they aren't going to
obstruct the cars on the main-route. I.e. there must be a suitably large
clear section of traffic on the main route. This is the gap-acceptance
model.
Vehicle behaviour model at signalled junctions:
- Signals are independent for each input lane.
- Cars will "pull-up" to the stop line if the signal is red.
- The signal is two-phase. Go is green, stop is red.
- On a green signal the car is specified an output lane (according to the
traffic-model of the junction) and will travel to the output lane in a
direct route.
- Traffic light timing intervals will be initially split fairly between
different sets. Later, traffic lights can be re-programmed to be more
intelligent.
- The colour of a traffic light will be conveyed on the screen by the
colour of the stop line at a particular lane. In addition if the light for a
lane is green there should be arrows displayed on the junction
specifying where cars have the option of going.
Dynamic traffic controls:
- For each input to the system there should be a control to increase or
decrease the traffic entering at that input.
Application Results
Each component of the simulated traffic system should log data:
- Each input and output of the system should have a log of how many
cars passed through.
- Every junction should log how many cars passed through each input
and output lane.
8
- Each traffic-light junction should store the timing intervals of each
light.
- There should be traffic flow data for the system as a whole. (Number
of cars passed through per second).
- There should be a value estimating total surface area of road surface
used in the current network design.
*All of these features are implemented in the VTS.
2.1.2. Time
Time is a basic independent variable in almost all traffic simulation models.
Continuous simulation models describe how the elements of a system change
state continuously over time in response to continuous stimulation. Discrete
simulation models represent real-world systems by asserting that their states
change abruptly at points in time. There are generally two types of discrete
models: discrete time (e.g. [9, 1]) and discrete event (e.g. [7]). With discrete
time models, activities which change the states of the system elements are
computed within each time interval. The discrete event models only perform the
calculation based on the happening of events.
* Intelligent Traffic light control system
In this subsection we introduce a simulator named Green Light District
Simulator developed by Utrecht University (Netherland) [7]. This is a system
which supports the determination in duration of traffic lights
9
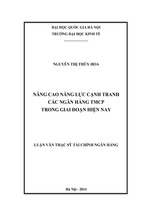
Figure 3.Traffic light simulation system
Basically, it is a microscopic traffic simulation system. However, it also includes
discrete events based on time and some parameters such as the density of traffic,
average velocities of vehicles, etc… These information are used to automatically
suggest the duration of traffic lights.
The main components of this system are:
- Drive Lane consists of two parallel lines.
- Road made by 2 Drive Lane. It includes information about direction,
incoming and outgoing gates which form the transportation network.
- Node is the term describing cross cuts between conjuction and
crossroad.
- EdgeNode describes areas in which cars go in and out.
- Sign describes the traffic lights. These places are the points where the
duration adjustment algorithm is deployed automatically.
10
- Cars play an important role in the simulation. However, due to the
main target of this simulation is automatic traffic light adjustment, the
model of moving vehicles is simplified.
During the simulation phase, the system gathers statistical data such as density,
number of incoming and outgoing vehicles in order to provide parameters for
the duration adjustment algorithm of traffic lights.
2.1.3. Multi-agent system for traffic simulation
As a powerful tool of microscopic simulation, multi-agent based simulation has
been used for traffic domain, e.g. [13, 11]. Giving each vehicle three subsystems,
including Controller, Sensors and Driver model, Sukthankar et al. [13] have
simulated every detailed movement of vehicles. By calculating the movement of
each agent based on finite state machine, Wan and Tang [11] have simulated a
traffic flow which comprises of autonomous agents/vehicles. Both systems use
3D graphics to display the simulation.
* Simulated Highways for Intelligent Vehicle System
This is a simulator developed by Rahul Sukthankar, Dean Pomerleau and
Charles Thorpe [13]. The name of this system is Simulated Highways for
Intelligent Vehicle Algorithms (SHIVA) and it is a microscopic traffic
simulation system due to the exquisite length of the highway in constrast with
the low density of traffic lights and houses. Usually, the speed of the vehicles
travelling on the highway are really high, it is the reason why this system focus
on calculation of the details of the vehicles to ensure the safety of the highway.
11
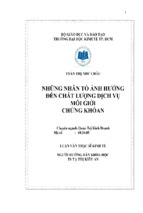
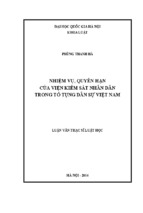
Figure 4. Highway simulation system
The system includes 2 models: Highway road model and transportation model.
Highway road model:
This model describes a net of highway road including many long roads
connected together. The basic element is called RoadSegment. The width of
these roads are varies, but they are always equal to a multiplier of a number
called “lanewidth”. Besides, they also include information about some narrowed
part called RoadSlice, the connector to connect different roads together and the
maximum velocity of the vehicles travelling on that Segment.
12
- Xem thêm -