Ecological Indicators 46 (2014) 201–213
Contents lists available at ScienceDirect
Ecological Indicators
journal homepage: www.elsevier.com/locate/ecolind
Wetland ecosystem service values and shrimp aquaculture
relationships in Can Gio, Vietnam
S. McDonough a, * ,1, W. Gallardo b , H. Berg c, N.V. Trai d , N.Q. Yen d
a
Aquaculture and Aquatic Resources Management, Asian Institute of Technology, Klong Luang, Pathumthani, 12120 Bangkok, Thailand
Department of Marine Science and Fisheries, College of Agricultural and Marine Sciences, Sultan Qaboos University, Oman
c
Department of Physical Geography & Quaternary Geology, Stockholm University, Sweden
d
Department of Fisheries Management and Development, Faculty of Fisheries, Nong Lam University, Linh Trung Ward, Thu Duc District, Ho Chi Minh City,
Viet Nam
b
A R T I C L E I N F O
A B S T R A C T
Article history:
Received 2 February 2014
Received in revised form 9 May 2014
Accepted 10 June 2014
Wetland valuation methods often apply monetary driven approaches that may undermine intrinsic
ecosystem values. Utilizing a stated preference method, the study identified and mapped local
stakeholder ecosystem service values between subsistence wetland and shrimp farmer groups in Can
Gio, Vietnam. Through focus group choice experiments, ecosystem services correlating to unique price
increments and cost/benefit tradeoffs between hypothetical intensive aquaculture developments and
mangrove conservation scenarios were investigated. Selection outcomes exhibited strong values for
ecosystem services maintained at the hypothetical natural state (core area pre-intervention 45%, postintervention 55%; buffer zone pre-intervention 65%, post-intervention 73%). Few respondents selected
the hypothetical intensive aquaculture development scenario (core area pre-intervention 18%,
post-intervention 9%; buffer zone pre-intervention 12%, post-intervention 5%), and instead, most
respondents avoided the costs and benefits of intensive aquaculture development in preference for
maintaining natural ecosystem services. Group deliberations drew out a higher sense of altruism and
responsiveness to intrinsic wetland values that superseded the potential economic gains of aquaculture
developments, whereby certain ecosystem services were deemed economically unassociable and
irreplaceable for both study groups. The qualitative results expose the difficulties in monetarily
measuring ecosystem services, highlighting the need to incorporate approaches that integrate the
intrinsic values attached to ecosystem services.
ã 2014 Elsevier Ltd. All rights reserved.
Keywords:
Mangroves
Ecosystem services
Environmental values
Aquaculture
Vietnam
1. Introduction
Ever since
(post Vietnam war economic reforms),
Vietnam’s wetlands have been, and are still subject to conversion
for monetary gains driven primarily by high export demands for
shrimp. Vietnam’s growing shrimp industry has raised environmental, economic and social attentions, and despite numerous
restoration projects, high mangrove losses as a result of aquaculture development have been reported (World Bank, 1999; World
Atlas of Mangroves, 2010). In 1976, Vietnam produced around
* Corresponding author at: Aquaculture and Aquatic Resources Management,
Asian Institute of Technology, Klong Luang, Pathumthani, Bangkok 12120, Thailand.
E-mail addresses:
[email protected] (S. McDonough),
[email protected] (W. Gallardo),
[email protected] (H. Berg),
[email protected] (N.V. Trai),
[email protected] (N.Q. Yen).
1
Permanent address: FAORAF, Gamel Abdul Nasser Road, P.O. Box 1628, Accra,
Ghana. Tel.: +233 505256401.
http://dx.doi.org/10.1016/j.ecolind.2014.06.012
1470-160X/ ã 2014 Elsevier Ltd. All rights reserved.
200,000 t of shrimp and in 2011, a significant production increased
with over 487,000 t covering over 290,000 ha of wetlands was
recorded on a national level (Wilder and Phuong, 2002; EJF, 2003;
FAO, 2011). Unregulated wetland conversion into shrimp farms
combined with detrimental aquaculture practices influences
natural habitat resiliency and its ability to deliver supporting,
regulating, provisioning and cultural ecosystem services defined
by the United Nation’s Millennium Ecosystem Assessment (MEA,
2005; TEEB, 2010) and exposes stakeholders to different natural
and socio-economic risks. The true long-term outcomes of shrimp
aquaculture development costs and benefits are not fully understood with shrimp aquaculture development potentially more
costly through its long-term externality costs (Primavera, 1997;
Ashton, 2007), than the preservation of wetlands and its delivery of
natural ecosystem services to local and regional communities,
directly and indirectly.
Shrimp aquaculture inputs and outputs are economically driven
and exploitative with little considerations to the long-term
202
S. McDonough et al. / Ecological Indicators 46 (2014) 201–213
negative environmental outcomes (Rosenberry, 1998; Páez-Osuna,
2001; EJF, 2003). However, the economic benefits of shrimp
aquaculture should not be disregarded as added capital can boost
the national economy, improve local livelihoods, and aid in rural
development (Frankic and Hershner, 2003; Gunawardena and
Rowan, 2005). Vietnam’s aquaculture is poised to intensify as
declared by Government Decision No. 21, 1998 and Government
Decision No. 67, 1999 (EJF, 2003), encouraging aquaculture
expansion at the private level, exposing mangrove wetlands to
future pressures. Wetland habitats should not be overlooked for a
single industry as they also support other sectors such as tourism,
fisheries and sustain rural livelihoods by providing provisioning
services such as plant and animal materials used for housing,
medicines, foods, and fuel (Rönnbäck, 1999). Unsustainable shrimp
developments combined with new challenges such as climate
change and hydropower developments (Hori, 1993; Bakker, 1999)
presents the ecosystem service concept as a tangible approach to
utilize in habitat valuation to better mainstream a more ‘risk-proof’
approach in policy development when managing land-altering
industries, such as aquaculture to be a more proactive industry
rather than its typical reactive manner.
Shrimp developments, particularly in Southern Vietnam is
often focus on intense production and are detrimental to the
delivery of ecosystem services (World Atlas of Mangroves, 2010).
Can Gio presented a unique location based on its close proximity to
Ho Chi Minh City and the UNESCO biosphere reserve to examine
the exchanges in conservation and development values. As the core
area is protected there is no imminent threat to the wetland, but
intensification and future expansion of shrimp farming activity
from buffer zone activity will have impacts on habitats.
Utilizing ecosystem services as the core component of the
choice experiment, the study identified and mapped what values
were placed on wetland ecosystem services in relation to natural
conservation and shrimp aquaculture developments in Can Gio’s
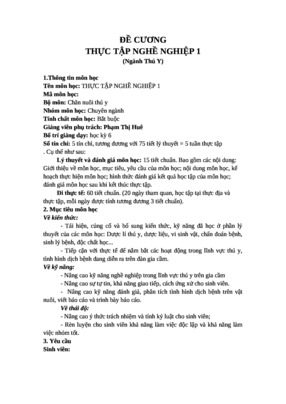
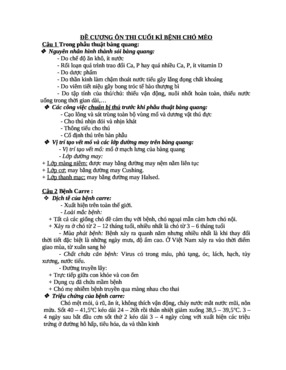
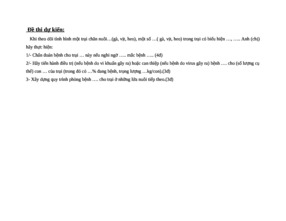
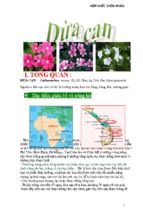
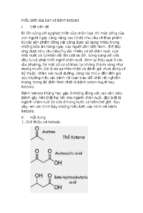
Fig. 1. Location of core area and buffer zones where focus group discussions were conducted. Shrimp farming is undertaken within buffer zones under the respective
districts. Core area focus groups were conducted in the central areas of Can Gio.
S. McDonough et al. / Ecological Indicators 46 (2014) 201–213
socio-economic and biophysical context. Choice experiment focus
groups were conducted in two respondent groups: subsistence
wetland users living inside the UNESCO biosphere reserve core
area and shrimp farmers along the reserve’s buffer zone. Focus
groups were utilized as a means for the respondents to discuss and
declare what ecosystem services they valued individually and as a
group under the different hypothetical scenarios presented. The
study objectives were to (1) identify the principal stakeholders
reliant on mangrove wetland ecosystem services, (2) identify what
ecosystem services are present, delivered, sustained, and utilized
by these wetland users, (3) identify if and how shrimp aquaculture
developments or wetland protection impact ecosystem service
delivery, (4) map the communal interactions and values placed on
mangrove ecosystem services in relation to wetland conservation
and aquaculture development drivers, and (5) assess what
influences trade-offs and degrees of willingness to accept price
increments between the different ecosystem service scenarios
amongst respondent groups.
2. Material and methods
2.1. Study area and groups
Rich in flora and fauna biodiversity, the UNESCO Can Gio
biosphere hosts over 21,000 ha of wetlands with 77 different
mangrove species (UNESCO, 2000). Can Gio’s proximity to Ho Chi
Minh City and shrimp farming activity around the buffer zones
make it an ideal location to examine the anthropogenic values and
its relationship to ecosystem services, shrimp aquaculture
development, and wetland conservation. Shrimp farming in Can
Gio occurs in the transitional buffer zones around the UNESCO
reserve where in 2012, four districts were recorded to regularly
conduct shrimp farming (Fig. 1). An Thoi Dong ward hosts around
695 operating shrimp farms; Binh Khah, 508; Ly Nhon, 243 and
Tam Thon Hiep, 68 shrimp farms; in total, Can Gio encompasses
around 1514 officially recorded operational shrimp farms (Can Gio
Annual Report, 2011). Key informants from the Can Gio Peoples’
Committee, the Can Gio Mangrove Protection Management Board
Park Authority, and Nong Lam University in Ho Chi Minh City
assisted in identifying respondent groups, providing logistic,
linguistic and personnel support in both core areas and buffer
Fig.
203
zones. Core area respondent groups who mainly live a subsistence
lifestyle within mangrove habitats were investigated to tease-out
what ecosystem services are valued in a more naturally unperturbed situation with minimal aquaculture developmental influences. Core area groups consisted of three stakeholders groups:
artisanal fishers, intertidal small-scale mollusc farmers, and park
rangers. Artisanal fishers comprised of individuals that lived on
boats, fishing Can Gio’s tributaries. Most mollusc farmers lived in
houses constructed on intertidal mudflats and cultured mollucs
species such as Crassostrea gigas, Anadara granosa, and Meretrix
lyrata inside the reserve’s core areas. Park rangers consisted of
rangers employed under the Can Gio Mangrove Protection
Management Board Park Authority and lived in posts situated
throughout Can Gio’s core areas. Differences between intensive
and extensive shrimp farming were not made as buffer zone
groups were randomly conducted. The total numbers of respondents within the core areas were lower in number due to time,
boating costs and personnel constraints. In total, 157 individuals
participated in the choice experiment, 42 questionnaires distributed with 10 focus groups consisting of 42 participants from the
core area (16 fisher folk, 8 mollusc farmers and 16 park rangers)
and 32 focus groups of 118 participants (mostly shrimp farmers) in
the buffer zones.
2.2. Research design
Stated preference methods have been applied throughout the
region to investigate wetland values in Do and Bennett (2005) and
Thuy (2006). In this study, a series of focus group discussion choice
experiments identified what ecosystem service utility values
existed between the two stakeholders and distinguished the
degree of communal willingness to accept price increments
between the costs/benefits of shrimp development and mangrove
conservation efforts. The stated preference technique, rather than
the revealed preference technique, was applied as it minimized
biases and allowed for the presentation of hypothetical scenarios,
enabling greater content flexibility and comparisons (Hanley and
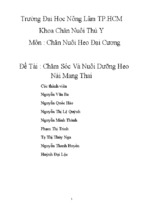
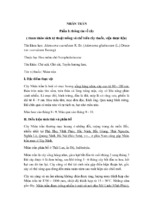
Spash, 2001) between the studied groups. Focus group choice
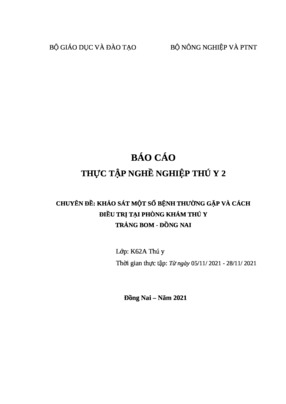
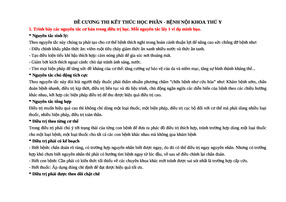
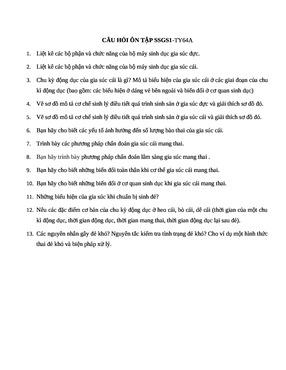
experiments (Fig. 2) began with a warm-up exercise whereby three
items related to wetland habitats (Nypa fructans seed nodule,
Pluchea indicus herbs and insect repellents) were presented to
2. Steps taken in the focus group activity to deliberate ecosystem service values in relation to shrimp aquaculture development and wetland protection.
204
S. McDonough et al. / Ecological Indicators 46 (2014) 201–213
stimulate group discussions on habitat alteration. Warm up
discussions did not contribute to the final datasets and lasted
around fifteen minutes with discussions taking place on item
usage, abundance and frequency of its access. Next, a specific
choice set was presented to the particular respondent group
beginning the deliberation process. After choices were selected
and discussed, the intervention exercise would be conducted to
further probe respondent ecosystem service values in relation to
shrimp aquaculture and wetland conservation. After the intervention exercise, the same choice set was presented to the same
respondents to once again deliberate and discuss the choice
selections, questioning the changes, if any were made. At the end, a
round up discussion was conducted debating and summarizing
what has been learned from the discussions. One of the most
important aspects of this approach was the empowerment of local
communities and the opportunity for the respondents to choose
the desired ecosystem service outcomes based on their experiences. The respondents’ opportunity to discuss the reasons behind
their choices made before (pre-intervention) and after (postintervention) the intervention exercise helped to elicit deeper
discussions on what communal values were placed on their habitat
(see Section 2.3).
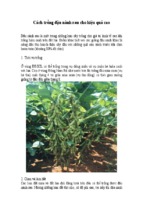
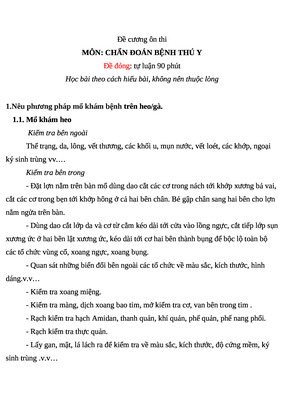
2.2.1. Ecosystem service scenarios and price increments
The stated preference technique required respondents to
determine their most preferred option from the three different
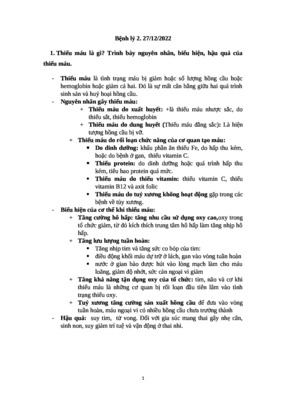
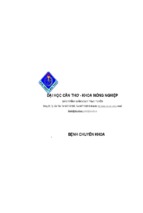
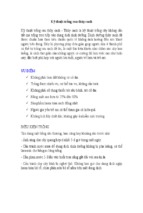
scenarios presented as ‘states’. These states characterized ecosystem
services delivered in bundles at different proportions (Fig. 3). The
natural state is representative of an unperturbed habitat with
minimal aquaculture developments due to higher conservation
efforts. The current state attempts to best represent the local
situation at that specific time for that specific site; a ‘middle ground’
that does not reflect intensive aquaculture development or strict
wetland protection. The alternative state reflects a landscape shaped
by human enterprise and engineering altered for aquaculture
production at higher intensities resulting in altered habitats for
economic outcomes. For the sake of the experiment, states were not
revealed during focus groups discussion until the later stages of the
task (during post-intervention choice selections), but were presented as price increments values, pre-intervention. Price increments were placed on each state with the aim to tease out ecosystem
service values in relation to monetary costs when the services are
faced with shrimp aquaculture development pressures or wetland
conservation pressures between the two study groups. Within these
hypothetical states different services and products would be
delivered, some at higher or lower rates and at different prices
depending on the state and the ecosystem service (see Section 2.3).
Fig.
Core area price increments were presented as a hypothetical
government wetland conservation plan whereby communities
paid an annual community tax. Prior to the choice experiment it
was revealed, through key informant interviews that a 7,000,000
VND yearly tax is placed on inhabitants living inside core areas and
this value was used as the current state median value between the
alterative and the natural state (Table 1). The alternative state
declares a hypothetical 25% increase in the communal tax is
required to manage shrimp farming impacts (e.g., clean up
schemes and personnel to regulate developments and practices)
placing core area alternative price increments at 8,750,000 VND
annually. The natural state declares that hypothetically higher
taxes are placed to maintain more stringent conservation efforts
(ranger fees, station construction, maintaining laws, and legislations) therefore price increments increases 50% (10,500,000 VND
annually) and as a result, natural ecosystem services are delivered
more efficiently. Buffer zone price increments were presented as
shrimp farming production costs such as feed, anti/probiotics,
electricity, labor, and other production expenses. The current state
assumes a median base where production costs are contextual to
the period of the study when discussing with key informants and
pilot study shrimp farmers where it was revealed that most Can
Gio farmers spent around 190,000,000 VND/crop. Based on this
figure shrimp farming price increments were presented as either a
marginal 25% or a 50% increase in production costs relative to the
specific respondent farmers. Consequently the current state was
presented as a “no change” in farming costs state, the alternative
state assumed that higher shrimp production outputs and inputs
resulted in higher costs (50% increase in production costs) with the
consequence of ecosystem services delivered at a degraded rate.
However, the benefit of higher production per cycle may result in
greater monetary profits were presented as a possible outcome.
The natural state presents lower production, but due to a lack of
infrastructure (electricity, roads, and feed outlets) the costs to
acquire the necessary farming products and services are hypothetically less accessible resulting in a 25% increase in overall costs.
It was stressed to participants that although these scenarios were
hypothetical, respondents should try to treat it as real life
outcomes. To help devise scenario parameters and gain an
understanding of the current situation, key informant interviews
with Can Gio People’s Committee and Park Authorities were
conducted before the actual focus groups. After the key informant
interviews, a preliminary field visit to study locations was
conducted to carry out two pilot studies, one each for core area
and buffer zone groups. The pilot study lasted two days and
enabled for the adjustment and improvement of the study
methods, helping refine the hypothetical states presented, tested
3. The three states and their ‘bundled’ efficiency conditions presented to the respondent groups.
S. McDonough et al. / Ecological Indicators 46 (2014) 201–213
205
Table 1
Price increment mechanism and effects under their unique states presented to respondent groups.
Price
increment
Core area
Natural
10,500,000 VND
annual tax
Mechanism Increased efforts
on wetland
conservation
projects outside
core area.
Effects
Increased delivery
of natural
ecosystem
services and
richer
biodiversity.
Decreased access
to market goods,
reduced local
infrastructure and
economy.
Buffer zone
Current
7,000,000 VND
annual tax
Alternative
8,750,000 VND annual
tax
Natural
25% increase in
production costs
No changes in
conservation efforts.
Core area
boundaries remain
the same.
Decreased efforts on
wetland protection
inside core area.
Private shrimp venture
compensate specific
costs.
Low infrastructure results in
higher prices, middleman
services, electricity costs,
price for fuel to access feed,
and seed.
Some ecosystem
services delivered
with moderate
access to markets
outside core area.
Decrease delivery of
natural ecosystem
services, area less
biodiverse with a
degraded natural
habitat.
Improved
infrastructure and
introduction of urban
market systems, better
access to market goods.
the initial demographic questionnaires, and scrutinizing the
ecosystem service parameters.
2.3. Choice experiment focus groups and choice grids
Focus groups discussion were conducted with mostly males,
not age specific, with a minimum of three to four individuals and
with discussions lasting one and a half hours. The initial task of
each focus group discussion was to obtain individual demographic
information (age, monthly salary, education, years of shrimp
farming/living in reserve areas, if they possessed radios/TVs, and if
they had any children). Discussions were recorded using an audio
recorder for all the respondent groups and later translated from
Vietnamese into English. Throughout the study, four different
choice sets were prepared and presented to four different groups
matching their context. One choice set for each study group was
presented and explained by the study facilitator. The choice grids
were fabricated from a plastic sheet with a grid drawn onto it with
picture cards used to convey ecosystem service parameters as
written text would exclude illiterate individuals, hold attentions
better and was easier for the facilitator to explain. Images were
placed on their respective position on the grid and coloured stones
were used to trace respondent choices, pre and post-intervention.
Four stones were given to each individual to place on the choice
grid where each individual had to choose once per row (ecosystem
services) and must consider the conditions of each of the three
columns (state/price increment) presented. To sum up, each
respondent had four choices out of a possible twelve; by avoiding
or selecting a certain choice, respondents indicated their ecosystem services values and the desired outcomes of their environment
and livelihood. The facilitator constantly reminded respondents to
consider price increments and their consequences throughout the
discussions, individually and as a group, promoting group
discussion on the topics raised and asking for explanations behind
the choices made and the choices not made.
After selections were made and the reasons behind the
selections discussed, the facilitator would then conduct the
intervention exercise aimed to stimulate respondents to discuss
comprehensively the potential impacts on ecosystem services
driven by aquaculture development or wetland conservation
efforts. To initiate the intervention exercise, the facilitator would
Current
No changes in
production costs
Shrimp farming
methods and
activity resume as
regular.
No changes in
shrimp farming
methods.
Increased delivery of natural Some ecosystem
ecosystem services, higher services delivered
biodiversity and natural
with moderate
heritage.
access to markets
Decreased access to market outside core area.
goods, reduced local
infrastructure and economy.
Alternative
50% increase in production costs
Increased production intensity
results in higher farming costs,
labour, medicines, electricity,
logistics, feed and seed costs are
the drivers.
Decrease delivery of natural
ecosystem services, less
biodiverse and degraded natural
habitat.
Improved infrastructure and
introduction of urban market
systems.
Improved livelihood for
successful farmers.
ask the respondents if they knew examples of how shrimp
aquaculture and conservation efforts alter landscapes and ecosystem services. If respondents were unable to provide examples and
discussion was lacking, the facilitator would present a set of
images, in random order, showcasing three negative (images of
degraded mangrove habitat, shrimps infected with hepatopancreatic parvovirus, and urban pollution) and three positive examples
(images of possible monetary profits, better access to services/
infrastructure and new opportunities for private enterprises) of
how shrimp aquaculture and mangrove conservation projects can
alter wetland habitats. Intervention discussions lasted around
forty minutes where afterwards (post-intervention) the same
choice grid was again presented to the same respondents for reselection with continued discussions on the reasons behind their
change or lack of change. To conclude a focus group discussion, a
round up session was conducted with respondents scrutinizing the
issues and implications associated with shrimp development or
wetland conservation on ecosystem services and their values
placed on its access with the frequency of topic mention tallied
during round up discussions. In addition to revealing the learning
outcomes, a comprehension rating was given when focus group
discussions terminated to rank the quality of respondent outcomes. This component is based on the respondent’s understanding of the choice grid, their selections, and the quality and amount
of respondent feedback during both intervention exercise and
round up discussions. Ratings ranged from 1 to 3; (1) being of
average quality discussion, (2) good quality discussion, and (3)
excellent quality discussion.
Buffer zone shrimp farmers were presented one grid and core
area respondents presented three choice grids for each respective
artisanal fishers, mollusc farmers, and park ranger groups. Four
constant parameters were presented throughout the study: direct
provisioning, indirect provisioning, regulating, and cultural
ecosystem services. Row one was presented as a direct
provisioning good related to the livelihoods of the specific
responding group; row two, as an indirect provisioning service;
row three, regulating/habitat ecosystem services that reflected
the ambient condition of the habitat such as water quality,
erosion control and pollination ability that resulted in an end
product; and row four, a cultural ecosystem service related to
wetland biodiversity and identity values. Table 2a explains the
206
S. McDonough et al. / Ecological Indicators 46 (2014) 201–213
Table 2a
Choice grid conditions in relation to state/price increments presented to core area respondents.
Artisanal fisherfolk
Natural(10,500,5000 VND annual tax)
Landings (kg/months) 450
Due to little human activity and strict
environmental regulations the habitat is able to
deliver higher fish biomass increasing landings.
6
Aquatic Biodiversity
(no. of species)
Protected habitat richer in biodiversity with
higher trophic organisms of greater market
value (e.g. Pisodonophis boro and Lates calcarifer).
Forest material
delivery/access
(honey, medicines,
game/fruits) (min.
by boat)
Firefly sighting
(monthly duration)
15
Time to encounter goods is shorter due to low
development and conservation efforts.
(Conditions are more efficient in maintaining
services such as pollination, primary production,
water purification).
6
Sightings are more frequent and lasts,
hypothetically, two more months due to the
improved environmental conditions and better
conservation efforts.
Current (7,000,000 VND annual tax)
Alternative (8,750,000 VND annual tax)
300
150
Established after key informant interviews. Due to intensive aquaculture activity there is a
lower biomass, decreasing landings.
4
Aquatic biodiversity is not exceptionally
rich with particularly high market value
organisms (organisms such as Mugil
cephalusand certain gastropods).
30
A hypothetical median time between the
natural and alternative state.
2
Intensive aquaculture activity has resulted in
environmental degradation and cannot support
higher trophic organisms. Only certain
gastropods and molluscs of low market value are
present.
45
Due to intensive aquaculture activity, regulating
processes are impeded and the habitats ability
to maintain and provide goods are degraded,
resulting in longer encounter times.
4
2
Established after key informant interviews. Due to loss of mangroves as a result of intensive
aquaculture, the surrounding environment
cannot support large firefly populations and
sightings are reduced.
Mollusc farmers
Natural (10,500,5000 VND annual tax)
Current (7,000,000 VND annual tax)
Alternative (8,750,000 VND annual tax)
Harvest Frequency
(months)
6
Harvest frequency is higher due to improved
ambient conditions (water quality, suitable
nutrient levels) and the crop is hypothetically
larger in size.
4
Established after key informant interviews
where most farmers harvest four times per
crop cycle.
Aquatic biodiversity
(no. of species)
6
Protected habitat richer in biodiversity with
higher trophic organisms of greater market
value (e.g. Pisodonophis boro and Lates calcarifer).
4
Aquatic biodiversity is not exceptionally
rich with particularly high market value
organisms (organisms such as Mugil
cephalusand certain gastropods).
Forest material
delivery/access
(honey, medicines,
game/fruits) (min.
by boat)
15
Time to encounter goods is shorter due to low
development and conservation efforts.
(Conditions are more efficient in maintaining
services such as pollination, primary production,
water purification).
6
Sightings are more frequent and lasts,
hypothetically, two more months due to the
improved environmental conditions and better
conservation efforts.
30
A hypothetical median time between the
natural and alternative state.
2
Harvest frequency is lower due to degraded
ambient conditions (water quality, suitable
nutrient levels) as a result of intensive
aquaculture. Crop is also hypothetically smaller
in size.
2
Intensive aquaculture activity has resulted in
environmental degradation and cannot support
higher trophic organisms. Only certain
gastropods and molluscs of low market value are
present.
45
Due to intensive aquaculture activity, regulating
processes are impeded and the habitats ability
to maintain and provide goods are degraded,
resulting in longer encounter times.
Firefly sighting
(monthly duration)
4
2
Established after key informant interviews. Due to loss of mangroves as a result of intensive
aquaculture, the surrounding environment
cannot support large firefly populations and
sightings are reduced.
Park rangers
Natural (10,500,5000 VND annual tax)
Aquatic
biodiversity
(no. of
species)
Ecotourism
(visitor
types)
Costal Erosion
(level of
management
urgency)
Firefly sighting
(monthly
duration)
Current (7,000,000 VND annual tax)
Alternative (8,750,000 VND annual tax)
2
Intensive aquaculture activity has resulted in
environmental degradation and cannot support
higher trophic organisms. Only certain
gastropods and molluscs of low market value are
present.
Local and foreign
Local
Minimal
Intensive aquaculture has impacted the area
Due to improved conservation and awareness efforts, Hypothetical scenario where only local
the biosphere attracts significant local and foreign
nearby tourists (namely Ho Chi Minh City) whereby almost no tourists visit the Can Gio
tourists. More activities result in higher revenues.
visit Can Gio mostly over the weekend.
biosphere for recreational purposes.
Low
Moderate
High
Conservation efforts has resulted in increased
Erosion is not an issue of priority due to
Due to intensive aquaculture and mangrove
mangrove cover and density, subsequently making
insignificant impact. Business resumes as
conversion erosion and land loss is displacing
coastal erosion a ‘no issue’ for park authorities.
usual for park authorities.
local population and is an issue of importance for
park authorities.
6
4
2
Sightings are more frequent and lasts, hypothetically, Established after key informant interviews. Due to loss of mangroves as a result of intensive
two more months due to the improved environmental
aquaculture, the surrounding environment
conditions and better conservation efforts.
cannot support large firefly populations and
sightings are reduced.
6
Protected habitat richer in biodiversity with higher
trophic organisms of greater market value (e.g.
Pisodonophis boro and Lates calcarifer).
4
Aquatic biodiversity is not exceptionally
rich with particularly high market value
organisms (organisms such as Mugil
cephalusand certain gastropods).
S. McDonough et al. / Ecological Indicators 46 (2014) 201–213
207
Table 2b
Choice grid conditions in relation to state/price increments presented to buffer zone respondents.
Shrimp farmers
Natural (25% increase in production costs)
Stocking Density (post
larvae/m2)
Aquatic biodiversity
(no. of species)
Disease outbreak (stock
mortality and product
application)
Firefly sighting (monthly
duration)
2
60/m
Farmers stock at lower densities with most
larvae growing to greater lengths, resulting in
potential higher profits but with the
consequence of lower production output per
farm cycle.
6
Protected habitat richer in biodiversity with
higher trophic organisms of greater market
value (e.g. Pisodonophis boro and Lates
calcarifer).
20%
When an outbreak occurs the surrounding
water quality is appropriate to mitigate
pathogen outbreak. Farmers mitigate crop
mortality by recovering the infected crop,
exchanging water from adjacent canals and
naturally treating the infected stock, loosing
20% of the infected crop with minimal product
application.
6
Sightings are more frequent and lasts,
hypothetically, two more months due to the
improved environmental conditions and
better conservation efforts.
Current (No change in production costs)
2
Alternative (50% increase in production costs)
100/m
Established after key informant
interviews.
140/m2
Farmers stock at higher densities where larvae
will be smaller in size, but due to higher
stocking densities, profits may be higher
greater due to high production.
4
Aquatic biodiversity is not exceptionally
rich with particularly high market value
organisms (organisms such as Mugil
cephalusand certain gastropods).
2
Intensive aquaculture activity has resulted in
environmental degradation and cannot
support higher trophic organisms. Only
certain gastropods and molluscs of low market
value are present.
90%
When an outbreak occurs the ambient water
quality is poor due to the intensive shrimp
aquaculture activity and most of the infected
stock will not survive despite the high use of
treatment products.
50%
When an outbreak occurs during a crop
cycle, the farmer will lose 50% of the
infected crop after treating it with
medium product applications.
4
Established after key informant
interviews.
three choice grids and its respective conditions presented to core
area respondents and Table 2b the choice grid presented to buffer
zone participants.
2.4. Choice selection analysis
Relationships between respondent choice selection outcomes
were tested with a Fisher’s exact test for each study area dataset. The
chi-square test was not utilized as certain proxy selections had values
below five (Upton, 1992). The Fisher’s exact tests determined the
strength of the relationship between the different ecosystem service
selections under their categorical variable; in this case the price
increment/state and its degree of significance. In addition to
determining the strength of a choice’s influence on a specific
dataset, Pearson’s residuals were calculated. Pearson’s residuals
indicate the difference between the observed and fitted values, over
the estimated value of the standard deviation of the observed values.
When residuals are greater than two in absolute value, the ecosystem
service selection has had a significant influence on the final p-value
and the overall distribution of the dataset. These relationships are
visually represented by mosaic charts (Hartigan and Kleiner, 1981)
along with Pearson’s residual distribution proportions showing the
degree of significance of each ecosystem service selection. Along
with rectangle sizes, color shades are utilized to represent Pearson’s
residual derivatives and the ecosystem service’ level of significance
on choice distributions. Grey indicates no significance. White
specifies cross-classifications that occurred more often than the
expected value, positively influencing distributions; black indicates
cross-classification that occurred less than the expected value,
negatively influencing data distribution. All the mentioned tests
were conducted with the R 2.14.2 statistical package software.
3. Results
3.1. Ecosystem service values
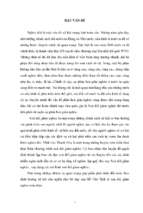
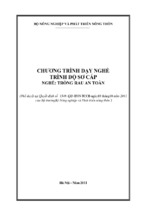
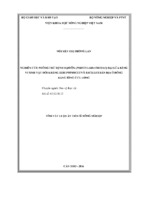
Total ecosystem service values for natural, current and alternative
states at pre- and post-intervention are visually represented as
2
Due to loss of mangroves as a result of
intensive aquaculture, the surrounding
environment cannot support large firefly
populations and sightings are reduced.
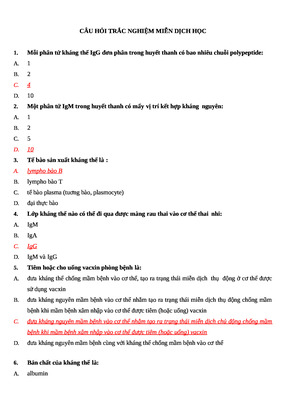
percentage proportions in radar plots (Fig. 4). Specific core area
selections revealed greater values placed on ecosystem services
delivered atthe natural aswell asthe currentstate.Bufferzone groups
made similar selections with strong initial preferences for ecosystem
services delivered at the natural state and the current state.
Significantly, price increments at both a 25% and a 50% increase
became insignificant factors of consideration in both study groups
during pre-intervention choice selection and even more so, postintervention. Core area preference distributions displayed strong
valuesforecosystem services maintained at a natural state underpre(45%) and post- (56%) intervention deliberations. Preferences for
ecosystem services maintained under the presented current state
conditions revealed veryslight changesinpre-intervention (36%) and
post-intervention (35%) selection. Few core area selections were
made for ecosystem services maintained under the alternative state
with pre-interventionpreferences low (18%) and a decrease observed
for post-intervention selections (9%). However, a small proportion
(9%) of the alternative state selections still endured post-intervention, indicating that particular core area respondents desired some
form of aquaculture development benefits despite being aware of the
risk of natural ecosystem service loss/replacement.
Specific buffer zone focus groups selections revealed strong
preferences, pre-intervention (66%) for ecosystem services delivered at the natural state with an increase (74%) in preferences,
post-intervention. Values were placed for ecosystems services to
be delivered at the current state (22%), pre-intervention with a
slight decrease (21%), post-intervention. Very little value was
expressed for ecosystem services delivered at the alternative state
(12%) pre-intervention, with an observed decrease (6%) for postintervention selections. Significant values were placed on the
buffer zone specific regulating ecosystem service of water quality
maintenance where no selections were made under the alternative
state, pre- and post-intervention, despite being aware of the
potential costs and benefits. The indirect provisioning service of
aquatic biodiversity was also highly valued by Can Gio shrimp
farmers (73%) for its delivery under the natural state, preintervention. Direct provisioning selections on stocking density
revealed that Can Gio shrimp farmers preferred stocking densities
208
S. McDonough et al. / Ecological Indicators 46 (2014) 201–213
Fig.
4. Radar plot of total preference percentage distribution, pre- (full line) and post-intervention (dashed line) for core area and buffer zone groups.
at lower numbers, pre-intervention, where a difference of 12% is
exhibited from the alternative or current state to the natural state,
post-intervention. In both study groups, cultural service selections
were more varied between the three presented states indicating
the anecdotal manner attached to this proxy of firefly sightings.
Post-intervention values revealed that 55% of the respondent
shrimp farmers preferred cultural ecosystem services at the
natural state and 31% preferred it at the current state. Interestingly,
a small proportion of shrimp farmers still declared slight
preferences for ecosystem services at the alternative state, postintervention, particularly for the direct provisioning service
(stocking density) and cultural service (firefly sighting) proxies.
3.2. Mosaic plot
Mosaic plots display choice selection influences on the final
selected outcome distributions (Fig. 5). Core area pre-intervention choice selections are statistically different (p < 0.05),
whereas post-intervention choice selections were not
(p > 0.05). Core area post-intervention selection tests reveal little
changes in Pearson’s residuals that significantly impacted choice
distributions and although core area post-intervention selections
shifted more towards the natural state, mosaic distributions
reveal little proportional statistical changes occurring postintervention. For core area respondents the indirect provisioning
service (aquatic biodiversity) positively influences choice distributions under the natural state (x2 = 2.06) and under the
alternative state negatively influences final distributions
(x2 = 2.06). Other core area residuals did not have significant
consequences on the final distribution. Interestingly, cultural
service residuals were more equal in distributions throughout
the three states, where the alternative residual positively
influenced choice distributions, pre-intervention (x2 = 1.88).
Based on the pre-intervention residuals, combined with group
debate outcomes, core area aversion for aquatic biodiversity to
be maintained at the alternative state and respondent high
preferences under a natural state significantly influenced final
core area ecosystem service values, potentially overriding
respondent desires of gaining potential aquaculture development benefits. Buffer zone pre- and post-intervention choice
selections were significantly related (p < 0.05) where the
regulating ecosystem service (water quality maintenance)
significantly influenced final choice distributions positively at
the natural state (x2 = 3.57) and negatively at the current state
(x2 = 3.36) and the alternative state (x2 = 3.77). Residuals for the
indirect provisioning ecosystem service (aquatic biodiversity)
observed no significant statistical influences as heavy preference
was initially declared for it at a natural state with little changes,
post-intervention. A significant observation is the higher
preference for the indirect provisioning service of aquatic
biodiversity residual under the alternative state becoming a
negative value (x2 = 2.15) after the intervention exercise. The
direct provisioning service presented (stocking density) observed
positive values under the current state (x2 = 2.68) revealing that
Can Gio shrimp farmers are content to farm at current densities
despite being presented with the opportunities to change
stocking density and culture methods. Cultural ecosystem
service value residuals (x2 = 2.89) under the natural state
negatively influenced final distributions, whereas alternative
residuals (x2 = 4.70) positively shaped final distributions. Cultural
service distributions observed changes as shifts in values
occurred from a current and alternative state to its improved
delivery at the natural state.
3.3. Round up discussion outcomes
Issues debated in the round up discussions were compiled into
frequency percentages to obtain an overview on topical ecosystem
service values discussed in both groups (Fig. 6). All core area groups
discussed how unregulated shrimp aquaculture could negatively
impact wetland habitats with some respondents also cautious of
the outcomes of excessively conserving natural areas and its
implications on their livelihoods (70%). The regulating ecosystem
service of storm/erosion mitigation was a constant theme for most
core area focus groups (70%) with less common issues such as how
current natural resources do not provide enough for subsistence
(20%) and that management efforts require stronger managerial
implementation (20%) were debated in core area focus groups.
Buffer zone focus groups discussed issues related to how shrimp
farming activity can alter ecosystem service delivery and also
revealed that historical experiences with shrimp farming, in
particular, negative experiences with shrimp disease outbreaks
have influenced shrimp farmers to value ecosystem services
delivered at the natural state more. Significantly, most shrimp
farmers highlighted that the value of living in Can Gio is
characterized by the clean and natural area (81%); that rapid
and heavy urbanization is something the community would like to
avoid. Most shrimp farmers agreed on the negative impacts of
S. McDonough et al. / Ecological Indicators 46 (2014) 201–213
209
Fig. 5. Pre- and post-intervention core area and buffer zone mosaic plots of respondent ecosystem service choice selections. The Y variable is indicative of the ecosystem
service conditions in relation to the X variable of state/price increment parameters. Rectangle proportions represent the choices selected. Rectangle heights are fixed. Lengths
were subject to unique respondent choices. A significant observation of the mosaic plot is that buffer zone regulating/habitat ecosystem service values are conditionally
dependent on the natural state price increment/conditions with a higher probability of preferences to be selected under the presented natural state.
Fig.
6. Discussion frequencies of key topics during round up discussion in core area (n = 10) and buffer zone groups (n = 32).
210
S. McDonough et al. / Ecological Indicators 46 (2014) 201–213
Fig. 7. (a) Cross cutting themes discussed by both study groups and its degree of importance (1 = highest; 5 = lowest). (b) Total frequency of discussion topic distribution
percentages based on comprehension ratings and type of study group.
intensive shrimp aquaculture but also stressed how it has helped to
improve the local economy (70%). Farmer groups also declared that
aquaculture is necessary for an area like Can Gio to develop and
improve community livelihoods through access to modern day
services and facilities (41%).
Common topics debated by both study groups revealed and
compared what were the most pressing collective issues (1 = highest order; 5 = lowest order) (Fig. 7a). Core area respondents were
most concerned about the potential negative impacts of intensive
shrimp farming and how it can influence their livelihoods, whereas
shrimp farmers did not express as much concern. Interestingly,
both groups highlighted the importance of storm/erosion protection and the presence of mangrove forests in delivering this
service, often referring to a series of heavy storms in 2007,
describing how mangrove forests helped mitigate damage in areas
with higher mangrove cover and how other areas, with less
mangrove cover suffered greater damage. Based on
comprehension ratings, the five cross cutting issues were
mentioned and discussed more often for both study groups when
comprehension ratings had good or average quality (Fig. 7b). When
comprehension ratings were of good or average quality, discussion
topic frequency decreased and debate quality on ecosystem
services in relation to shrimp aquaculture and wetland conservation were not deliberated in greater detail.
4. Discussion
4.1. Ecosystem service value determinants and its methodological
consequences
Natural wetland ecosystem services were highly valued and
although both groups had different sets of initial values attached to
wetland protection and shrimp aquaculture outcomes, intrinsic
ecosystem services were declared irreplaceable. These included
S. McDonough et al. / Ecological Indicators 46 (2014) 201–213
services such as aquatic biodiversity wildlife for communal
subsistence, storm/erosion protection and air/water quality
control. Study results revealed that ecosystem service values stem
from a user specific context with a final ecosystem service product.
These values often undergo personal extrapolation based on
several factors; for example, buffer zone respondents valued water
quality and aquatic biodiversity higher than core area respondents.
Study outcomes further suggest that ecosystem service values
attached to ecosystem services are pre-determined by (1) the
presence of natural landscapes, (2) the user specific historical
attachments to ecosystem service end products, and (3) current
access and interaction modes with ecosystem service functions.
The three outcomes that highlight fixed values are: core and buffer
zone high initial preferences for the aquatic biodiversity indirect
provisioning service under the natural state; shrimp farmer strong
initial preferences to the water quality regulating ecosystem
service under the natural state, and park ranger selections of ecotourism and storm/erosion protection services delivered at the
natural state. This predisposition to prefer certain ecosystem
services influence how users value natural habitats and is the
major difficulty in accurate and holistic contingent valuation
methods (Pearce et al., 2006; Schägner et al., 2013). Historical
experiences also played an important role in ecosystem service
value formulation. In the study shrimp farmer respondents
discussed the negative impacts of past necrotizing hepatopancreatitis outbreaks on production and these negative historical
experiences, combined with the high-risk modis operandi associated with intensive shrimp farming may well have fixed buffer
zone regulating ecosystem service values, explaining their explicit
preferences for ecosystem services delivered under the presented
natural state.
Norton et al. (1998) and Costanza (2000) discuss how
ecosystem service values become fixed and pre-formed at the
local level on an efficiency value basis. The study results also
suggest that user interaction modes with ecosystem service
functions and eventually ecosystem service end products are
determined on an efficiency basis. This factor transpired during
group deliberations and is also documented in other ecosystem
service valuation studies (Spash and Hanley, 1995; Nunes and van
den Bergh, 2001; Hein et al., 2006; Kenter et al., 2011). By
attempting to incorporate contrasting ecological and economic
drivers with distinct habitat outcomes, the method has consequently drawn out the complexities that occur when attaching
monetary values to ecosystem services in a multi functional
landscape (Do and Bennett, 2005; Kenter et al., 2011. Therefore, it is
important to disaggregate user specific connections to ecosystem
service functions and the end product/goods; where the users will
begin to attach values. This distinction would be an improvement
in holistically assessing habitat value for indirect and direct use
and non-use services (Barkmann et al., 2008). Further, oversighting between ecosystem service functions and products can be
made more complex when respondents perceived threats to an
intrinsic ecosystem services, i.e., intensive shrimp farming
degrading water quality. Once threats are triggered it becomes
increasingly difficult to associate ecosystem services to a practical
monetary value whereby certain regulating and supporting
products become un-substitutable as it constitutes the users
perception of a pristine habitat (Hall et al., 1992; Carson and
Mitchell, 1993). This factored with the importance of spatial and
historic interactions raises further issues on contingent valuation
methods, especially for regulating and supporting ecosystem
services who’s functions tend to be more readily associated
intrinsically to end products such as water/air quality maintenance
(Hein et al., 2006; Simões d et al., 2008).
When natural habitats and human social contexts and
determinants are variable, significant influences on valuation
211
accuracies may occur (Nelson and Daily, 2010; Schägner et al.,
2013; Ellis and Bell, 2013). In monetary valuation studies, natural
value is defined as the human worth attached to accessing and
utilising natural resources (Hargrove, 1992; Turner, 2000) and
essentially, the stronger the values declared for an ecosystem
service, it becomes less realistic to associate the service with a
monetary price, especially when the ecosystem service is
communally deliberated. Costanza (2000), Moons et al. (2008),
and Schägner et al. (2013) support this contextual significance
whereby efficiency values, rarity of the presented ecosystem
service, or if certain ecosystem services have been lost or replaced
will determine how users perceive its worth.
Industrialised shrimp farms were not observed in the study
location as all respondent farms were family owned. However,
shrimp farming in southern parts of Vietnam (Ca Mau, Bac Lieu,
and Soc Trang), large private companies operate intensive shrimp
farming clusters (World Atlas of Mangroves, 2010). The extent of
industrialised companies operating may have uniquely moulded
ecosystem service values for different communities. Based on
factors such as production efficiency, environmental awareness,
social corporate responsibilities and general management coupled
with socio-economic and biophysical components, the involvement of industrialised companies would alter community ecosystem service values and essentially attitudes on conservation and
development. Ecosystem service provides an approach to holistically manage human landscapes but is limited to large geographic
areas and long time scales. It is therefore equally important to
select the most appropriate methods to identify and assess a
communities’ degree of initial connection and relationship with an
industry.
Both respondent group outcomes support individual utility
maximization (Norton et al., 1998; Costanza, 2000). This initial
utility value stems from the personal desire to gain the most out of
a natural habitat that is translatable into a monetary number, with
minimal impact to local ecosystem service bundles. Ekins and
Max-Neef (1992) and Farber et al. (2002) suggest that some
ecosystem service values and the human interactions are
‘purchasable’ but also declare that certain human needs may
not be satisfied through capital, as individuals simply may not
consider its loss/replacement as worthy beyond a capital value.
Capital was a minor influencing factor and despite being constantly
reminded to consider price increments, it seldom affected
respondent choices and became less significant, post-intervention,
in shaping respondent ecosystem service values. This lack of
observed consideration to price increments in both study groups
support how intrinsic values will supersede the monetary
connections to natural ecosystem services where marginal price
increments seemingly acted to stimulate the respondents to
readily declare a strong willingness to accept payments for storm
protection and water quality ecosystem services (Chee, 2004;
McCauley, 2006). However, deliberative approaches go some way
to override inaccuracy issues associated with monetary ecosystem
service valuations and its typology (Turner et al., 2003; Kumar and
Kumar, 2008) but are more subject to double counting inaccuracies
based on its lexicographic manner (Fu et al., 2011).
4.2. Deliberation impacts on community ecosystem service values and
learning outcomes
Respondents debated on ecosystem service functions and many
participants were able to declare final products such as the
provisioning of shrimp larvae, clean water to culture bivalves, and
the sedimentation process as key indicators (Sasikumar and
Krishnakumar, 2011) but were unable to expand on how ecosystem
services help deliver products and how they are potentially
impacted by shrimp aquaculture and wetland conservation.
212
S. McDonough et al. / Ecological Indicators 46 (2014) 201–213
Respondent reception to intensive farming and conservation were
transformed after the intervention exercise, highlighting the
importance of awareness, education and deliberation in influencing ecosystem service values at the local level, particularly in
groups (Wilson and Howarth, 2002). After the intervention
exercise, participants better understood how aquaculture and
wetland conservation outcomes influence ecosystem service
functions with most respondents agreeing that aquaculture
development was essentially a means to install a market
mechanism, potentially leading to short-term infrastructure and
employment improvements. With deliberation influencing final
respondent choice outcomes, it is important that valuation
methods are conducted through communal deliberative
approaches of ecosystem service functions for its improved
mainstreaming into wetland management. This will help achieve
more equitable and less environmentally detrimental industries by
addressing local values from the ground up (Heal et al., 2001;
Armsworth et al., 2007).
Intervention and deliberation outcomes for both study groups
drew out a stronger sense of altruism that prevailed over economic
gains to preserve communal ecosystem services functions, specifically supporting and regulating ecosystem services delivered under
the natural state (Sayer and Campbell 2004; Cowling et al., 2008).
Locally expressed as
, this connection with natural functions
and human communities eventually became more valuable than
short-term economic gains when presented with the potential loss/
replacement of ecosystem services which development ventures
impact (Sagoff,1998; Wilson and Howarth, 2002; Kumar and Kumar,
2008). Farber et al. (2002) emphasized that some ecosystem service
functions are so isolated from human economic relation that they
become irrelevant and only the intrinsic connection remain, holding
only indirect values in a market economy. Ecosystem services are
delivered in bundles and their indirect values should not be
overlooked as they often resurface when deliberated, sometimes
with unlimited worth, especially when they are perceived to be
under threat or lost at the communal local level.
These vast range of unique learning outcomes discussed by the
respondent groups underlines the importance of a participatory
approach when mapping ecosystem service values (Reed, 2008).
However, it also raises further methodological issues for its
applications in economically valuing multifunctional areas to a
practical estimate, especially with the existing linkage gaps
between ecosystem services, biodiversity and land use (Chan
et al., 2006), particularly in rural areas. Asides from Cardinale
(2011); the direct roles of biodiversity in ecosystem service
resilience, societal value and ecosystem service functionality is
poorly understood and integrated. In addition, tipping points and
social threshold perceptions of when landscapes shift into a less
desired state as a consequence of human actions and its level of
acceptance by local communities is another research dimension
gap (Schägner et al., 2013). This study attempted to address this
through the use of ecosystem services, price increments and
deliberative scenario outcomes but have revealed that these
elements are perplexed when different stakeholders, histories, and
spatial scales are encompassed (Diamond and Hausman, 1994;
Hanemann, 1994).
Furthermore, the importance of habitat stewardship in
influencing final choice selection should be quantified. Both user
groups claimed that other more detrimental players such as
upstream industries, shipping, and destructive fishing techniques
are the significant stressors impacting Can Gio’s natural habitat.
Many buffer zone respondents strongly believed that upstream
industries, not shrimp farming are the main drivers influencing
biodiversity and ecosystem service capacities to deliver goods/
services under a natural state. This stems from discussion
outcomes with shrimp farmers whereby many collect mud crab
(Scylla serrata) and many declared that catch biomass, crab sizes,
and catch frequency have decreased over the past five years.
Another example stated by park rangers discussed how heavy
shipping routes, not aquaculture, is greatly accelerating land
erosion in Can Gio. Buffer zone respondents frequently discussed
land ownership issues and declared that much of the actual land/
farm owners are not Can Gio locals and tend to be more business
orientated, paying less attention to the consequences of their
actions/inactions. These examples highlight the how stewardship
can also influence and shape the basis of the users connection to
ecosystem service worth (Farber et al., 2002).
Conclusion
Traditional valuation methods attempt to place monetary
figures on use values, possibly overlooking non-use values that
may be of equal or even greater worth to local communities
(Hampicke, 1999; Kenter et al., 2011). The study pinpoints the
methodological issues associated with ecosystem service deliberations and how intrinsic values take shape through group
discussion. Both core and buffer zone groups strongly valued
ecosystem services delivered at the natural state, where certain
stakeholders declared high values for regulating, supporting and
provisioning ecosystem services such as aquatic biodiversity,
ambient conditions to mitigate shrimp disease outbreaks, erosion/
storm protection and deliverer of clean air/water; cultural values
were more anecdotal. Focus group discussions revealed that price
increments are issues of insignificance prior the intervention
exercise and even more so, post-intervention; that certain intrinsic
ecosystem services become extremely difficult to associate with a
monetary number influenced by a landscape's unique socioeconomic and biophysical historical dimensions which are often
robust and pre-formed.
The lexicographic manner of landscape valuation should not
render our attempts to monetarily value habitats. Application of
ecosystem services in economic valuation methods will result in a
more rounded approach to habitat management in light of
different social and economic drivers and clarify why respondents
might sacrifice or protect biodiversity ecosystem services. The
future need to better incorporate the role of ecosystem service
functions and biodiversity in valuation methods is required to
address the uncertainties in landscape valuation with communal
deliberation and discussion an integral part of the process.
Acknowledgments
The authors would like to thank the Royal Thai Government and
the Swedish International Development Cooperation Agency
(Sida) for funding the study and fieldwork. Gratitude is also
expressed to the Can Gio Park Management Authorities and the
Can Gio’s People’s Committee for logistic and personnel assistance.
References
Armsworth, P.R., Chan, K.M.A., Dailey, G.C., Ehrlich, P.R., Kremen, C., Ricketts, T.H.,
Sanjaya, M.A., 2007. Ecosystem service science and the way forward for
conservation. Conser. Biol. 21 (6), 1383–1384.
Ashton, E.C., 2007. The Impact of shrimp farming on mangrove ecosystems, CAB
reviews: perspectives in agriculture, veterinary science. Nutr. Nat. Res. 3 (003) .
Bakker, K., 1999. The politics of hydropower: developing the Mekong. Polit. Geogr.
18, 209–232.
Barkmann, J., Glenk, K., Keil, A., Leemhuis, C., Dietrich, N., Gerold, G., Marggraf, R.,
2008. Confronting unfamiliarity with ecosystem functions: the case for and
ecosystem service approach to environmental valuation with stated preference
methods. Ecol. Econ. 65 (1), 48–62.
Can Gio Annual Report, Annual shrimp production figures in Can Gio districts. Can
Gio’s Peoples Committee Report Bin Kahn. 2011; [In Vietnamese].
Cardinale, B.J., 2011. Biodiversity improves water quality through niche partitioning.
Nature 472, 86–89.
S. McDonough et al. / Ecological Indicators 46 (2014) 201–213
Carson,R.T.,Mitchell,R.C.,1993. The Value ofcleanwater: the public’s willingnessto pay
for boatable, fishable and swimmable water. Water Resour. Res. 29 (7),1454–2445.
Chan, K.M.A., Shaw, M.R., Cameron, D.R., Underwood, E.C., Daily, G.C., 2006.
Conservation planning for ecosystem services. PLoS Biol. 4 (11), 379.
Chee, Y.E., 2004. An ecological perspective on the valuation of ecosystem services.
Biol. Conserv. 120, 549–565.
Costanza, R., 2000. Social goals and the valuation of ecosystem services. Ecosystems
3, 4–10.
Cowling, R.M., Egoh, B., Knight, A.T., O'Farrell, P.J., Reyers, B., Rouget, M., Roux, D.
J., Welz, A., Wilhelm-Rechman, A., 2008. An operational model for
mainstreaming ecosystem services for implementation. Proc. Nat. Acad.
Sci. 105 (28), 9483–9488.
Diamond, P.A., Hausman, J.A., 1994. Contingent valuation: is some number better
than no number? J. Econ. Perspect. 8 (No. 4), 45–64.
Do, T.N., Bennett, J.,2005.Economic valuation ofwetlandsinVietnam’s MekongDelta:a
case study of direct use values in Ca Mau province. Occasional Paper, Environment
Management and Development Program. APSEG ANU, Canberra, Australia.
EJF, 2003. Risky Business: Vietnamese Shrimp Aquaculture – Impacts and
Improvements. Environmental Justice Foundation, London, UK.
Ekins, P., Max-Neef, M., 1992. Real Life Economics. Routledge, London.
Ellis, W.L., Bell, S.S., 2013. Intertidal fish communities may make poor indicators of
environmental quality: lessons from a study of mangrove habitat modification.
Ecol. Indic. 24, 421–430.
FAO, 2011. FishStatJ (Version 2.0.0) Vietnam giant tiger prawn and white leg shrimp
aquaculture production quantitates 1950-2011. FAO Fisheries department,
fishery information, data and statistic unit. FAO fisheries and aquaculture
department, Rome.
Farber, S.C., Costanza, R., Wilson, M.A., 2002. Special Issue: The dynamics and value
of ecosystem services: integrating economic and ecological perspectives.
Economic and ecological concepts for valuating ecosystem services. Ecol. Econ.
41, 375–392.
Frankic, A., Hershner, C., 2003. Sustainable aquaculture: developing the promise of
aquaculture. Aquac. Int. 11, 517–530.
Fu, B.-J., Su, C.-H., Wei, Y.-P., Lü, Y.-H., 2011. Double counting in ecosystem services
valuation: causes and countermeasures. Ecol. Res. 26 (1), 1–14.
Gunawardena, M., Rowan, J.S., 2005. Economic valuation of a mangrove ecosystem
threatened by shrimp aquaculture in Sri Lanka. Environ. Manage. 36 (4), 535–550.
Hall, J.V., Winer, A.M., Kleinman, M.T., Lurmann, F.W., Brajer, V., Colome, S.D., 1992.
Valuing the health benefitsof clean air. Science 255 (5046), 812–817.
Hampicke, U., 1999. The limits to economic valuation of biodiversity. Int. J. Soc. Econ.
26 (1/2/3), 158–173.
Hanemann, M.W., 1994. Valuing the environment through contingent valuation. J.
Econ. Perspect. 8 (4), 19–43.
Hanley, N., Spash, C.L., 2001. Cost–benefit analysis and environmental policymaking. Environ. Plan. C: Gov. Pol. 19 (1), 103–118.
Hargrove, C., 1992. Weak anthropocentric intrinsic value. Monist. 75, 183–207.
Hartigan, J.A., Kleiner, B., 1981. Mosaics for contingency tables. Computer Science
and Statistics: Proceedings of the 13th Symposium on the Interface 268–273.
Heal, G., Dailey, G.C., Ehrlich, P.R., Salzman, J., 2001. Protecting natural capital
through ecosystem services. Stanford Environ. Law J. 20, 333.
Hein, L., Koppen v, K., de Groot, R., van Ierland, E.C., 2006. Spatial scales,
stakeholders and the valuation of ecosystem services. Ecol. Econ. 57, 209–228.
Hori, H., 1993. Development of the Mekong river basin, its problems and future
prospects. Water Int. 18 (2), 110–115.
Kenter, J.O., Hyde, T., Christie, M., Fazey, I., 2011. The importance of deliberation in
valuing ecosystem services in developing countries – Evidence from the
Solomon Islands. Glob. Environ. Change 21, 505–521.
Kumar, M., Kumar, P., 2008. Valuation of the ecosystem services; a psycho-cultural
perspective. Ecol. Econ. 64, 808–819.
McCauley, D.J., 2006. Selling out on nature. Nature 443, 27–28.
MEA, 2005. The United Nations Millennium Ecosystem Assessment. Ecosystems and
Human Well-being: Current State and Trends. Coastal systems. Island Press,
Washington, D.C. USA.
213
Moons, E., Saveyna, B., Proosta, S., Hermy, M., 2008. Optimal location of new forests
in a suburban region. J. Forest Econ. 14, 5–27.
Nelson, E.J., Daily, G.C., 2010. Modelling ecosystem services in terrestrial systems. F
1000 Biol. Rep. .
Norton, B., Costanza, R., Bishop, R., 1998. The evolution of preferences: why
“sovereign” preferences may not lead to sustainable policies and what to do
about it. Ecol. Econ. 24, 193–211.
Nunes, P.A.L.D., van den Bergh, J.C.J.M., 2001. Economic valuation of biodiversity:
sense or nonsense? Ecol. Econ. 39, 203–222.
Páez-Osuna, F., 2001. The Environmental impact of shrimp aquaculture: causes,
effects, and mitigating alternatives. Environ. Manage. 28 (1), 131–140.
Pearce, D., Atkinson, G., Mourato, S., 2006. Cost Benefit Analysis and the
Environment: Recent Developments. Publishing OECD, Paris, France.
Primavera, J.H., 1997. Fish predation on mangrove-associated penaeids, the role of
structures and substrate. J. Exp. Mar. Biol. Ecol. 215, 205–216.
Reed, M.S., 2008. Stakeholder participation for environmental management: a
literature review. Biol. Conserv. 141 (10), 2417–2431.
Rönnbäck, P., 1999. The ecological basis for economic value of seafood production
supported by mangrove ecosystems. Ecol. Econ. 29, 235–252.
Rosenberry, B., 1998. World Shrimp Farming. Shrimp News International, San Diego.
Sagoff, M., 1998. Aggregation and deliberation in valuing environmental public
goods: a look beyond contingent pricing. Ecol. Econ. 24, 213–230.
Sasikumar, G., Krishnakumar, P.K., 2011. Aquaculture planning for suspended
bivalve farming systems: the integration of physiological response of green
mussel with environmental variability in site selection. Ecol. Indic. 11, 734–740.
Sayer, J.A., Campbell, B.M., 2004. The Science of Sustainable Development. Local
Livelihoods and the Global Environment. Cambridge University Press, Cambridge, U. K.
Schägner, J.P., Brander, L., Maes, J., Hartje, V., 2013. Mapping ecosystem services’
values: current practice and future prospects. Ecosyst. Serv. 4, 33–46.
Simões d, F.S., Moreira, A.B., Bisinoti, M.C., Gimenez, S.M.N., Yabe, M.J.S., 2008. Water
quality index as a simple indicator of aquaculture effects on aquatic bodies. Ecol.
Indic. 8, 476–484.
Spash, C.L., Hanley, N., 1995. Preferences, information and biodiversity preservation.
Ecol. Econ. 12, 191–208.
TEEB, 2010. The Economics of Ecosystems and Biodiversity: The Ecological and
Economic Foundations. Earthscan, London.
Thuy, T.D., 2006. Willingness to pay for conservation of Vietnamese rhino. Paper
presented at the EEPSEA biannual workshop November .
Turner, R.K., 2000. The place of economic values environmental valuation. In:
Batman, I.J., Willis, K.G. (Eds.), Valuing Environmental Preferences. Oxford
University Press, pp. 19–41.
Turner, R.K., Paavola, J., Cooper, P., Farber, S., Jessamy, V., Georgiou, S., 2003. Valuing
nature: lessons learned and future research directions. Ecol. Econ. 46 (3), 493–
510.
UNESCO, 2000. Biosphere Reserve Information: Vietnam – Can Gio Mangrove.
UNESCO MAB Biosphere Reserves Directory.
Upton, J.G., 1992. Fisher’s exact test. J. R. Statist. Soc. A 155 (3), 395–402.
Wilder, M.N., Phuong, N.T., 2002. The status of aquaculture in the Mekong delta
region of Vietnam: sustainable production and combined farming systems. ,
Fisheries ScienceProceedings of International Commemorative Symposium
70th Anniversary of the Japanese Society of Fisheries Science 70th Anniversary
of the Japanese Society of Fisheries Science, 68 Suppl. I. .
Wilson, M.A., Howarth, R.B., 2002. SPECIAL ISSUE: The dynamics and value of
ecosystem services: integrating economic and ecological perspectives. Discourse-based valuation of ecosystem services: establishing fair outcomes
through group deliberation. Ecol. Econ. 41, 431–443.
World Atlas of Mangroves, 2010. Chapter: South East Asia. Earthscan, Vietnam, pp.
129–131.
World Bank, 1999. Project Appraisal Document on a Proposed Credit to the Socialist
Republic of Vietnam for a Coastal Wetlands Protection and Development
Project. Report No: 19825 VN. Rural Development and Natural Resources Sector
Unit, East Asia and Pacific Region.