University of Wollongong
Research Online
Faculty of Commerce - Papers (Archive)
Faculty of Business
2007
An evaluation of the usefulness of cash flow ratios
to predict financial distress
Leonie Jooste
University of Wollongong,
[email protected]
Publication Details
Jooste, L. 2007, 'An evaluation of the usefulness of cash flow ratios to predict financial distress', Acta Commercii, vol. 7, no. 1, pp. 1-13.
Research Online is the open access institutional repository for the University of Wollongong. For further information contact the UOW Library:
[email protected]
An evaluation of the usefulness of cash flow ratios to predict financial
distress
Abstract
Purpose: With the introduction of the cash flow statement it became an integral part of financial reporting. A
need arose to develop ratios for the effective evaluation of cash flow information. This article investigates cash
flow ratios suggested by various researchers and suggests a list of ratios with the potential to predict financial
failure. Design: The cash flow ratios suggested by researchers, from as early as 1966, are investigated and eight
cash flow ratios selected for inclusion in an analysis to predict financial failure. Ten failed entities are selected
for a cash flow evaluation by means of the selected ratios for five years prior to failure. For a comparison, nonfailed entities, in similar sectors are selected and also evaluated by means of the cash flow ratios. The mean
values of each ratio, for each year prior to failure, were then calculated and the means of the failed entities were
compared to the non-failed entities. Findings: The comparison revealed that cash flow ratios have predictive
value with the cash flow to total debt identified as the best indicator of failure. It was also determined that
although failed entities have lower cash flows than non-failed entities, they also had smaller reserves of liquid
assets. Furthermore, they have less capacity to meet debt obligations and they tend to incur more debt. The
ratios of the failed entities were unstable and fluctuated from one year to the next. Finally, bankruptcy could
be predicted three years prior to financial failure. Implications: Income statement and balance sheet ratios are
not enough to measure liquidity. An entity can have positive liquidity ratios and increasing profits, yet have
serious cash flow problems. Ratios developed from the cash flow statement should supplement traditional
accrual-based ratios to provide additional information on the financial strengths and weaknesses of an entity.
Disciplines
Business | Social and Behavioral Sciences
Publication Details
Jooste, L. 2007, 'An evaluation of the usefulness of cash flow ratios to predict financial distress', Acta
Commercii, vol. 7, no. 1, pp. 1-13.
This journal article is available at Research Online: http://ro.uow.edu.au/commpapers/3200
AN EVALUATION OF THE USEFULNESS OF CASH FLOW RATIOS
TO PREDICT FINANCIAL DISTRESS
Dr L. Jooste, Nelson Mandela Metropolitan University, Port Elizabeth, South Africa.
Fax: +27 41 5043859, E-mail:
[email protected]
Synopsis
Type of paper
Research paper
Purpose
With the introduction of the cash flow statement it became an integral part of financial reporting. A need
arose to develop ratios for the effective evaluation of cash flow information. This article investigates cash flow ratios
suggested by various researchers and suggests a list of ratios with the potential to predict financial failure.
Design
The cash flow ratios suggested by researchers, from as early as 1966, are investigated and eight cash
flow ratios selected for inclusion in an analysis to predict financial failure. Ten failed entities are selected for a cash flow
evaluation by means of the selected ratios for five years prior to failure. For a comparison, non-failed entities, in similar
sectors are selected and also evaluated by means of the cash flow ratios. The mean values of each ratio, for each year prior
to failure, were then calculated and the means of the failed entities were compared to the non-failed entities.
Findings
The comparison revealed that cash flow ratios have predictive value with the cash flow to total debt
identified as the best indicator of failure. It was also determined that although failed entities have lower cash flows than nonfailed entities, they also had smaller reserves of liquid assets. Furthermore, they have less capacity to meet debt obligations
and they tend to incur more debt. The ratios of the failed entities were unstable and fluctuated from one year to the next.
Finally, bankruptcy could be predicted three years prior to financial failure.
Implications
Income statement and balance sheet ratios are not enough to measure liquidity. An entity can have
positive liquidity ratios and increasing profits, yet have serious cash flow problems. Ratios developed from the cash flow
statement should supplement traditional accrual-based ratios to provide additional information on the financial strengths and
weaknesses of an entity.
Key words
1
Cash flow statement, ratios, liquidity, financial failure.
INTRODUCTION
With the introduction of SFAS 95 in the USA and AC 118 in South Africa, the cash flow statement
became a mandatory financial statement. This inclusion created a need for cash flow ratios to be
included, with traditional balance sheet and income statement ratios, in a financial analysis.
Balance sheet data is static for it measures a single point in time, namely the balance sheet date. The
income statement, on the other hand, contains many non-cash transactions, whereas the cash flow
statement is dynamic. It records the changes in the other statements over a period and focuses on
cash available for operations and investments (Mills & Yamamura, 1998:53).
The value of cash flow information is that it can be used to assess the quality of earnings, financial
flexibility and assists in forecasting cash flows. Cash flow information should also give a better
indication of the liquidity of an entity, because nothing is more liquid than cash. If cash flow ratios can
be used as a liquidity measure, they can predict financial failure and, ultimately, bankruptcy.
Therefore, an early warning of possible financial distress can ultimately help to prevent subsequent
financial failure.
Cash flow information can also be useful by complementing the information already provided by
accrual accounting. A set of cash flow ratios if used in conjunction with traditional balance sheet and
income statement ratios can be valuable to determine the financial strengths and weaknesses of an
entity (Carslaw & Mills, 1991:63).
The aim of this article is to select a list of cash flow ratios with the potential to predict financial failure
and to investigate the cash flow ratios suggested by researchers from as early as 1966. Failed and
2
non-failed entities are evaluated by means of selected cash flow ratios. The mean values of each ratio
are calculated and those of the failed entities compared to non-failed entities. The results of the ratios
are analysed to determine if financial failure can be predicted as well as the time span prior to failure.
The cash flow ratios are also analysed to determine if one or more cash flow ratio are a better
predictors of failure than others.
2
SELECTING CASH FLOW RATIOS
An investigation of cash flow ratios revealed that Beaver (1966:71-111) was the first to recognise the
importance of operating cash flow as a predictor of financial distress. Four cash flow ratios were
included in a financial analysis which concluded that the ability to predict failure was the strongest in
the cash flow model. After the pioneering work of Beaver, studies by Giacomino and Mielke (1988:5457, 1993:55-58), Zeller and Figlewicz (1990:49-59), Carslaw and Mills (1991:63-70, 1993:14-16;),
Figlewicz and Zeller (1991:64-81), Stanko and Zeller (1993:83-103), Zeller and Stanko (1994:51-59),
Rujoub, Cook and Hay (1995:75-91) and Mills and Yamamura (1998:53-60) were of the first to
develop cash flow ratios for inclusion in a financial analysis since the proposal and implementation of
SFAC 95 in the USA.
Many of the ratios introduced by earlier authors were duplicated or transformed by other authors
(Kuffler & Leung, 1998:59-60; Ciesielski, 1999:1-13; Gallinger, 1999:40-43; Stickney & Brown,
1999:154; Palepu, Healy & Bernard, 2000: 9.15-9.18; Brigham & Ehrhardt, 2002:46; Brigham &
Davies, 2002:187-188; Lovemore & Brummer, 2003) All the later studies, however, stress the
importance of cash flows from operations, as opposed to investing and financing activities for
reinvestment in assets and payments of obligations. As cash flow from operations is the primary cash
generating activity of an entity, an entity will fail if it is unable to produce internally generated cash to
finance obligations and if it is unsuccessful in obtaining additional financing. If additional financing is
obtained, it should be used for the enhancement of operating activities or productive assets and not to
finance debt.
Table 1 lists eight selected cash flow ratios to evaluate failed and non-failed entities.
TABLE 1
CASH FLOW RATIOS SELECTED FOR FINANCIAL ANALYSIS
CASH FLOW RATIOS SELECTED FOR FINANCIAL ANALYSIS
NO
CASH FLOW RATIOS
COMPONENTS
1.
Cash flow to sales
CFFO*
Sales
2.
Cash flow to assets
CFFO*
Total assets
3.
Reinvestment
CFFO* (after dividends and current debt)
Capital expenditure
4.
Cash flow to total debt
CFFO* (after interest)
Total debt
5.
Critical needs coverage
CFFO*
Interest, current debt and dividends
6.
Cash interest coverage
CFFO* (after current debt)
Interest paid
7.
Dividend coverage
CFFO*(after interest and preference dividends)
Ordinary dividends
8.
Cash flow to income
CFFO*(after interest and taxation)
Operating Income (after interest and taxation)
*Cash flow from operations
The cash flow ratios in Table 1 are selected owing to their popularity and because cash flow from
operations is a component of each ratio.
Financial failure in this study means the inability to cover obligations as they become due. According
to Mossman, Bell and Swartz (1998), bankruptcy will result if an entity has insufficient cash available
3
to service debt outflows as they become due, and the value of the entity is insufficient to obtain
additional financing. Altman and Spivack (1983) agree that the inability of an entity to generate enough
cash from its operations may force the entity to borrow more money or to dispose of its productive
assets or investments to meet obligations. If this situation persists over an extended period of time, it
may lead to financial failure. In this regard, Altman and Spivack (1983) and Mossman et al. (1998) find
that the inability to finance obligations out of internally generated funds is empirically testable. This has
been used to investigate the usefulness of accounting information in other studies successfully.
3
SELECTING FAILED AND NON-FAILED ENTITIES
This study, as with earlier studies on bankruptcy prediction (Beaver, 1966; Aziz, Emanuel & Lawson,
1988; Laininen, 1994), uses financial statements of failed entities five years prior to failure for analysis.
Entities in the public utilities, transportation, investment, insurance and financial institutions are
excluded from the evaluation. Their ratios and cash flows are always substantially different from those
of other types of entities, even when they are in no danger of failure (Beaver, 1966; Ohlson, 1980;
Gilbert, Menon & Schwartz, 1990; Mossman et al., 1998).
A list of delisted or suspended entities during 2000 and 2004 was obtained from the JSE. The aim is to
select failed entities with financial statements for five years prior to 1996, the year AC 118 (revised)
became compulsory in South Africa. Ten failed entities are selected for evaluation and a non-failed
entity is selected for a comparison if it suits the following criteria:
must be in the same sector as the failed entity;
must have five corresponding financial statements similar to failed entities; and
must not fall in the list of excluded entities.
Twenty non-failed entities are selected for comparison to the failed entities. The twenty non-failed
entities are first evaluated using the K-score (De la Rey, 1981) to determine if they are experiencing
financial difficulties. Six non-failed entities are identified not to be financially sound and eliminated from
further evaluations.
Table 2 lists the failed and non-failed entities selected for evaluation. The non-failed entities are
randomly selected. If one entity does not fit the criteria, the next entity is selected. If no other entity is
available, an entity with four corresponding financial statements is selected.
TABLE 2
LIST OF ENTITIES INCLUDED IN ANALYSIS
LIST OF ENTITIES INCLUDED IN ANALYSIS
FAILED AND NON-FAILED ENTITIES
DNA Supply Chain Investments Ltd (DNASUP)
(failed in 2002)
Bowler Medcalfe Ltd (BOWCAFL)
Nampak Ltd (NAMPAK)
Transpaco Ltd (TRNPACO)
Dynamic Cables RSA Ltd (DYNAMIC)
(failed in 2002)
Infowave Holdings Ltd (INFOWAVE)
Integrear Ltd (INTEGREAR)
Stella Vista Technologies Ltd (STELLA)
Fashion Africa Ltd (FASHAF)
(failed in 2002)
Retail Apparel Group Ltd (RAG)
(failed in 2001)
African & Overseas Enterprises Ltd (AF-&OVER)
Foschini Ltd (FOSCHINI)
Mr Price Group Ltd (MR PRICE)
INDUSTRY AND INFORMATION
Support services business support
Development capital
Financial statements for four years
Excluded, not financially sound
Excluded, not financially sound
Retailers soft goods, clothing
4
Masterfridge Ltd (FRIDGEM)
(failed in 2000)
Nu-World Holdings Ltd (NUWORLD)
Richemont Securities Ag (RICHMONT)
Rare Earth Co Ltd (RARECO)
(failed 2002)
Lonrho Africa Plc (LONAFRIC)
Northern Engineering Industries (Africa) Ltd (NEI-AFR)
(failed in 2000)
Kairos Industrial Holdings Ltd (KAIROS)
Siltec Ltd (SILTEC)
(failed in 2000)
Mustec Ltd (MUSTEC)
Terexko Ltd (TEREXKO)
(failed in 2002)
Famous Brands Ltd (FAMBRANDS)
Kings Consolidated Holdings Ltd (KINGCO)
Universal Growth Holdings Ltd (UNIGRO)
(failed in 2000)
Venter Leisure & Commercial Trailers Ltd (VENTEL)
Textile household appliances
Venture capital (mining & extraction)
Excluded, not financially sound
Engineering machinery
Excluded, not financially sound
IT hardware computer hardware
Financial statements for four years
Leisure and hotel, restaurants, pubs
Excluded, not financially sound
Household goods textile leisure
Excluded, not financially sound
Source: Adapted from list received from the JSE
Table 2 lists the failed and non-failed entities selected for evaluation. The sector and reasons for
exclusions are also listed and two entities are included with four financial statements. The short name
of the entity and the year of failure are given in brackets.
The mean values of each ratio for each year prior to failure are calculated for the failed and non-failed
entities. The means of the failed entities are then compared to the non-failed entities. The results of
the mean values for each ratio are illustrated in Figures 1 to 8 and the analyses of the results are
discussed.
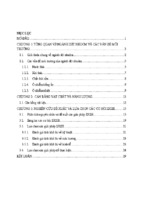
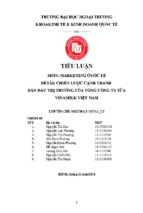
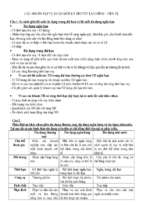
The cash flow to sales ratio is calculated in Figure 1. This ratio measures performance and indicates
the ability of an entity to generate cash flow, the number of sales that realises in cash. The delivery of
goods and services are the primary cash generating activity of an entity. By comparing the return on
sales ratio with the cash flow to sales ratio, the analyst can identify the extent to which an entity relies
on non-cash items to generate sales, as credit sales, or the shifting of inventory to customers to
generate sales. Slow cash collections, for example, will be picked up by the cash flow to sales ratio
whereas the return on sales ratio will stay stable (Figlewicz & Zeller, 1991:69).
FIGURE 1
CASH FLOW TO SALES RATIO
5
CASH FLOW TO SALES RATIO
3
2
1
0
-1 1
-2
-3
-4
-5
2
3
4
5
Years before failure
Fail
Non-fail
The mean value of the cash flow to sales ratios of the failed entities is weaker than the mean of the
non-failed entities in three out of five years. It is not possible to predict failure in the fifth and fourth
years prior to failure. The ratios of the failed entities are negative in the fifth year and the increase in
cash flow in the fourth year can be due to an increase in sales, as the failed entities were selling stock
without replacing it. The ratio of the non-failed entities is stronger in the third and final year of failure.
This ratio indicates low values for all entities.
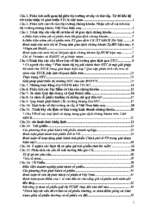
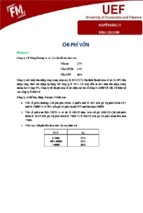
The cash flow to asset ratio illustrated in Figure 2, measures performance and the utilisation of an
entity’s asset base to create cash flows from operating activities. The traditional return on asset and
asset turnover ratios are expected to provide information about asset management and potential
future returns to investors. However, the asset turnover ratio only provides information about whether
the entity is generating appropriate turnover to support the investment in assets and not whether the
investment in assets is sufficient to support future cash flow generation (Zeller & Figlewicz, 1990:52).
The cash generating ability of assets is important in the evaluation of investments in assets, as strong
cash returns help generate future investments.
FIGURE 2
CASH FLOW TO ASSETS RATIO
CASH FLOW TO ASSETS RATIO
12
10
8
6
4
2
0
-2 1
2
3
4
5
Years before failure
Fail
Non-fail
Although the mean value for the failed entities is 790.34 in the fifth year prior to failure, Figure 2
indicates that 10 gives a better indication of differences between small values. The mean value of the
6
failed ratios is weaker than the non-failed ratio in the third and final year of failure only. In normal
circumstances, where an entity is financially sound, a low value for this ratio indicates increased
investment in assets, as an entity has to maintain an asset base to enhance the ability to generate
future cash flows from assets (Carslaw & Mills, 1991:58; Rujoub, Cook & Hay, 1995:80). A decrease in
these ratios from the fifth to the fourth year may be due to the lack of reinvestment in assets. An entity
should at a minimum reinvest in assets at least at the same rate that it is depreciating assets
(Giacomino & Mielke, 1993:56). The only meaningful conclusion that can be made from this ratio is
that the cash generated from assets is low.
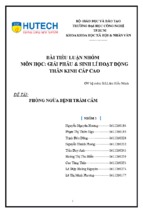
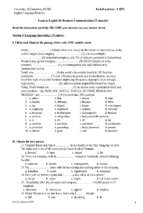
In Figure 3, the investment in assets is measured. This ratio is an indication of an entity’s ability to
finance its capital expenditure from internal sources and whether it is reinvesting in assets faster than
writing off depreciation (Giacomino & Mielke, 1993:56).
FIGURE 3
REINVESTMENT RATIO
REINVESTMENT RATIO
10
0
-10 1
2
3
4
5
-20
-30
-40
-50
Years before failure
Fail
Non-fail
Both the failed and non-failed entities cannot afford capital expenditure and do not have cash flow to
reinvest in assets after current debts, interest and dividends are paid. The mean value of the ratio of
the failed entities is weaker than the non-failed entities in four out of five years. The reinvestment
ratios of the failed and non-failed entities are negative. An entity’s competitive advantage depends on
its ability to maintain its capital assets. If reinvesting does not occur, the basis for future cash flows
could be questioned.
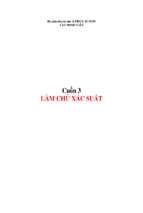
Bankruptcy will result if an entity has insufficient cash available to pay obligations and if the value of
the entity is insufficient to obtain additional financing. The cash flow to total debt, as in Figure 4, may
be used as a liquidity indicator. It indicates whether an entity can cover obligations as they become
due. Beaver (1966) found this ratio to be the most significant in predicting bankruptcy.
FIGURE 4
CASH FLOW TO TOTAL DEBT RATIO
7
CASH FLOW TO TOTAL DEBT RATIO
5
0
1
2
3
4
5
-5
-10
-15
Years before failure
Fail
Non-fail
This ratio measures whether debt can be covered by cash flow from operations. The negative ratio of
the failed entities indicates that additional measures are needed to cover debt, for example, reliance
on outside financing. The cash flow to total debt ratio of the failed entities is weaker than those of the
non-failed entities in four out of five years. A decreasing trend may signal a potential problem with
maintaining operations and debt repayment out of internally generated funds and the need for
additional financing to satisfy interests charges, taxes and dividends.
In Figure 5, the critical needs ratio is indicated. Creditors and investors are interested in this ratio as it
indicates short-term liquidity. An entity should generate sufficient cash to cover at least its immediate
obligations.
FIGURE 5
CRITICAL NEEDS RATIO
CRITICAL NEEDS RATIO
4
3
2
1
0
-1
1
2
3
4
5
Years before failure
Fail
Non-fail
The critical needs ratio is a short-term liquidity measure and indicates coverage of current debt,
interest and dividends after normal operating expenses. If an entity is able to cover immediate
obligations it may survive in the long-term. The critical needs ratios of the failed entities improved from
the third year prior to failure but insufficient cash was generated to cover total debt.
8
Traditional activity and coverage ratios fail to capture a specific measure of an entity’s liquidity and
long-term solvency. Specific cash flow indicators of liquidity and solvency are designed to measure an
entity’s ability to meet obligations beyond operating needs, such as interest and debt.
The cash to interest coverage ratio, in Figure 6, measures whether cash is available to cover interest
payments. During hard times an entity may rely on outside financing to cover debts. This will increase
the interest liability on an entity. If an entity can cover increasing interest payments it may survive, as
the debt payments may be taken care of through financing.
FIGURE 6
CASH INTEREST COVERAGE RATIO
CASH TO INTEREST COVERAGE RATIO
600
400
200
0
-200
1
2
3
4
5
-400
Years before failure
Fail
Non-fail
This ratio represents net cash flows from operations less current debt available to cover interest. The
decreasing trend in the ratios of the failed entities from the fourth year indicates progressive
deterioration of future difficulties in meeting interest payments.
The cash dividend ratio, in Figure 7, measures the cash available for dividends after current debt and
interest payments are satisfied. Shareholders want to determine how well their dividends are covered
and if the potential exists for increased dividend payments. A decreasing trend in this ratio can indicate
potential failure to provide returns to shareholders.
FIGURE 7
CASH DIVIDEND COVERAGE RATO
9
CASH DIVIDEND COVERAGE RATIO
50
0
-50 1
-100
-150
-200
-250
-300
2
3
4
5
Years before failure
Fail
Non-fail
An entity experiencing financial difficulties will tend not to pay dividends. If no dividends are paid for a
few years, it could indicate financial difficulties. During such a period shareholders may be willing to
forfeit dividends for survival of the entity. A ratio of less than one indicates that the cash used to pay
dividends is not produced solely from operations. Hardly any dividends were paid by the failed entities.
Liquidity is measured by the cash flow to total debt ratio and coverage is measured by the critical
needs, interest and dividend coverage ratios. A coverage ratio of less than one indicates that cash
used to provide returns to creditors and investors is not provided solely by operations (Figlewicz &
Zeller, 1991:71).
The cash to income ratio, as measured in Figure 8, measures the quality of income and indicates
whether an entity can continue to generate current income levels and invest in assets to improve the
quality of future earnings. If this ratio is drawn through to the reinvestment ratio it will show the ability
to generate future earnings from assets. If there is a decline in the cash to income ratio as well as in
the reinvestment ratio, it indicates that the entity is not maintaining, or has not generated earnings to
maintain its asset base. Therefore, it could not utilize its assets to enhance future earnings and
generate cash flows.
FIGURE 8
CASH TO INCOME RATIO
CASH TO INCOME RATIO
8
6
4
2
0
-2 1
2
3
4
-4
Years before failure
Fail
Non-fail
5
10
The cash to income ratio also indicates conservatism in calculating income. It measures the stability of
income, the relation between income and cash flow and the degree of generating cash flow from
operations for asset maintenance and the enhancement of future earnings. This ratio of the failed
entities indicates no stability between cash flow and income. The increase in cash flow from the fourth
year is due to changes in working capital, expanding receivables or the understatement of payables.
There is always a link between the inflow and outflow of an activity. If any part of the activity fails it
may cause the whole entity to fail.
4
ANALYSIS OF RESULTS
An analysis of results found that of the failed entities have unusually strong ratios while in financial
distress. The individual cash flow statements of the entities were investigated and found that the
strong ratios are as a result of changes in working capital and not as a result of increased inflow from
turnover or services.
As an example, in the fourth year (1999) prior to failure, Fashion Africa, retailers in the soft goods
sector, decreases inventory with close to R126 million. In the year prior to failure, in 2000, Retail
Apparel decreases inventory and debtors and increases creditors with nearly R20 million, R15 million
and R60 million respectively. In 2001, inventory decreases with close to R48 million and debtors, R12
million.
In the year before failure, Masterfridge decreases inventory with R43 million and increases creditors
by R12 million. Dynamic Cables, decreases inventory and debtors with R34 million and R45 million in
2000, the third year prior to failure. DNA has a change in working capital of R8 million in the fifth year
prior to failure. Rare Earth decreases inventory and debtors in the fourth year prior to failure with R4
million. In the final year, in 2002, creditors are increased by R80 million. In the year of failure, 2002,
Terexko increases creditors with R6 million, debtors are decreased by R44 million in the fourth year
and R15 million in the year prior to failure.
In the fifth year before failure, six cash flow ratios of the non-failed entities are stronger than the ratios
of the failed entities except for the cash flow to assets and dividend coverage ratios of the failed
entities. The mean values of the failed entities indicate negative cash flow from sales and income
whereas the cash flow to asset ratio indicates that cash can be generated from their asset bases.
Entities have to maintain their operating assets to remain competitive. In this analysis, the
reinvestment ratio indicates that after providing for current debt, interest and dividends, the failed
entities do not have cash flow available to maintain their current asset bases. The cash flow to total
debt and coverage ratios indicate that the entities have to rely on other sources to meet their
obligations.
In the fourth year, most of the cash flow ratios of the failed entities are stronger than the ratios of the
non-failed entities. The cash flow to total debt ratio, however, declines from the fifth to the fourth year.
This indicates additional sources of cash to cover debt and interest payments. The cash to income
ratio indicates a negative cash flow from operations from the fifth year. A consistent figure that is less
than one for the cash to income ratio may indicate that expanding receivables or the understatement
of payables are responsible for generating sales (Zeller & Stanco (1994:52).
The increase in the cash flow to sales ratio of the failed entities can be a result of decreasing inventory
as not enough cash is produced from assets. Funds are available for reinvestment in assets after
short-term obligations are met but not available for covering the total debt. In the fourth year, the cash
flow to total debt ratio is the weakest and this indicates that the entities are not liquid. Insufficient cash
is produced from operations, and the entities have to rely on other sources or outside financing to pay
debts. The increase in reinvestment ratio can also be a result of insufficient reinvestment in assets.
The failed entities’ cash flow to asset ratio decreases from the fifth to the fourth year. A low return on
this ratio, in normal circumstances, can also indicate increases in assets invest (Carslaw & Mills,
1991:58; Rujoub, Cook & Hay, 1995:80). In this case, however, the low value of the ratio is due to
insufficient cash realised from assets.
11
The interest coverage ratio of the failed entities also decreases from the fourth year. A highly
leveraged entity will have a low cash interest coverage ratio. A decreasing trend in this ratio indicates
progressive deterioration of the entity’s future ability to meet interest payments. In the third year, the
ratios of the non-failed entities are the strongest, except for the cash to income ratio. Only the cash to
total debt ratio, which indicates for the third year insufficient funds to meet obligations, and the cash to
income ratio increases. The cash flow to sales ratio decreases, whereas the cash to income ratio
increases. This indicates no stability between cash flow and income.
From the third year to the year prior to failure, there is no improvement in the cash flow ratios of the
failed entities. The critical needs ratios improve from the third year but insufficient cash is generated to
cover total debt. The second year prior to failure is the only year where the cash flow to total debt ratio
of the failed entities is stronger than the ratio for the non-failed entities. However, the critical needs
ratio only indicates cash flow in the short-term. The individual coverage ratios show insufficient funds
for interest and dividends and the failed entities hardly pay any dividends. There are also no internal
funds available for reinvestment in assets. The ratios of the non-failed entities are stable except for the
improvement in the cash interest coverage ratio.
In the final year, all the ratios of the failed entities are negative and seven of the eight ratios of the
failed entities are weaker than the ratios of the non-failed entities. No cash flow is produced from sales
and assets. All the ratios decline from the second year, except for the cash flow to interest ratio, which
indicates a slight increase.
If all these factors are taken into consideration, it is possible to predict failure in the third year. For the
second time in three years most of the ratios of the failed entities are weaker than the ratios of the
non-failed entities. The cash flow to income ratio indicates, in the fourth year, that expanding
receivables or the understatement of payables generate sales. The entities cannot generate cash from
sales and assets and have to rely on other sources to meet interest payments and pay debts. No cash
flow is available to reinvest in an asset base to enhance future production of cash flows. In comparison
with the non-failed entities, the mean values of the failed ratios are unstable.
The cash flow to total debt and reinvestment ratios of the failed entities is weaker than those of the
non-failed entities in four out of the five years prior to failure. Therefore, the probability to predict failure
must lie with the cash flow to total debt and reinvestment ratios as all ratios do not predict equally well.
However, it is more likely that an entity will fail if it does not pay debts than if its reinvestment in assets
is insufficient. Furthermore, as financial distress increases, entities will tend to use available funds to
pay interest and other debt obligations to survive and they will not use funds to reinvest in an asset
base. This is also evident in the cash dividend coverage ratio, as entities with financial difficulties do
not pay dividends. Therefore, the best predictor of failure will lie with the cash flow to total debt ratio.
The cash flow to total debt ratio is calculated after providing for interest and principal debt. The
reinvestment in productive assets will enhance future earnings and will not have an immediate impact
on earnings or cash flows. Therefore, a low value for the reinvestment ratio, in normal circumstances,
can also indicate substantial investments in assets.
Beaver (1966:80) identified four concepts as important when predicting financial failure. These
concepts are:
Size of the cash reserves;
Net cash flow from operations;
Amount of debt held; and
Operating expenditures.
These concepts can be used to explain the predictive value of the cash flow to debt ratio. The larger
the reserves of cash and cash flow from operations, the smaller the probability of failure. Furthermore,
the greater the debt and operating expenditure of an entity, the greater is the probability of failure.
This study uses the cash flow from operations after operating expenditure has been paid, adding the
changes in working capital that represents the reserve of liquid assets. What remains is available to
pay debts. If an entity does not have cash flow to cover its debts over a period of time, it cannot
survive.
12
Any ratio in isolation is not of much use. It has to be incorporated with other ratios or information to
have a predictive value. The cash flow to sales ratio is negative in year five and this indicates that not
enough cash is generated from operations. This is also evident in the cash to income ratio. As a result,
not enough cash is available to pay debts and critical needs, as indicated in the cash flow to total debt
and critical needs ratios. This indicates reliance on outside financing or other sources to cover debts.
The cash flow from assets ratio indicates that cash is produced from assets but after debts are met,
there is no cash flow available for the maintenance of an asset base.
In the fourth and third years, the cash flow to assets ratio declines. A possible reason can be that the
asset base was not maintained previously to generate future cash flow from assets. The increase in
cash flow to sales ratio indicates that entities tried to generate cash by decreasing inventory and
increasing creditors. This was evident in the cash to income ratio. A ratio consistently less than one
indicates that sales are generated by means of expanding receivables, decreasing inventory or the
understatement of payables. There is no significant increase in the cash flow to assets ratio as there
are insufficient funds available for investment in productive assets, interest and dividend payments.
From the third year, the cash to income, reinvestment and cash interest and dividend coverage ratios
decline. A comparison between the income and reinvestment ratio indicates that an entity had to
maintain an asset base to enhance the ability to generate future income and cash flow from assets.
From the third year, all the cash available, whether from operations or changes in working capital,
inventory decrease or non-payment of creditors are used to service debts. The cash flow to total debt
ratio for the failed entities is stronger than the ratio for the non-failed entities in the year prior to failure.
5
SUMMARY
An analysis of the cash flow ratios revealed that cash flow information has explanatory power. The aim
of the analysis is to outline the general relationship between failed and non-failed entities using cash
flow information derived from the cash flow statement. The higher the ratio, calculated from the cash
flow statement, the lower the likelihood of failure and a positive ratio also indicates positive cash flows.
Where the mean values are negative, no effective conclusion can be made other than that insufficient
cash is available.
Signs of potential financial failure are generally evident in a ratio long before the entity actually fails. In
this regard, the failed entities have lower cash flows than non-failed entities and smaller reserves of
liquid assets. They also have less capacity to meet obligations and they tend to incur more debt. The
changes in working capital also have an effect on the results of ratios. A decrease in inventories
means that the entity is selling inventories and not replacing them and, therefore, generating cash.
When payables increase, the entity receives additional credit that saves cash. In the fourth year and
the year prior to failure, the changes in working capital cause failed entities to have positive cash flows
while in other years, they experience negative cash flows.
6
REFERENCES
Altman, E.I., & Spivack, J. 1983. Predicting bankruptcy: The value line relative financial strength
system versus the Zeta bankruptcy classification. Financial Analysts Journal, 39:60-67.
Aziz, A., Emanuel, D.C. & Lawson. 1988. Bankruptcy prediction - an investigation of cash flow based
models. Journal of Management Studies, September: 419-437.
Beaver, W.H. 1966. Financial Ratios as predictors of failure. Journal of Accounting Research
(Supplement): 71-111.
Brigham, E.F. & Daves, P.R. 2002. Intermediate Financial Management, 7th ed. South-Western:
Thompson Learning.
Brigham, E.F. & Ehrhardt, M.C. 2002. Financial Management Theory and Practice. 10th ed. SouthWestern: Thompson Learning.
Ciesielski, J.T. 1999. ‘Cash-flavoured’ earnings: bogus performance measure. The Analyst’s
Accounting Observer, vol. 8(8):1-17.
13
Carslaw, C.A. & Mills, J.R. 1991. Developing ratios for effective cash flow statement analysis. Journal
of Accountancy, November: 63-70.
Carslaw, C.A. & Mills, J.R. 1993. Including the cash flow statement in financial analysis. Executive
Accountant, Autumn: 14-16.
De La Rey, J.H. 1981. Finansiële verhoudingsgetalle en die voorspelling van financiële mislukking by
nywerheidsondernemings in die Republiek van Suid-Afrika. Pretoria: University of Pretoria.
(Unpublished Doctoral Script).
Figlewicz, R.E. & Zeller, T.L. 1991. An analysis of performance, liquidity, coverage and capital ratios
from the statement of cash flows. ABER, 22(1):64-81.
Gallinger, G.W. 2000. A framework for financial statement analysis part 1: Return-on-asset
performance. Business Credit, vol. 102(2):40-43.
Giacomino, D.E. & Mielke, D.E. 1988. Using the statement of Cash flows to analyze corporate
performance. Management of Accounting, May: 54-57.
Giacomino, D.E. & Mielke, D.E. 1993. Cash flows: another approach to ratio analysis. Journal of
Accountancy, March: 55-58.
Gilbert, L.R. Menon, K. & Schwartz, K.B. 1990. Predicting bankruptcy for firms in financial distress.
Journal of Business Finance & Accounting, 17(1):161-171.
Kuffler, L.A. & Leung, R.M. 1998. Rating criteria for global project and infrastructure developers.
Journal of Project Finance, vol. 4(1):55-67.
Laitinen, E.K. 1994. Traditional versus operating cash flow in failure prediction. Journal of Business
Finance & Accounting, vol. 21(2):195-217.
Lovemore, F.C.H. & Brummer, L.M. 2003. The ABC of Financial Management: An Introduction to
Financial Management and Analysis. 2nd ed. Pretoria: Van Schaik.
Mills, J.R. & Yamamura, J.H. 1998. The power of cash flow ratios. Journal of Accountancy, 186(4):5360.
Mossman, C.E. & Bell, G.G. & Swartz, L.M. 1998. An empirical comparison of bankruptcy models.
Financial Review, 33(2):35-55.
Ohlson, J.A. 1980. Financial ratios and the probabilistic prediction of bankruptcy. Journal of
Accounting Research. Spring: 109-131.
Palepu, K.G., Healy, P.M. & Bernard, V.L. 2000. Business Analysis & Valuation: Using Financial
Statements. 2nd ed. Mason: Thompson Learning.
Rujoub, M.A., Cook, D.M. & Hay, L.E. 1995. Using cash flow ratios to predict business failures.
Journal of Managerial Issues, 7(1):75-91.
Stanko, B.B. & Zeller, T.L. 1993. Cash flow ratios to measure liquidity and performance for
transportation manufacturing firms. Journal of Transportation Management, V(2):83-103.
Stickney, C.P. & Brown, P.R.
Dreyden Press.
1999. Financial Reporting and Statement Analysis. Ford Worth:
Zeller, T.L. & Figlewicz, R.E. 1990. New investing and financing activity ratios from the statement of
cash flows enhance traditional ratio analysis in assessing future cash flows. The Mid-Atlantic Journal
of Business, 26(2):49-59.
14
Zeller, T.L. & Stanko, B.B. 1994. Operating cash flow ratios measure a retail firm’s “ability to pay”.
Journal of Applied Business Research, 10(4):51-59.