REQUEST FOR TEXTILE AND APPAREL SAFEGUARD
ACTIONS ON IMPORTS FROM CHINA
COTTON TROUSERS (CATEGORY 347/348) IMPORTED FROM
THE PEOPLE’S REPUBLIC OF CHINA
filed October 8, 2004
Authority for Action: Section 204 of the Agriculture Act of 1956, as amended, and § 11.242 of
the Report of the Working Party on the Accession of China to the World Trade
Organization.
Subject of Petition: Imports of cotton trousers from China, classified as Categories 347 and
348 by the U.S. Textile and Apparel Category System.
Petition for Safeguard Action - Imports from China Categories 347/348
page 2
TABLE OF CONTENTS
REQUEST FOR TEXTILE AND APPAREL SAFEGUARD ACTIONS ON IMPORTS
FROM CHINA .......................................................................................................1
A.
B.
C.
D.
E.
F.
G.
H.
I.
J.
K.
L.
INTRODUCTION .............................................................................................3
SUMMARY OF THE CASE.............................................................................4
PETITIONERS ..................................................................................................5
PRODUCT DESCRIPTION..............................................................................6
IMPORT DATA ................................................................................................6
1. Table Showing Total U.S. Imports .....................................................................8
2. Table Showing Imports from China into the U.S. ..............................................9
3. Potential Misclassification of Trouser Imports from China ...............................9
PRODUCTION DATA....................................................................................13
MARKET SHARE DATA ..............................................................................15
THE THREAT OF INCREASED IMPORTS FROM CHINA .......................16
1. Growth in China's Productive Capacity for Textiles and Apparel.....................17
2. China Dominates the Market in Apparel Categories Previously Removed From Quotas
................................................................................................................................20
3. China Engages in Significant Price Cutting in Categories Removed From Quota
................................................................................................................................21
4. Academicians, Analysts and International Institutions Agree that China Will
Dominate World and U.S. Trade in Apparel .........................................................22
5. Major Suppliers, Retailers and Sourcing Agents Indicate China Will Dominate World
And U.S. Trade in Apparel ....................................................................................24
6. In Markets Similar to the U.S., China Quickly Dominated Categories Removed From
Quota......................................................................................................................26
7. China Engages in a Variety Of Unfair Trade Practices, Including Currency
Manipulation ..........................................................................................................27
ADDITIONAL INFORMATION....................................................................28
1. Economic Condition of the U.S. Textile and Apparel Industries .....................28
2. Threat to Outward Processing Trade ................................................................32
ACTION AUTHORIZED UNDER THE AGREEMENT ..............................35
REQUESTED ACTION ..................................................................................35
EXHIBITS .......................................................................................................35
Petition for Safeguard Action - Imports from China Categories 347/348
page 3
A. INTRODUCTION
This Petition is filed requesting action under the authority of § 204 of the Agriculture Act of
1956, as amended, and § 11.242 of the Report of the Working Party on the Accession of China to
the World Trade Organization with respect to imports of cotton trousers (classified in the U.S.
Textile and Apparel Category System as Categories 347 and 348, the “subject products”) of
Chinese origin. The Committee for the Implementation of Textile Agreements (CITA) is hereby
requested to take all appropriate steps in order to avoid market disruption in 2005 with respect to
imports from China of such products. Petitioners submit that such market disruption can only be
avoided by the timely imposition of limitations on imports of the subject products from China
according to the provisions of Section 11.242 of the Report of the Working Party and the
guidelines issued by the Committee for the Implementation of Textile Agreements (68 F.R.
27788 (May 21, 2003).
Upon the lifting of quotas on January 1, 2005, the U.S. market will experience an increase in
imports of the subject products from all sources. These increasing imports threaten the U.S. with
market disruption, and imports of the subject products from China will play a role in that
increase and in the threat of market disruption. Imports of the subject products have increased
and will increase in 2005.
This petition establishes:
That imports will increase in 2005 as a result of the lifting of quotas;
That imports from China will play a role in that increase;
That the increase in imports will contribute to a decline in U.S. production of the subject
products and a decline in U.S. market share;
That the U.S. market for the subject products will be disrupted in January and throughout
2005 by increasing imports of the subject products; and
That imports of the subject products from China play a role in the threatened market
disruption to the U.S. market.
By demonstrating the threat of market disruption and the role of Chinese imports in that
disruption, Petitioners have established sufficient grounds for action to be taken under section
11.242 of the Report of the Working Party. The imminent threat of substantial increases in
imports of the subject products from China and of market disruption will impede the orderly
development of trade in the subject products.
This Petition is filed on behalf of organizations1 which represent U.S. manufacturers and workers
involved in the production of apparel and components of apparel (including fabric). Some of
these organizations’ members produce products like or directly competitive with the subject
products. The production of the subject products occurs in the United States and under outward
processing arrangements.
1
A description of each organization and its membership is included in section C of this report and in Exhibit 1.
Petition for Safeguard Action - Imports from China Categories 347/348
page 4
B. SUMMARY OF THE CASE
This petition proves that total imports of the subject products into the United States will rise
upon the expiration of quotas on January 1, 2005. Imports from the People's Republic of China
will play a role in the rise of overall imports in the subject product categories. As a result of
these rising imports, U.S. production of the subject products will decrease. Consequently, the
percentage of U.S. market share held by domestic producers will also decline.
Imports of the subject products into the United States have already risen by 39.5 percent since
1999 and will continue to increase when import limitations are removed on January 1, 2005.
This is clearly demonstrated by dramatically increasing imports of apparel in categories that have
heretofore been removed from quota control in the United States. Increasing imports of the
subject products threaten to disrupt the U.S. market and impede the orderly development of trade
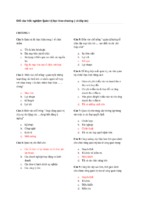
in the subject products. U.S. production of the subject products has declined by 24 percent since
1998.2
U.S. Trouser Industry
(Cat. 347/348)
Production
Imports
160,000
140,000
120,000
(1,000 Dozen)
100,000
80,000
60,000
40,000
20,000
0
1994
1995
1996
1997
1998
1999
2000
2001
2002
In this regard, the petition provides evidence that China is well-positioned to play a role in the
increase of imports from the world into the United States in the subject product categories.
China is already a major producer and exporter of the products in question. China filled its
import quota for the subject products in 2003 and has had very high fill rates in every year for
which data is complete.
The petition demonstrates that China is increasing its textile and apparel production capacity at
unprecedented rates. Chinese government statistics reveal that China has invested $21.2 billion
in its textile and apparel operations over the past three years.
2
The percentage increase is based off of a full year's production for the years 1998 through 2002 - the last year for which full
production data is available.
Petition for Safeguard Action - Imports from China Categories 347/348
page 5
China's ability to penetrate and capture world markets is substantially aided by the existence of
numerous unfair trading practices. For example, China's ability to undercut the prices of its
competitors, including U.S. producers, is a direct result of its resort to unfair trade practices, such
as the manipulation of its currency, direct state subsidization, export tax rebates and the
proliferation of non-performing loans - many of which are in the textile and apparel sectors. All
of these practices have enabled China to undermine free market conditions and give it substantial
capability to disrupt world markets, including the United States.
China’s ability to disrupt the U.S. market is clearly evident from recent quota removal
experience. In virtually every apparel category where quotas were removed in 2002, China has
increased its imports to the U.S. substantially, while cutting prices dramatically. In addition, in
overseas markets similar to the United States where China has not faced quota restraints, it has
moved quickly to dominate those markets.
Further reinforcing the threat of disruption is the fact that the financial condition of the U.S.
industry producing the subject products has worsened, with recent declines in virtually every
measure of financial health, including declines in sales, volume, production, employment, and
capacity utilization.
Petitioners also believe that imports from China of the subject product have already begun to
surge - even in advance of the lifting of quotas. There is strong evidence that imports of cotton
trousers from China are being classified as category 847 products (silk and vegetable fiber
trousers), when in all likelihood some portion of those imports should be classified as category
347 and 348 products.
In addition, virtually every independent study or report that has considered the quota removal
issue has come to the same conclusion - China textile and apparel exports to the U.S. will
accelerate dramatically after quotas are lifted.
All this evidence demonstrates that imports of the subject products from China will increase after
quotas are lifted and contribute to market disruption in the United States.
Implementation of appropriate limitations in January 2005 as provided for in paragraph 11.242
of the Working Party Report is the only avenue by which CITA can avoid market disruption and
the disruption of the orderly development of trade due to imminent increases in imports from
China and the world.
C. PETITIONERS
Petitioners are trade associations and unions which are representative of either domestic
producers of products that are like or directly competitive with the subject products or of
domestic producers of a component used in the production of products that are like or directly
competitive with the subject products.
This Petition is filed on behalf of the following organizations3 which represent U.S.
manufacturers of cotton trousers and trouser components (including fabric):
SEAMS
3
The American Manufacturing Trade Action
Coalition (AMTAC)
A description of each organization and its membership is included in Exhibit 1.
Petition for Safeguard Action - Imports from China Categories 347/348
The National Council of Textile
Organizations (NCTO)
page 6
UNITE HERE!
The National Textile Association (NTA)
D. PRODUCT DESCRIPTION
This Petition is brought with respect to U.S. imports of cotton trousers of Chinese origin and
includes all such products which are classified within categories 347 and 348 of the U.S. Textile
and Apparel Category System.
The subject products are generally considered to be men’s, boys’, women’s and girls’ trousers.
The subheadings of the Harmonized Tariff Schedule of the United States applicable to
Categories 347 and 348 are set out in Exhibit 2.
Imports classified in categories 347 and 348 were covered by the WTO Agreement on Textiles
and Clothing as of the date the WTO Agreement entered into force and are under quota restraints
until January 1, 2005. The U.S. quota on imports of the subject product from China is about 2.5
million dozen in the merged category 347/348. Data from OTEXA4 indicates that China has
filled 59% of this merged category’s quota as of October 6th.
E. IMPORT DATA
Imports of the subject product compete directly with products produced in the U.S. market that
are classified as categories 347 and 348.
As required by the guidelines issued by CITA, this section provides import data concerning the
subject products from all sources and from China.
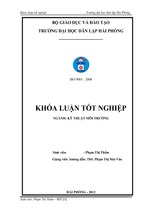
With respect to total imports, the data shows significant increases in the subject products with
total imports rising by 39.5% from 1999 to 2003. Imports from China of the subject products
have been restrained by a quota. China filled its cotton trouser quota, including all available
flexibility, on category 347/348 for the last three full quota years (2001-2003). China even overshipped its quota in some years. That quota was approximately 2.5 million dozen per year.
4
Office of Textile and Apparel, International Trade Administration, U.S. Department of Commerce.
Petition for Safeguard Action - Imports from China Categories 347/348
page 7
Total US Imports 347/348
180,000,000
160,000,000
Quantity (dozens)
140,000,000
120,000,000
100,000,000
80,000,000
60,000,000
40,000,000
20,000,000
0
1999
2000
2001
2002
2003
Chart 1 - Total U.S. Imports 347 and 348
Imports are likely to rise significantly once quotas are removed. According to data compiled by
the Commerce Department5, imports from the world surged following the removal of quota
restraints on 25 apparel categories on January 1, 2002. Imports in these categories increased by
60 percent in two and half years or by 675 million square meters. China played the
overwhelming role in this increase, with Chinese imports increasing by 1 billion square meters
and imports from other countries in the world declining by 369 million square meters. By June
2004, China’s share of these imports rose to 72 percent from 10 percent in 2001 while the share
held by the rest of world fell from 90 percent to 28 percent.
Given the high value added of this category and high corresponding fill rates for quotas imposed
on this category, it is even more likely that imports from the world will increase once quotas are
removed. In addition, imports in this category, despite being restrained by quota in many
countries, have risen consistently over the past five years. This strong likelihood is confirmed by
the enormous increases in another trousers category, Cat. 847 – silk and vegetable fiber trouser –
once quotas were removed. As discussed below, imports in this category increased nearly 400
percent during the past two and half years.
Imports from China on a year-to-date basis for 2004 in the subject category are below the pace
they set in 2003, likely due to several factors: 1) China has over-shipped its quota quantity in
categories 347 and 348 since 2001, including over-shipments in 2003; 2) CITA has announced it
may not allow entry into the United States of any product shipped before January 1, 2005, unless
such product is covered by a quota visa; 3) CITA has announced it will not allow any overshipment of quota in 2004; and 4) CITA has precluded any carry-forward provisions for 2005.
These actions have encouraged China to slightly moderate its exports of the subject products
classified within categories 347 and 348 to the United States until January 1, 2005.
5
Data compiled by the National Council of Textile Organizations,
Petition for Safeguard Action - Imports from China Categories 347/348
page 8
It also appears that imports of cotton trousers from China are either being misclassified as silk
and vegetable fibers in order to be classified as category 847 trousers - a category with no quota
and no applicable duty - or the fiber content of traditionally cotton trousers is being altered
slightly in order to avoid classification as a cotton trouser, signaling a greater increase in Imports
from China of the subject products than is evident from category data. Petitioners present further
evidence of this misclassification in section E-3.
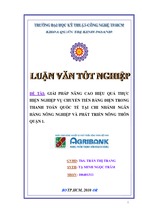
The lifting of quotas on January 1, 2005, has also begun to dampen the outward processing
portion of the U.S. market. While the percentage of total imports of Categories 347/348 from
countries with significant outward processing arrangements grew from 1999 through 2001, that
growth slowed and began to decline by 2003. The lifting of quotas on January 1, 2005, threatens
the outward processing component of the U.S. market for the subject products with market
disruption and threaten to disrupt the orderly development of this portion of the U.S. market.
Outward Processing 347/348 as % of Total US Imports
100%
90%
80%
70%
60%
Outward Processing
50%
Other Imports
40%
30%
20%
10%
0%
1999
2000
2001
2002
2003
Chart 2 - Outward Processing and Total Imports
1. Table Showing Total U.S. Imports
Total Imports
5 Full Years
YTD
January - July
1999
2000
2001
2002
2003
YTD '03
YTD '04
Category 347/348
Quantity (dozens)
111,061,326
125,376,730
126,983,335
140,305,491
154,902,953
Value (U.S. Dollars)
$8,665,584,893
$9,875,274,015
$9,726,253,240
$10,404,744,070
$11,376,203,986
100,209,564
91,509,972
$7,157,249,816
$6,672,791,361
Petition for Safeguard Action - Imports from China Categories 347/348
44,315,704
40,801,400
41,030,711
36,842,313
1Q '03
2Q '03
1Q '04
2Q '04
Quarterly Data
page 9
$3,032,850,068
$2,922,894,167
$2,812,853,946
$2,733,595,142
2. Table Showing Imports from China into the U.S.
Imports From China
5 Full Years
1999
2000
2001
2002
2003
YTD
January-July
YTD '03
YTD '04
Quarterly Data
Category 347/348
Quantity (dozen)
2,465,820
1,870,393
2,607,084
2,787,423
2,475,791
Value (U.S. Dollars)
277,650,437
239,293,674
296,429,654
315,051,379
280,219,838
1,914,478
1,197,444
214,265,298
151,631,268
855,547
755,943
406,070
530,648
95,613,915
82,345,454
50,900,152
67,589,420
1Q '03
2Q '03
1Q '04
2Q '04
Category 347 / 348
China Quota Performance
Quantity
(doz)
Quota
Limits (doz)
Percent
quota filled
1999
2,442,406
2,442,406
100.00%
2000
2001
2002
2003
2,339,195
2,544,403
2,480,353
2,486,743
2,419,985
2,544,403
2,480,353
2,486,743
96.66%
100.00%
100.00%
100.00%
2004
1,429,451
2,421,922
59.02%
5 Full Years
YTD as of 10/6
3. Potential Misclassification of Trouser Imports from China
It appears that imports of the subject products from China significantly exceed the levels
indicated in official U.S. Customs data. China export data available from the Global Trade Atlas
Petition for Safeguard Action - Imports from China Categories 347/348
page 10
Database, together with OTEXA import data and STS Group6 panel data, suggest a very strong
probability that imports of cotton trousers from China are being classified as trousers made from
silk, linen, or ramie (category 847, silk and vegetable fiber trousers) - trousers that have no
current quota limit and that have low or no levels of import duty. This apparent misclassification
is being done either 1) inappropriately in order to avoid applicable duties and quota limits or 2)
deliberately by altering the fabric content to contain more of these vegetable fibers. The
misclassification could be overstating imports of category 847 trousers by as much as 47.7
million units7 and understating imports of the subject products by a similar amount.
Table E-3-1, reflecting Global Trade Atlas Database exports as reported by China, shows
Chinese Exports of M/B and W/G trousers during 2003 to (a) the world, (b) the U.S., (c)
Australia, and (d) Japan. The data indicate that M/B trousers made of fibers other than cotton,
manmade fibers and wool (a part of category 847) accounted for 42% of China’s trouser exports
to the U.S. compared with 12.4% to the world, 11.2% to Australia and 9.9% to Japan. This data
is strong evidence of misclassifications of this product in order to avoid the application of quotas
and to avoid the payment of the appropriate import duty.
Table E-3-1
Exports of M/B & W/G Trousers from China in 2003 -- World and Selected Developed Countries
Fiber Content
Cotton
MMF
Wool
All Other*
TOTAL
World
(Units)
1,536,625,935
1,016,514,717
13,593,434
362,476,587
2,929,210,673
%
52.5%
34.7%
0.5%
12.4%
100.0%
US
(Units)
%
36,137,751
28.5%
20,860,322
16.4%
907,990
0.7%
68,996,767
54.4%
126,902,830 100.0%
Australia
(Units)
%
58,398,013
57.1%
32,395,521
31.7%
143,077
0.1%
11,329,894
11.1%
102,266,505 100.0%
Japan
(Units)
%
220,043,470 59.0%
111,112,149 29.8%
6,761,918
1.8%
34,971,582
9.4%
372,889,119 100.0%
Exports of M/B Trousers from China in 2003 -- World and Selected Developed Countries
Fiber Content
Cotton
MMF
Wool
All Other*
TOTAL
World
(Units)
623,145,135
567,469,323
8,718,934
150,601,340
1,349,934,732
%
46.2%
42.0%
0.6%
11.2%
100.0%
US
(Units)
%
13,221,184
28.7%
12,581,891
27.3%
895,340
1.9%
19,356,131
42.0%
46,054,546 100.0%
Australia
(Units)
%
24,480,160
52.1%
17,274,865
36.8%
120,008
0.3%
5,088,605
10.8%
46,963,638 100.0%
Japan
(Units)
%
88,615,201 49.6%
68,360,935 38.2%
4,101,669
2.3%
17,737,983
9.9%
178,815,788 100.0%
Exports of W/G Trousers from China in 2003 -- World and Selected Developed Countries
Fiber Content
Cotton
MMF
Wool
All Other*
TOTAL
World
(Units)
913,480,800
449,045,394
4,874,500
211,875,247
1,579,275,941
%
57.8%
28.4%
0.3%
13.4%
100.0%
US
(Units)
%
22,916,567
28.3%
8,278,431
10.2%
12,650
0.0%
49,640,636
61.4%
80,848,284 100.0%
Australia
(Units)
%
33,917,853
61.3%
15,120,656
27.3%
23,069
0.0%
6,241,289
11.3%
55,302,867 100.0%
Japan
(Units)
%
131,428,269 67.7%
42,751,214 22.0%
2,660,249
1.4%
17,233,599
8.9%
194,073,331 100.0%
Source: Global Trade Atlas Database - China Exports
* Includes artificial fibers such as viscose rayon, cellulose acetate, cupro or alginates
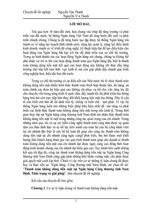
OTEXA data showing U.S. imports of trousers from China show similar fiber distribution
patterns. Chart 2 shows that category 847 trouser imports from China accounted for 10.6% of
5
7
Cambridge, Massachusetts, STS Market Research, Cambridge, Massachusetts.
Based on the probability that the actual level of Chinese silk, ramie and linen M/B trouser exports to the U.S. is closer to 1% (as is the case of
imports from the rest of the world, according to OTEXA data) than 62%.
Petition for Safeguard Action - Imports from China Categories 347/348
page 11
total imports into the U.S. in 2001, rising to a startling 62% during the first seven months of
2004. In contrast, category 847 trouser imports into the U.S. from the rest of the world were
sharply lower and a flat 1% from 2001 through the first seven months of 2004.
Percent of U.S. Total Trouser Imports from China and
Rest of World Accounted for by Category 847
70.00%
60.00%
From China
50.00%
40.00%
30.00%
20.00%
From Rest of World
10.00%
0.00%
2001
2002
2003
2004 est.
Chart 3 - Trouser Imports & ROW (847)8
The substantial increase in category 847 trouser imports coincides with removal of the quota on
the category in January 2002. In the opinion of Petitioners, quota removal provided the
opportunity for a shifting of cotton trouser imports from China into category 847, either
illegitimately or by altering fabric blends. In the first seven months of 2004, trousers classified
as category 847 were entering the U.S. market at an annualized rate of 229 million pair from
China alone. Imports from China increased more than 2,000 percent in less than four years, from
11 million pair in 2001 to an annual rate of 229 million pair for 2004. Imports from China in
2004 are over four times the total imports from the world in 2002.
Imports from China, Category 847 - SMEs
180,000,000
160,000,000
140,000,000
120,000,000
China
World less China
100,000,000
80,000,000
60,000,000
40,000,000
20,000,000
2001
2002
2003
Chart 4 - Imports from China, 847
8
Source, OTEXA
YTD Jul 04
Petition for Safeguard Action - Imports from China Categories 347/348
page 12
China accounted for all the increase in U.S. imports classified as category 847. This is an
incredibly high level of imports for trousers other than cotton, manmade fibers or wool. If the
U.S. retail market in fact supported the increased level of 847 imports, it is reasonable to expect
that at least some of the demand would have been satisfied by imports from sources other than
China.
In order to be believed, the increase in imports of this category of trousers would have to
correspond with an unprecedented increase in total U.S. apparent consumption of this same
product. The Commerce Department does not keep production data on this category of trousers
as it believes there is virtually no U.S. production. Therefore, Commerce data treats total
imports are total apparent consumption. As the following chart demonstrates, there has been a
supposed increase in apparent consumption for linen, ramie and silk trousers from under 5
million dozen in 2002 to over 20 million dozen in 2004.
When the imports are further broken down, the bulk of the Chinese imports in category 847 are
entering as women’s shorts and trousers made of ramie or linen. If these imports are classified
correctly, then a startling transformation of buying patterns will have taken place. American
women would have changed their buying habits to become enormous purchasers of ramie and
linen trousers, which would account for one out of every eight women’s trousers and pants sold
in the United States.9
U.S. Imports of Category 847 (total apparent consumption)
Silk & Non-Cotton Vegetable Fiber Trousers
25
20
Million Dozens
World
China
15
10
5
0
1989
1990
1991
1992
1993
1994
1995
1996
1997
1998
1999
2000
2001
2002
2003
2004
est.
Chart 5 - Total U.S. Consumption, Category 847 / Imports from China
However, retail market data gathered by petitioners shows no comparable increase in the market
for this product. Petitioners believe that such fibers account for less than 1% of the U.S. retail
market for trousers. Panel data from STS Group which provides insight into the makeup of the
9
Linen and ramie imports of women’s trousers from China totaled 8.5 million dozen for year-to-date July 2004, out of total
worldwide imports of women’s trousers of 62.8 million dozen, or 13.5 percent.
Petition for Safeguard Action - Imports from China Categories 347/348
page 13
U.S. trouser market gets so few responses from panelists that purchase mens and boys trousers of
this fabric that no data are even reported for the category.
Petitioners have uncovered no domestic data on retail purchases of trousers that remotely
supports any increase in consumption in this category - much less a 400% increase. This data
indicates that either there would have to be a sea change in demand for linen, ramie, and silk
trousers in the United States and all other market indicators would have to be wrong, or that
much of the product from China being classified as category 847 is, in fact, cotton, wool, or
man-made product.
If only one-third of this increase in shipments is estimated to be cotton trousers (with one-third
wool and one-third man-made products), this would equate to around 5.6 million dozen cotton
trousers. China's import limitation for cotton trousers in 2003 was about 2.5 million dozen.
This is strong evidence that (1) Exports from China of 847 trousers into the U.S. market are
being misclassified for purposes of quota circumvention and duty avoidance,10 (2) imports of
cotton trousers from China are being significantly understated by official Customs and OTEXA11
data, (3) exporters and importers of cotton trousers are taking extreme measures in order to
increase market share in the United States even in advance of the lifting of quotas, and (4) there
is a threat of even greater disruption of the orderly development of trade when remaining textile
quotas are removed on January 1, 2005.
F. PRODUCTION DATA
The production of the subject product is a significant component of the U.S. textile and apparel
manufacturing sectors. The U.S. produces more cotton trousers than any other major apparel
product. The U.S. produced close to 46 million dozen trousers (categories 347 & 348) during the
October 2002-September 2003 period and nearly 50 million dozen in 2002 - down by almost 15
million dozen from the level produced in 1999.
10
Duty savings from misclassifying these goods are substantial. Duties for cotton and man-made fiber trousers range from 13.6
to 28.6 percent. Over three quarters of the imports from China in 847 are entering under a duty rate of 2.8 percent.
11
The following report from Women's Wear Daily is insightful: "At denim manufacturer Changzhou Shuangyan Dyeing &
Weaving Co., deputy general manager Chen Xu Da said one of his company's key products is denim fabric made with a blend
of ramie fibers, rather than the fabric's traditional cotton construction. Demand for ramie denim took off last year after
importers realized China was rarely filling its quotas for ramie fabrics -- and thus the quota charges remained low. Chen said
his factory, based in Changzhou in Jiangsu province, wouldn't likely have much demand for ramie cotton blends once the
restraints are lifted." Malone, Scott, Chinese prep for 2005; World Trade Organization nations will drop apparel and textile
import quotas on January 1, Women's Wear Daily, June 22, 2004.
Petition for Safeguard Action - Imports from China Categories 347/348
page 14
US Production of Textiles and Apparel - Top 10 Categories (Ranked based on YE Sept. 2003 data)
Estimated US Production
YE Sept. 2003
Category (top 10)
(million square meters
equivalent)
Cotton Trousers
347/348
Underwear
352/652
332/432/632-part Socks
Cotton Knit Shirts &
Blouses
338/339
Dresses
336/636
MMF Knite Shirts &
Blouses
638/639
MMF Trousers
647/648
Pajamas & Other
Nightware
351/651
Men's and Boys'
Woven Shirts
340/640
Women's & Girls'
Woven Blouses
341/641
Amount of Production - Thousand Dozen
682
642
631*
1999
64,472
138,714
209,774
2000
58,643
121,029
214,968
2001
51,928
90,293
207,321
2002
YE Sept. 2003
49,864
45,788
74,856
63,112
184,820
166,056
489
349
108,471
16,172
110,050
13,839
96,947
10,577
78,579
10,481
81,531
9,212
234
200
21,204
19,444
17,328
18,502
16,800
18,345
17,176
13,936
16,731
13,391
133
5,515
4,888
4,860
3,690
3,050
107
8,680
9,528
7,209
6,063
5,339
107
13,497
13,625
11,379
10,616
8,813
* Ranking is based on year ending September 2003 production multiplied by the applicable conversion factor in the Correlation, the official
OTEXA publication used to categorize textile imports. The U.S. sock production figure used is for calendar year 2003, since production data
are not available from OTEXA's I/P book.
U.S. production of the subject products has declined each year since 1998, and in 2002 was
nearly 24% below 1998 production levels. In raw numbers, U.S. production fell by nearly 16
million dozen in just four years. The latest data also shows a continuation of that trend in the
first three quarters of 2003, with year-to-date production down by more than 4 million dozen, or
10.7 percent, from the first three quarters of 2002. This indicates that, after a decline in
production of “only” 4 percent in 2002, U.S. production has begun to again fall rapidly, and the
final percentage decline in production for 2003 could approach 2001’s drop of 11.5 percent.
U.S. Production
5 Full Years
1998
1999
2000
2001
2002
Category 347/348
Quantity (thousand dozen)
65,482
64,472
58,643
51,928
49,864
YTD
January Sept.
YTD '02
38,078
YTD '03
34,001
Year Ending
Sept. 02
Sept. 03
49,556
45,788
According to the Bureau of Labor Statistics, the U.S. cut and sew apparel manufacturing sector
employed an average of 703,800 people in 1994. By 2003, the number of employees in this
sector had declined to an annual average of 244,600.
Petition for Safeguard Action - Imports from China Categories 347/348
page 15
U.S. Cut and Sew Apparel Employees
800
700
600
Thousands
500
400
300
200
100
Ja
nM 94
ay
Se 9 4
p9
Ja 4
nM 95
ay
Se 9 5
p9
Ja 5
nM 96
ay
Se 9 6
p9
Ja 6
nM 97
ay
Se 9 7
p9
Ja 7
nM 98
ay
Se 9 8
p9
Ja 8
nM 99
ay
Se 9 9
p9
Ja 9
nM 00
ay
Se 0 0
p0
Ja 0
nM 01
ay
Se 0 1
p0
Ja 1
nM 02
ay
Se 0 2
p0
Ja 2
nM 03
ay
Se 0 3
p0
Ja 3
nM 04
ay
-0
4
0
G. MARKET SHARE DATA
In every year between 1998 and 2002 (the last full year reported), the U.S. industry's share of the
U.S. market of the subject products has declined, while import market share has increased. The
ratio of imports to domestic production of the subject products has increased from 150 percent in
1998 to over 280 percent in 2002. China's share of the U.S. market has remained relatively
stable, owing to the existence of import quotas on the subject products.
However, when one examines the misclassification or product shifting that is ongoing with
respect to imports of trousers, it is likely that official Customs data understates China's total
market share in the cotton trouser categories and that China's market share has been growing even though China's quota level should have restrained its market share at around 2 percent or
below.
Compiled Data /
Prod. & Imports
Calendar
Years
YTD
Jan - Sept
YE
Sept
Category 347/348 (Quantity = Thousand Dozens)
US Production
Total Domestic Market
1998
1999
2000
2001
2002
65,482
64,472
58,643
51,928
49,864
Total Imports
98,410
111,061
125,377
126,983
140,305
163,892
175,533
184,020
178,911
190,170
China Imports
2,494
2,466
1,870
2,607
2,787
YTD '02
YTD '03
38,078
34,001
107,558
122,427
145,636
156,428
888
882
YE '02
YE '03
49,556
45,788
134,892
155,174
184,449
200,962
1,151
1,078
Petition for Safeguard Action - Imports from China Categories 347/348
page 16
Category 347/348 (% of total market based on quantities)
Compiled Data /
Market Shares
5 Full Years
YTD
Jan - Sept
YE
Sept
U.S. Market Share
(% of total market)
39.95%
36.73%
31.87%
29.02%
26.22%
Import Market Share
(% of total market)
60.05%
63.27%
68.13%
70.98%
73.78%
YTD '02
YTD '03
26.15%
21.74%
73.85%
78.26%
145,636
156,428
0.61%
0.56%
YE '02
YE '03
26.87%
22.78%
73.13%
77.22%
184,449
200,962
0.62%
0.54%
1998
1999
2000
2001
2002
Total Domestic Market
China Mkt. Share
(Thousand Dozen)
(% of total market)
163,892
1.52%
175,533
1.40%
184,020
1.02%
178,911
1.46%
190,170
1.47%
Category 347/348 (% of change year to year)
Market Shares - Additional
Information
5 Full Years
1998
1999
2000
2001
2002
US Production - % change Total imports - % change from prev.
from prev. year
year
-3.7%
-1.5%
-9.0%
-11.5%
-4.0%
·
YTD
Jan - Sept
YTD '02
YTD '03
-7.6%
YE
Sept
YE '02
YE '03
-10.7%
·
16.6%
12.9%
12.9%
1.3%
10.5%
·
15.0%
·
13.8%
Total Domestic Market - %
change from prev. year
Ratio - Imports to
Domestic Prod.
China Imports - % change
from prev. year
7.6%
7.1%
4.8%
-2.8%
6.3%
150.3%
172.3%
213.8%
244.5%
281.4%
-5.9%
-1.1%
-24.2%
39.4%
6.9%
·
282.5%
360.1%
-0.7%
·
272.2%
338.9%
-6.3%
9.0%
6.9%
·
·
H. THE THREAT OF INCREASED IMPORTS FROM CHINA
There is strong and compelling evidence from many sources that imports of the subject products
from China will increase when quotas are removed on January 1.
1.
Growth in textile and apparel production capacity in China has occurred at an
astounding rate, demonstrating the country's commitment to accelerated market share
in textiles and apparel worldwide;
2.
China has moved quickly to dominate the market in virtually all apparel categories
removed from quota control;
3.
China has engaged in significant price cutting in order to rapidly accumulate orders in
every category removed from quota in the U.S. market;
4.
There is a general agreement by academicians, analysts and international institutions
that China will dominate world trade in apparel, and particularly the U.S. market;
5.
There have been consistent statements by executives from major suppliers, retailers
and sourcing agents that China will dominate world trade in apparel, and particularly
the U.S. market;
6.
In other developed markets similar to the United States where quotas were removed,
China moved quickly to dominate them; and
Petition for Safeguard Action - Imports from China Categories 347/348
7.
page 17
China continues to engage in a variety of unfair trade practices, including currency
manipulation, that allow Chinese textile and apparel manufacturers to undercut U.S.
and other competitors' prices.
1. Growth in China's Productive Capacity for Textiles and Apparel
China's capacity to produce the subject products and other cotton apparel products has increased
dramatically in recent years12 clearly demonstrating that imports from China will increase in
2005. China has been aggressively buying textile and apparel machinery for the past four years,
in some cases consuming up to two-thirds of world production of textile machinery (i.e.
broadwoven fabric looms). Chinese government statistics reveal that China has invested $21.2
billion in textile and apparel sector since 2001.
China’s garment industry, already by far the largest in the world, has been expanding rapidly in
order to take advantage of the removal of quotas. According to the CEIC Economic Database,13
China’s production of garments has expanded by 50 percent during just the past four years,
growing from 6.9 billion pieces in 2000 to 10.3 billion pieces in 2003.
As noted by the International Trade Commission, the "size and performance of the world textile
industry can be measured in terms of mill consumption of fibers, installed spinning and weaving
capacity, and investment in new production equipment....there has been a shift of world yarn
spinning and fabric weaving capacity from developed countries to developing countries in the
past two decades. Most of the increase in production capacity has occurred in Asia, particularly
China, which along with India, has the largest number of spindles and weaving machines in the
world. Growth of spinning and weaving capacity in China and India has been facilitated by
strong demand for their exports of downstream textile goods."14
The ITC report goes on to note that "mill fiber consumption in China far exceeded that of any
other developing country .... China alone accounted for 29 percent (34.7 billion pounds) of the
12
"In 2001, China imported the advanced textile machinery in value of U.S.$2.5 billion, 31.4% up as against 2000. And the
textile machinery imports for the first half of 2002 has already reached U.S.$1.3 billion, a 5.82% up against the same period of
last year; 2001 saw an import of 5.9526 million tons of dyestuffs and textile chemicals, 22.75% up against 2000, and from 1-6
months this year, this import arrived at 3.69 million tons, 37.71% growth compared with the same period of last year."
Statement of Mr. Du Yuzhou, President of China National Textile Industry Council (2002), as reported at
http://www.cntextile.com/cntex/english2/2002_du.htm.
Also see, "The country's import textile machinery reached 4,372,090,000 U.S. dollars in 2003, an increase of 24.26 percent
over the previous year. Of this, import in December was 452.04 million U.S. dollars, rising 27.6 percent over the previous
month. The biggest importers of textile machinery were Zhejiang Province to reach 1,167,210,000 U.S. dollars and Jiangsu
Province to 1,118,070,000. The two accounted for 48.67 percent of the total, rising 3.6 percentage points over the previous
year. ... Looms and knitting machinery took up the biggest part of the import, followed by spinning and dyeing and printing
machinery. Import of looms was 921.40 million U.S. dollars; knitting machine, 834.85 million U.S. dollars; spinning
machinery, 732.72 million U.S. dollars, and dyeing and printing machine, 745.38 million U.S. dollars. Import value of
knitting machinery jumped 34.72 percent and the price increased 52.54 percent." China's fast development of textile industry
has spurred a fast growth of imports of textile machinery, Xinhua Economic News Service, April 7, 2004.
13
14
CEIC Data Ltd ("CEIC") has had over 12 years of well-regarded reputation in the financial information service industry,
specializing in providing high quality, comprehensive databases, focusing on Asia economic, industrial and financial time
series data.
ITC Report, page 1-19.
Petition for Safeguard Action - Imports from China Categories 347/348
page 18
world total in 2001; its mill consumption rose three times as fast as that for the world during
1997 through 2001 (39 percent versus 13 percent)."15
Mill use of cotton in China continues to skyrocket and is supplemented with significant
purchases of cotton fabric and cotton yarn from around the world.
China Cotton Yarn Imports
China Cotton Woven Fabric Imports
800,000
1,560,000,000
1,540,000,000
700,000
China Cotton Woven Fabric Imports
1,520,000,000
China Cotton Yarn Imports
600,000
500,000
1,480,000,000
Metric Tons
Meters
1,500,000,000
1,460,000,000
1,440,000,000
400,000
300,000
1,420,000,000
200,000
1,400,000,000
100,000
1,380,000,000
1999
2000
2001
2002
2003
1999
2000
2001
2002
2003
Chart 6- Source, Global Trade Atlas Database
China Cotton Mill Use
(Source: USDA/FAS PSD Database)
China Cotton Mill Use
8,000,000
Metric Tons
4,223,895
4,343,645
4,169,464
4,071,487
4,637,576
5,116,574
5,715,322
6,510,024
7,054,340
7,511,566
Million Bales
19.39
19.94
19.14
18.69
21.29
23.49
26.23
29.88
32.38
34.48
7,000,000
6,000,000
Metric Tons
Crop Year
1995
1996
1997
1998
1999
2000
2001
2002
2003
2004
5,000,000
4,000,000
3,000,000
2,000,000
1,000,000
0
1998
1999
2000
2001
2002
2003
2004
Crop Year
Increase since '98
84%
Petitioners attempted to discover the names and addresses of manufacturers of cotton trousers in
China. A list of those manufacturers reasonably believed by Petitioners to produce the subject
products is attached as Exhibit 4. Petitioners do not assert that this list is complete.
In its 2004 Report to Congress, the U.S.-China Economic and Security Review Commission
stated:
15
Id. See, ITC discussion of Yarn and Fabric production Capacity, pp. 1-19 - 1-22 of the ITC Report.
Petition for Safeguard Action - Imports from China Categories 347/348
page 19
China is continuing to attract massive levels of foreign direct investment (FDI), including
$57 billion in 2003. Its policies to attract FDI have been supplemented by industrial
policies aimed at developing national productive capacity in selected “pillar” industries.
These policies support Chinese corporations through a wide range of measures that
include tariffs, limitations on access to domestic marketing channels, requirements for
technology transfer, government selection of partners for major international joint
ventures, preferential loans from state banks, subsidized credit, privileged access to
listings on national and international stock markets, discriminatory tax relief, privileged
access to land, and direct support for R&D from the government budget. Such policies
give Chinese industry an unfair competitive advantage, thereby contributing to erosion of
the U.S. manufacturing base. Many of these policies are not permitted under World Trade
Organization (WTO) and U.S. trade rules.16
China has now overtaken the United States as the world's largest recipient of foreign direct
investment.
Major Textile Machinery Imports
2002 (in units)
Item
Automatic Spooling
1,186
Rapier Looms
5,873
Water-jet Looms
9,589
Air-Jet Looms
14,963
Washing, Bleaching, Dyeing Machines
4,582
% Change from 2001
23.54%
67.61%
71.82%
108.31%
51.82%
Source: China National Textile Industry Council,
2002/2003 Report on China Textile Industry Development
News reports consistently cite increases in the buildup of production capacity in China.17
Chinese government statistics showed that last year there were 3,784 textile plants
under construction in China, with $180 billion in outstanding planned investment and
$78 billion poured into new production in 2003.18
A new survey of Chinese apparel manufacturers by Global Sources, a large broker for
many Chinese exports, found that 89 percent of them were planning to expand output
after the global end of apparel quotas. Half the 215 companies surveyed planned to
increase production capacity by 20 to 50 percent, and several other companies
intended to expand capacity by more than 50 percent.19
Total investment in the textile sector is up significantly in China. It is reported that
there are 90 million people directly or indirectly employed in the Chinese textile
industry.20
16
2004 Report to Congress of the U.S.-China Economic and Security Review Commission, June 2004. The report is available
online at http://www.uscc.gov/researchreports/2004/04annual.report.pdf.
17
See also, Gerber Technology Embarks on Chinese Expansion, just-style.com, September 24, 2004, CAD/CAM supplier
Gerber Technology has expanded its Advanced Technology Center in China in anticipation of a surge in business after quota
phase-out.
18
China Surge Big Topic at Cotton Meet, Women's Wear Daily, March 3, 2004.
19
U.S. Weighs Import Limits on China, The New York Times, September 11, 2004.
20
China: Stick to WTO Rules, Commerce Minister Urges, just-style.com, September 20, 2004.
Petition for Safeguard Action - Imports from China Categories 347/348
page 20
China: Cum ulative Fixed Asset Investm ent
in the Textile Industry (Bil US$)
C um ulative Annual T otal
Am ount
% C hange
1999
1.64318 --2000
2.48413
51.2%
2001
3.54893
42.9%
2002
4.34511
22.4%
2003
7.24306
66.7%
2004
5.99555
29.3%
Note: Excluding investm ent by rural collectives and urban and rural individuals.
Sources: State Developm ent Planning C om m ission, National Bureau of Statistics and SIC .
2. China Dominates the Market in Apparel Categories Previously Removed From Quotas
Further evidence that imports from China will increase once quotas are removed can be found in
apparel categories where quotas have already been removed. China consistently dominates trade
in those apparel categories. U.S. Commerce Department data show that China increased its
market share from 10 percent in 2001 (quotas still in place) to 72 percent as of year to date June
2004. China’s share is still increasing and is predicted to reach between 75 percent and 80
percent of the U.S. market by the end of the year.21
Imports from China in these product categories grew by 1,009 percent or 1.05 billion square
meters during the two and half year period after quotas were removed. Imports by the rest of the
world fell from a 90 percent market share to 28 percent while shipments by the rest of the world
fell by 370 million square meters. The difference between of the rise in imports from China and
the decline in imports from other suppliers – a difference of 635 million square meters –
indicates that damage was inflicted both on U.S. domestic producers and other foreign suppliers.
China’s share of the U.S. market increased dramatically in every single apparel category
removed from quota control. China’s lowest share in a product category in June 2004 was 42
percent of the market (category 630 - man-made fiber gloves); the highest was 100% (category
834 – men’s vegetable fiber coats).
Petitioners have already questioned whether imports from China being classified as category 847
products are being misclassified. Even if such imports are not being misclassified and are simply
being altered to contain other fiber content, they are relevant to this petition as they compete
directly with the subject products. Quotas were removed from the 847 category on January 1,
2002. The results follow the pattern for other apparel categories removed from quota as
described in the previous paragraph.
In 2001, China filled only seventy percent of its category 847 quota and shipped less than one
million dozen of these trousers, holding a 26 percent share of the U.S. import market. From an
average price of $96.45 per dozen in 2001, the last year of the quota, China’s prices fell to
$59.75 for the year ending June 2004, a 38 percent decline over a two and one half year period.
U.S. imports of category 847 from China rose from 932 thousand dozen in 2001 to 15 million
21
Results of a tracking study by the National Council of Textile Organizations (NCTO) on the impact of China on the apparel
categories released from quota control in 2002.
- Xem thêm -