VIETNAM NATIONAL UNIVERSITY - HO CHI MINH CITY
HO CHI MINH UNIVERSITY OF TECHNOLOGY
COMPUTER SCIENCE AND ENGINEERING FACULTY
——————– * ———————
GRADUATION THESIS
Building A Diagram Recognition Problem
with Machine Vision Approach
Council: Computer Science
Advisor: Dr. Nguyen Duc Dung
Reviewer: Dr. Nguyen An Khuong
—o0o—
Student:
Tran Hoang Thinh 1752516
HO CHI MINH CITY, 08/2021
ĐẠI HỌC QUỐC GIA TP.HCM
---------TRƯỜNG ĐẠI HỌC BÁCH KHOA
KHOA: KH & KT Máy tính___
BỘ MÔN: KHMT___________
CỘNG HÒA XÃ HỘI CHỦ NGHĨA VIỆT NAM
Độc lập - Tự do - Hạnh phúc
NHIỆM VỤ LUẬN ÁN TỐT NGHIỆP
Chú ý: Sinh viên phải dán tờ này vào trang nhất của bản thuyết trình
HỌ VÀ TÊN: Trần Hoàng Thịnh ______________________ MSSV: 1752516 _______
HỌ VÀ TÊN: _____________________________________ MSSV: ______________
HỌ VÀ TÊN: _____________________________________ MSSV: ______________
NGÀNH: ___________________________________ LỚP: ______________________
1. Đầu đề luận án:
Building A Diagram Recognition Problem with Machine Vision Approach
2. Nhiệm vụ đề tài (yêu cầu về nội dung và số liệu ban đầu):
- Investigate approaches in diagram recognition problem
- Research on machine learning approaches for the problem
- Prepare data for the problem.
- Propose and implement the diagram recognition system
- Evaluate the proposed model
3. Ngày giao nhiệm vụ luận án: 1/3/2021
4. Ngày hoàn thành nhiệm vụ: 30/6/2021
5. Họ tên giảng viên hướng dẫn:
Phần hướng dẫn:
1) Nguyễn Đức Dũng __________________________________________________________
2) _________________________________________________________________________
3) _________________________________________________________________________
Nội dung và yêu cầu LVTN đã được thông qua Bộ môn.
Ngày ........ tháng ......... năm ..........
CHỦ NHIỆM BỘ MÔN
GIẢNG VIÊN HƯỚNG DẪN CHÍNH
(Ký và ghi rõ họ tên)
(Ký và ghi rõ họ tên)
PHẦN DÀNH CHO KHOA, BỘ MÔN:
Người duyệt (chấm sơ bộ): ________________________
Đơn vị: _______________________________________
Ngày bảo vệ: ___________________________________
Điểm tổng kết: __________________________________
Nơi lưu trữ luận án: ______________________________
TRƯỜNG ĐẠI HỌC BÁCH KHOA
KHOA KH & KT MÁY TÍNH
CỘNG HÒA XÃ HỘI CHỦ NGHĨA VIỆT NAM
Độc lập - Tự do - Hạnh phúc
---------------------------Ngày 01 tháng 08 năm 2021
PHIẾU CHẤM BẢO VỆ LVTN
(Dành cho người hướng dẫn/phản biện)
1. Họ và tên SV: Trần Hoàng Thịnh
MSSV: 1752516
Ngành (chuyên ngành): Computer Science
2. Đề tài: Building A Diagram Recognition Problem with Machine Vision Approach
3. Họ tên người hướng dẫn/phản biện: Nguyễn Đức Dũng
4. Tổng quát về bản thuyết minh:
Số trang:
Số chương:
Số bảng số liệu
Số hình vẽ:
Số tài liệu tham khảo:
Phần mềm tính toán:
Hiện vật (sản phẩm)
5. Tổng quát về các bản vẽ:
- Số bản vẽ:
Bản A1:
Bản A2:
Khổ khác:
- Số bản vẽ vẽ tay
Số bản vẽ trên máy tính:
6. Những ưu điểm chính của LVTN:
The team has successfully proposed the diagram recognition system. They built the initial dataset
and perform labeling the data for this task. The team has utilized their knowledge in computer
vision and machine learning to propose a suitable approach for this problem. The evaluation results
are promising.
7. Những thiếu sót chính của LVTN:
The dataset they built is still small and the number of components that this model can recognize is
also limited. Even obtained high accuracy, the team has not performed experiments under real
conditions, i.e. image captured with shadows, low contrast, thin sketches, etc.
8. Đề nghị: Được bảo vệ o
Bổ sung thêm để bảo vệ o
9. 3 câu hỏi SV phải trả lời trước Hội đồng:
a.
Không được bảo vệ o
b.
c.
10. Đánh giá chung (bằng chữ: giỏi, khá, TB): Giỏi
Điểm: 9 /10
Ký tên (ghi rõ họ tên)
Nguyễn Đức Dũng
TRƯỜNG ĐẠI HỌC BÁCH KHOA
KHOA KH & KT MÁY TÍNH
CỘNG HÒA XÃ HỘI CHỦ NGHĨA VIỆT NAM
Độc lập - Tự do - Hạnh phúc
---------------------------Ngày 1 tháng 8 năm 2021
PHIẾU CHẤM BẢO VỆ LVTN
(Dành cho người hướng dẫn/phản biện)
1. Họ và tên SV: Trần Hoàng Thịnh
MSSV: 1752516
Ngành (chuyên ngành): Computer Science
2. Đề tài: “Building A Diagram Recognition Problem with Machine Vision Approach”
3. Họ tên người phản biện: Nguyễn An Khương
4. Tổng quát về bản thuyết minh:
Số trang: 35
Số bảng số liệu: 4
Số tài liệu tham khảo: 53
Hiện vật (sản phẩm)
5. Tổng quát về các bản vẽ:
- Số bản vẽ:
Bản A1:
- Số bản vẽ vẽ tay
Số chương: 6
Số hình vẽ: 18
Phần mềm tính toán:
Bản A2:
Khổ khác:
Số bản vẽ trên máy tính:
6. Những ưu điểm chính của LVTN:
Thesis topic is interesting and well-choosen. The author clearly understands the problem to
be solved and masters the techniques and background knowledge to solve the problem.
The author proposes three algorithms: Algorithms 2 for improving Non Max Suppression,
and Algorithms 3,4 for diagram building.
The thesis uses Mask R-CNN model and its variant, Keypoint R-CNN with some
improvements and augmentation to solve offline diagram recognition task with rather high
accuracy (~90%) and acceptable performance (< 2s for each diagram).
7. Những thiếu sót chính của LVTN:
The thesis is not well-written and too short.
The contributions of the author are not presented in a clear maner.
8. Đề nghị: Được bảo vệ
Bổ sung thêm để bảo vệ
Không được bảo vệ
9. Câu hỏi SV phải trả lời trước Hội đồng:
a. Is there any commercial or prototype app/software that solve this problem or similar ones? If
YES, can you give some comments and remarks on benchmarking your work and those?
b. Arrow keypoints seem often coincide with one border of the bounding box, so how should
we do to reduce overlap task between arrow keypoint detection and bounding box detection?
10. Đánh giá chung (bằng chữ: giỏi, khá, TB): Excellent
Điểm: 9/10
Ký tên (ghi rõ họ tên)
Nguyễn An Khương
Declaration
We hereby undertake that this is our own research project under the guidance of Dr.
Nguyen. Research content and results are truthful and have never been published before.
The data used for the analysis and comments are collected by us from many different
sources and will be clearly stated in the references.
In addition, we also use several reviews and figures of other authors and organizations.
All have citations and origins.
If we detect any fraud, we take full responsibility for the content of our graduate internship. Ho Chi Minh City University of Technology is not related to the copyright and
copyright infringement caused by us in the implementation process.
Best regards,
Tran Hoang Thinh
Acknowledgments
First and foremost, we would like to express our sincere gratitude to our advisor Dr.
Nguyen Duc Dung for the support of our thesis for his patience, enthusiasm, experience,
and knowledge. He shared his experience and knowledge which helps us in our research and
how to provide a good thesis. We also want to thank Dr. Nguyen An Khuong and Dr. Le
Thanh Sach for their support in reviewing our thesis proposal and thesis. Finally, we would
like to show our appreciation to Computer Science Faculty and Ho Chi Minh University of
Technology for providing an academic environment for us to become what we are today.
Best regards,
Tran Hoang Thinh
Abstract
Diagram has been one of the most effective illustrating tools for demonstrating and sharing ideas
and suggestions among others. Besides text and images, drawing flow charts is the best way to
give others a clearer path of the plan with the least amount of work. Nowadays, many meetings
require a blackboard so everyone can express their thoughts. This raises a problem with saving
these drawings as a reference for future use since taking a picture can not solve the problem
of re-editing these ideas and they need to be redrawn to be suitable in professional documents.
On the other hand, digitizing the chart requires redrawing the entire diagram using a computer
or a special device like drawing boards and digital pens, which cost a lot and are not the most
convenient tools to use.
Therefore, it is necessary to find a way to convert the current, traditional hand-drawing
diagrams into a digital version, simplifying the sharing process between users. Moreover, the
digitizing diagram also helps the user to modify and convert to other forms that satisfy their
requirements. This thesis will focus on stating a problem with digitizing diagrams and proposing
the solution.
Contents
1
Introduction
1.1 Overview . . . . . . . . . . . . . . . . . . . . . . . . . . . . . . . . . . . . .
1.2 Outline . . . . . . . . . . . . . . . . . . . . . . . . . . . . . . . . . . . . . .
1.3 Objectives . . . . . . . . . . . . . . . . . . . . . . . . . . . . . . . . . . . . .
1
1
2
2
2
Related works
2.1 Object detection methods . . . . . . . . . . . . . . . . . . . . . . . . . . . . .
2.1.1 Introduction . . . . . . . . . . . . . . . . . . . . . . . . . . . . . . . .
2.1.2 Traditional detector . . . . . . . . . . . . . . . . . . . . . . . . . . . .
2.1.3 CNN-based Detector . . . . . . . . . . . . . . . . . . . . . . . . . . .
2.1.3.1 CNN-based Two Stages Detection (Region Proposal based) .
2.1.3.2 CNN-based One Stage Detection (Regression/Classification
based) . . . . . . . . . . . . . . . . . . . . . . . . . . . . .
2.2 Diagram recognition . . . . . . . . . . . . . . . . . . . . . . . . . . . . . . .
3
3
3
3
4
4
3
4
Background
3.1 Faster R-CNN . . . . . . . . . . . .
3.1.1 Backbone network . . . . .
3.1.2 Region Proposal Network .
3.1.3 Non-Maximum Suppression
3.2 Mask R-CNN . . . . . . . . . . . .
3.2.1 Binary Masks . . . . . . . .
3.2.2 Feature Pyramid Network .
3.2.3 Region of Interest Align . .
3.3 Keypoint R-CNN . . . . . . . . . .
.
.
.
.
.
.
.
.
.
.
.
.
.
.
.
.
.
.
Proposed method
4.1 Scope of the thesis . . . . . . . . . . .
4.2 Problem statement . . . . . . . . . . .
4.2.1 Problem definition . . . . . . .
4.2.2 Approaches . . . . . . . . . . .
4.2.3 Preparing input . . . . . . . . .
4.3 Proposed model . . . . . . . . . . . . .
4.3.1 Model selection . . . . . . . . .
4.3.2 Proposed model . . . . . . . . .
4.3.2.1 Feature map generator
4.3.2.2 Proposal generator . .
4.3.2.3 Instance generator . .
4.3.3 Loss function and summary . .
i
.
.
.
.
.
.
.
.
.
.
.
.
.
.
.
.
.
.
.
.
.
.
.
.
.
.
.
.
.
.
.
.
.
.
.
.
.
.
.
.
.
.
.
.
.
.
.
.
.
.
.
.
.
.
.
.
.
.
.
.
.
.
.
.
.
.
.
.
.
.
.
.
.
.
.
.
.
.
.
.
.
.
.
.
.
.
.
.
.
.
.
.
.
.
.
.
.
.
.
.
.
.
.
.
.
.
.
.
.
.
.
.
.
.
.
.
.
.
.
.
.
.
.
.
.
.
.
.
.
.
.
.
.
.
.
.
.
.
.
.
.
.
.
.
.
.
.
.
.
.
.
.
.
.
.
.
.
.
.
.
.
.
.
.
.
.
.
.
.
.
.
.
.
.
.
.
.
.
.
.
.
.
.
.
.
.
.
.
.
.
.
.
.
.
.
.
.
.
.
.
.
.
.
.
.
.
.
.
.
.
.
.
.
.
.
.
.
.
.
.
.
.
.
.
.
.
.
.
.
.
.
.
.
.
.
.
.
.
.
.
.
.
.
.
.
.
.
.
.
.
.
.
.
.
.
.
.
.
.
.
.
.
.
.
.
.
.
.
.
.
.
.
.
.
.
.
.
.
.
.
.
.
.
.
.
.
.
.
.
.
.
.
.
.
.
.
.
.
.
.
.
.
.
.
.
.
.
.
.
.
.
.
.
.
.
.
.
.
.
.
.
.
.
.
.
.
.
.
.
.
.
.
.
.
.
.
.
.
.
.
.
.
.
.
.
.
.
.
.
.
.
.
.
.
.
.
.
.
.
.
.
.
.
.
.
.
.
.
.
.
.
.
.
.
.
.
.
.
.
.
.
.
.
.
.
.
.
.
.
.
.
.
.
.
.
.
.
.
.
.
.
.
.
.
.
.
.
.
.
.
.
.
.
.
.
.
.
.
.
.
5
6
.
.
.
.
.
.
.
.
.
7
7
7
8
9
11
11
12
13
15
.
.
.
.
.
.
.
.
.
.
.
.
17
17
18
18
18
19
24
24
26
26
27
29
30
4.4
5
6
Diagram building . . . . . . . . . .
4.4.1 Output . . . . . . . . . . .
4.4.2 Arrow refinement . . . . . .
4.4.3 Symbol-Arrow relationship .
4.4.4 Text-Others relationship . .
.
.
.
.
.
.
.
.
.
.
.
.
.
.
.
.
.
.
.
.
.
.
.
.
.
.
.
.
.
.
.
.
.
.
.
.
.
.
.
.
.
.
.
.
.
.
.
.
.
.
.
.
.
.
.
.
.
.
.
.
.
.
.
.
.
.
.
.
.
.
.
.
.
.
.
.
.
.
.
.
.
.
.
.
.
.
.
.
.
.
.
.
.
.
.
.
.
.
.
.
.
.
.
.
.
.
.
.
.
.
.
.
.
.
.
31
31
31
33
37
Experiments and Results
5.1 Data augmentation . . . . . . . . . . . . . . . . . . . .
5.2 Experiments . . . . . . . . . . . . . . . . . . . . . . . .
5.2.1 Perform training and inference without keypoints
5.2.2 Perform training and inference with keypoints . .
5.2.3 Building diagram structure from predictions . . .
.
.
.
.
.
.
.
.
.
.
.
.
.
.
.
.
.
.
.
.
.
.
.
.
.
.
.
.
.
.
.
.
.
.
.
.
.
.
.
.
.
.
.
.
.
.
.
.
.
.
.
.
.
.
.
.
.
.
.
.
38
38
39
40
40
42
Conclusion
6.1 Summary . . . . . . . . . . . . . . . . . . . . . . . . . . . . . . . . . . . . .
6.2 Challenges . . . . . . . . . . . . . . . . . . . . . . . . . . . . . . . . . . . . .
6.3 Future works . . . . . . . . . . . . . . . . . . . . . . . . . . . . . . . . . . .
46
46
46
46
List of Tables
4.1
4.2
4.3
Output structures . . . . . . . . . . . . . . . . . . . . . . . . . . . . . . . . .
Used fields . . . . . . . . . . . . . . . . . . . . . . . . . . . . . . . . . . . .
Output structures . . . . . . . . . . . . . . . . . . . . . . . . . . . . . . . . .
22
31
32
5.1
5.2
Model results . . . . . . . . . . . . . . . . . . . . . . . . . . . . . . . . . . .
Graph building technique experiment . . . . . . . . . . . . . . . . . . . . . . .
42
44
iii
List of Figures
3.1
3.2
3.3
3.4
3.5
3.6
3.7
ResNet50 model, from [1] . . . . . . . . . . . . . . .
Non-Maximum Suppression, from [2] . . . . . . . . .
MaskRCNN model, from [3] . . . . . . . . . . . . . .
Mask Sample, the pink colored pixels are for the object
Feature Pyramid Network, from [4] . . . . . . . . . . .
RoIPooling in Faster R-CNN . . . . . . . . . . . . . .
RoIAlign layer used in Mask R-CNN . . . . . . . . . .
.
.
.
.
.
.
.
.
.
.
.
.
.
.
.
.
.
.
.
.
.
.
.
.
.
.
.
.
.
.
.
.
.
.
.
.
.
.
.
.
.
.
.
.
.
.
.
.
.
.
.
.
.
.
.
.
.
.
.
.
.
.
.
.
.
.
.
.
.
.
.
.
.
.
.
.
.
.
.
.
.
.
.
.
.
.
.
.
.
.
.
8
10
12
12
13
14
15
4.1
4.2
4.3
4.4
4.5
4.6
4.7
4.8
4.9
4.10
4.11
Sample of an entry in DiDi dataset . . . . . . . . . . . .
Python code to save a drawing as PNG image . . . . . .
A sample with its labels and the JSON label information.
Sample drawing with bounding boxes . . . . . . . . . .
Pipeline of the model . . . . . . . . . . . . . . . . . . .
Feature Pyramid Network with ResNet, from [5] . . . . .
A drawing with its predictions . . . . . . . . . . . . . .
Structure sample . . . . . . . . . . . . . . . . . . . . .
Model fails to detect intersected arrows . . . . . . . . .
Example when Euclidean distance does work . . . . . .
Sample for Weighted Euclidean . . . . . . . . . . . . . .
.
.
.
.
.
.
.
.
.
.
.
.
.
.
.
.
.
.
.
.
.
.
.
.
.
.
.
.
.
.
.
.
.
.
.
.
.
.
.
.
.
.
.
.
.
.
.
.
.
.
.
.
.
.
.
.
.
.
.
.
.
.
.
.
.
.
.
.
.
.
.
.
.
.
.
.
.
.
.
.
.
.
.
.
.
.
.
.
.
.
.
.
.
.
.
.
.
.
.
.
.
.
.
.
.
.
.
.
.
.
.
.
.
.
.
.
.
.
.
.
.
.
.
.
.
.
.
.
.
.
.
.
21
21
23
25
26
27
30
32
33
34
34
5.1
5.2
5.3
5.4
5.5
5.6
5.7
5.8
5.9
Sample prediction . . . . . . . . . . . . . . . . . . . . .
Sample prediction with rotated input . . . . . . . . . . .
Loss over iteration of proposed model without keypoints
Sample diagram without text . . . . . . . . . . . . . . .
Sample diagram with text . . . . . . . . . . . . . . . . .
Loss over iteration of proposed model with keypoints . .
Drawing without predictions at 60% score . . . . . . . .
Example of impossibility in prediction . . . . . . . . . .
Sample output result . . . . . . . . . . . . . . . . . . .
.
.
.
.
.
.
.
.
.
.
.
.
.
.
.
.
.
.
.
.
.
.
.
.
.
.
.
.
.
.
.
.
.
.
.
.
.
.
.
.
.
.
.
.
.
.
.
.
.
.
.
.
.
.
.
.
.
.
.
.
.
.
.
.
.
.
.
.
.
.
.
.
.
.
.
.
.
.
.
.
.
.
.
.
.
.
.
.
.
.
.
.
.
.
.
.
.
.
.
.
.
.
.
.
.
.
.
.
40
41
41
42
43
43
44
45
45
iv
List of Algorithms
1
Non-Maximum Suppression . . . . . . . . . . . . . . . . . . . . . . . . . . . .
10
2
3
4
5
6
DiDi image generation . . . . . . . . . . . . . . . .
COCO Format Generation . . . . . . . . . . . . . .
Improved Non-Maximum Suppression . . . . . . . .
Arrow Refinement . . . . . . . . . . . . . . . . . .
Weighted Euclidean for Symbol-Arrow relationship .
20
24
29
33
36
v
.
.
.
.
.
.
.
.
.
.
.
.
.
.
.
.
.
.
.
.
.
.
.
.
.
.
.
.
.
.
.
.
.
.
.
.
.
.
.
.
.
.
.
.
.
.
.
.
.
.
.
.
.
.
.
.
.
.
.
.
.
.
.
.
.
.
.
.
.
.
.
.
.
.
.
Chapter 1
Introduction
1.1
Overview
Comparing to many decades ago, artificial intelligence (AI) has developed faster than anyone can imagine. Tracing back to the 90s, right after the second “AI Winter” ended, there had
been numerous advances where computers successfully achieved milestones that used to be believed as impossible. In 1994, Chinook[6], a checker (English draughts) engine, won the United
States tournament by an enormous margin. It beat the second-best player Don Lafferty while
making Marion Tinsley, the best at the time, withdraw in the middle of the game. 1997 on the
other hand is the year that would change the history of chess forever when the Deep Blue[7]
chess machine from IBM defeated Grandmaster Gary Kasparov with the score of 3½ to 2½. In
the same year, Logistello[8] beat the world champion, Takeshi Murakami, with an overwhelming score of six to zero. Nowadays, AI can be seen everywhere in modern life, from work-related
examples like email spam filters, virtual assistants to the entertainment industry like recommendation systems, chatting, gaming bot, voice and text recognition,... AlphaZero [9], developed by
Google DeepMind, defeated the reigning champion, Stockfish, in a one-side match with the result of 28 wins, 72 draws, and zero losses. Another project, AlphaGo [10], beat the champion,
Lee Sedol at 4 - 1, making the history of artificial intelligence the first time a computer had
beaten a human in Go.
Within the area of computer vision, a subset of artificial intelligence that deals with the
science of enabling computers or engines to visualize images, a smaller section deals with the
ability to detect objects, for example, humans, animals, furniture, etc. Recently, there have been
many applications that can help deal with this task. Google Lens[11] is an image recognition
technology developed by Google, which can detect objects, texts, bar codes, QR codes, math
equations,... and “google” for its related results or information using a two-step detector combined with Long Short-Term Memory (LSTM). Microsoft Math[12] can use natural language
processing (NLP) to recognize and solve math problems step-by-step. Other contributions, including Vivino[13], which can scan and detect wines, Screenshop[14] tells your shopping catalog from the image and give recommendations,...
Regarding diagram recognition, since the introduction of the Online Handwritten Flowchart
Dataset[15] in 2011, there have been numerous attempts in digitizing diagrams. Many ideas in
the mainstream are divided into two main approaches: online diagram recognition and offline
diagram recognition. In online diagram recognition, the user continuously draws a diagram on
a device with a touchscreen, such as a tablet or a smartphone, and a pen or finger. Meanwhile,
the program captures the input as a sequence of strokes. These are later used to detect objects
and relations between them. Alternatively, the input of offline diagram recognition is a raw
1
INTRODUCTION
image from a source like phone cameras. The input is broken down into a set of features and
these features are then used to visualize the objects. Recently, there has been more attention
to online recognition as it is more flexible than its counterpart in both precision and real-time
constraints. However, in many real-life situations such as meetings or conferences, when the
discussion between people is displayed on a blackboard or a paper, although possible, online
methods are not preferred. One would capture the image of the blackboard and use offline
methods to digitize the diagram.
This project develops a model that can perform offline diagram recognition and digitize the
diagram in a suitable format. It will not stop with the model and algorithm but will be developed
to an application that can serve actual clients to solve real-life problems.
1.2
Outline
The report is organized as follows:
• Chapter 2 briefly surveys the application of object detection in real life, related work of
object detection in general, and flowchart detection in particular.
• Chapter 3 provides sufficient knowledge to understand the project.
• Chapter 4 shows our proposed system, including how the application works.
• Chapter 5 lists our experiments and results.
• Chapter 6 summarizes what we have done along with challenges and future works
1.3
Objectives
The target of this thesis is to build a model that can convert preprocessed diagram images
to a reasonable and understandable structure. This structure can be later served as a part of an
application that can help to solve many problems in real life.
2
Chapter 2
Related works
2.1
2.1.1
Object detection methods
Introduction
Object detection is a critical task in computer vision that deals with multiple types of certain visual objects such as animals, flowers, houses,... It acts as the fundamental of other tasks
such as object segmentation, object tracking, image captioning, event detection, scene understanding, and activity recognition,... The goal of object detection is to give basic knowledge
to the computer: “What is this object?” and if possible, return the coordinate where this object locates. The object detection task can be divided into two topics: “general detection” and
“specific detection”. The first topic indicates the ability to detect instances of an object under a
uniform condition and thus simulate human eyes with automotive car as an example. The other
topic covers the detection of object under specific scenarios such as face detection, voice detection, text recognition, diagram recognition, etc. Object detection is widely used in multiple
applications, such as autonomous driving, robot and crime prevention.
2.1.2
Traditional detector
Most of the early object detection algorithms were built based on manual-made features
with multiple complex models. Due to the lack of resources and image size, numerous speed-up
methods are required.
In 2001, P. Viola and M. Jones achieved real-time face detection using sliding windows [16,
17]. The algorithm goes through all possible locations and scales in an image to find the human
face. It speeds up the computational process by involving three important techniques. The first
one, integral image speeds up box filtering or convolution process using Haar wavelet as the
feature representation of an image. The second one, feature selection using Adaboost algorithm
to select a small set of features from a huge set of feature pools. The third one, A multi-stage
detection paradigm reduces its computation by spending less time on the background than on
face possibility location. Although the algorithm is simple, it exceeds the current computational
power of the computer at that time.
Histogram of Oriented Gradients (HOG) was created in 2005 by N.Dalal and B.Triggs [18].
It is designed to be computed on a grid of equal cells and use overlapping local contrast normalization to improve accuracy. To detect objects of different sizes, HOG resizes the input image
multiple times to match with detection window size. It has been an important foundation of
many object detectors and a large variety of computer vision applications.[19, 20]
3
RELATED WORKS
2.1.3
CNN-based Detector
As the traditional methods show their disadvantages by becoming progressively complex,
the progress has been slow down, researchers have tried finding an alternative to increase the
accuracy and performance. In 2012, Krizhevsky et al. brought back the age of Convolutional
Neural Network with a paper on object classification with ImageNet [21]. As DCNN can classify the image based on the feature set, subsequent papers show their interest in the newly found
method in object detection. Over the past decades, multiple attempts at making object detection
model have been proposed and studied to improve the accuracy in detection such as LeNet-5
[22], AlexNet [23], VGG-16 [24], Inception [25, 26], ResNet [27],etc. Studies also discover
techniques that improve the training process and prevent overfitting, for example, dropout [23],
Auto Encoder [28], Restricted Boltzmann Machine (RBM) [29], Data Augmentation [30] and
Batch Normalization [31].
There are two main groups in CNN-based detection: “two-step detection” and “one-step
detection”. In the first group, the image will be examined to generate proposals, and these proposals are delivered to another network for classification and regression. In the second group,
the object will be recognized and classified directly within one network model.
2.1.3.1
CNN-based Two Stages Detection (Region Proposal based)
Released in 2014 by Girshick et al.[32, 33], R-CNN is the first attempt to build a Convolutional Neural Network for object detection. The idea of R-CNN is divided into three main
stages:
• Proposals are generated by using selective search.
• Proposals are resized to fixed resolution. These proposals are then used in the CNN model
to extract the feature map.
• Feature map is classified using SVMs for multiple classes to deduct the final bounding box.
Despite having certain advantages compared with traditional methods and bringing CNN back
to practical use, R-CNN has some fatal disadvantages. The training has multiple stages and
feature maps are stored separately, thus increasing time and space complexity. Moreover, The
number of overlapping proposals is large (over 2000 proposals for an image). The CNN model
also requires a fixed size image, so any input must be resized and on certain occasions, the
object will get cropped, creating abominable distortions.
Later in the same year, He et al. introduced a novel CNN architecture named SPP-Net [34]
using Spatial Pyramid Matching (SPM) [35, 36]. The Convolutional Neural Network is combined with a Spatial Pyramid Pooling (SPP) layer, empowers the ability to generate a fixedlength feature representation without scaling the input image. The model removes the proposal
overlapping and the need to resize the image, however, it still requires multi-step training including feature extraction, network fine-tuning, SVM training, and bounding box regressor. Additionally, the convolution layers before the SPP cannot be modified with the algorithm shown
in [34].
In 2015, Girshick proposed Fast R-CNN [37], a model with the ability to do multi-task on
classification and bounding box regression within the same network. Similar to SPP-Net, the
whole image is processed with convolution layers to produce feature maps. Then, a fixed-length
feature vector is extracted from each region proposal with a region of interest (RoI) pooling
layer. Each feature vector is then fed into a sequence of fully connected layers before branching
into two outputs, one is then used for classifier and the other encodes the bounding box location.
Regardless of region proposal generation, the training of all network layers can be processed in
a single stage, saving the extra cost of storage.
4
RELATED WORKS
In the same year, Ren et al. introduced Faster R-CNN, a method to optimize Fast R-CNN
further by altering the proposal generation using selective search by a similar network called
the Region Proposal Network (RPN) [38]. It is a fully-convolution network that can predict object bounding boxes and scores at each position at the same time. With the proposal of Faster
R-CNN, region proposal-based CNN architectures for object detection can be trained in an endto-end way. However, the alternate training algorithm is time-consuming and RPN does not
perform well when dealing with objects with extreme scales or shapes. As a result, multiple
adjustments have been made. Some noticeable improvements are Region-based fully convolutional network (R-FCN) [39], Feature Pyramid Network (FPN) [4], Mask R-CNN [40] and its
variant, Keypoint R-CNN. We will look at the details of these methods in Chapter 3.
2.1.3.2
CNN-based One Stage Detection (Regression/Classification based)
Region Proposal based frameworks are composed of several correlated stages, including
region proposal generation, feature extraction, classification, and bounding box regression. Even
in Faster R-CNN or its variant, training the parameters is still required between the Region
Proposal Network and detection network. As a result, achieving real-time detection with Two
Stages Detection is a big challenge. One Stage Detection, on the other hand, deal with the image
directly by mapping image pixel to bounding box coordinates and class probabilities.
• You Only Look Once (YOLO): YOLO [41] was proposed by J.Redmon et al. in 2015 as the
first entry to the One Stage Detection era. This network divides the image into regions and
predicts bounding boxes and probabilities for each region simultaneously. The YOLO consists of 24 convolution layers and 2 FC layers, of which some convolution layers construct
ensembles of inception modules with 1 × 1 reduction layers followed by 3 × 3 conv layers.
Furthermore, YOLO produces fewer false positives in the background, which makes cooperating with Fast R-CNN become possible. The improved versions, YOLO v2,v3, and v4
were later proposed, which adopts several impressive strategies, such as BN, anchor boxes,
dimension cluster, and multi-scale training.[42, 43, 44].
• Single Shot MultiBox Detector (SSD): SSD [45] was proposed by W. Liu et al. in 2016
as the second entry of the One Stage Detector. SSD introduces multi-reference and multiresolution detection techniques that significantly improve detection accuracy. The main
difference between SSD and any other detectors is that SSD detects objects of different
scales on different layers of the network rather than detecting them at the final layer.
• RetinaNet: RetinaNet [46] uses a Feature Pyramid Network(FPN) with a CNN-based Backbone. FPN involves adding top-level feature maps with feature maps below them before
making predictions. It involves upscaling the top-level map, dimensionality matching of
the map below using a 1x1 Convolution and performing element-wise addition of both.
RetinaNet achieves comparable results to Two Stages Detection while maintaining higher
speed.
• Refinement Neural Network for Object Detection (RefineDet): RefineDet [47] is based
on a feed-forward convolutional network that is similar to SSD, produces a fixed number
of bounding boxes and the scores indicating different classes of objects in those boxes, followed by the non-maximum suppression to produce the final result. RefineDet is composed
of two inter-connected modules:
– Anchor Refinement Module (ARM): Remove negative anchors and adjust the locations/sizes of anchors to initialize the regressor.
– Object Detection Module (ORM): Perform regression on object locations and predict
multi-class labels based on the refined anchors.
5
RELATED WORKS
There are three core components in RefineDet: Transfer Connection Block (TCB) converts
the features from ARM to ODM; Two-step Cascaded Regression conduct regression on the
locations and sizes of objects; Negative Anchor Filtering will reject well-classified negative
anchors and reduce the imbalance problem.
2.2
Diagram recognition
In general, diagram recognition can be grouped into two smaller areas: Online Diagram
Recognition and Offline Diagram Recognition. In online recognition, the model is a RNN to
recognize each stroke and generate candidate matches.
Valois et al. [48] proposed a method for recognizing electrical diagrams. Each set of ink
strokes is detected as a match with the corresponding confidence factor using probabilistic normalization functions. The disadvantage of the model is the simplicity of the system and its low
accuracy, preventing it from being used in real situations. Feng et al. [49] used a more modern technique in detecting electrical circuits. Symbol hypotheses generation and classification
are generated using a Hidden Markov Model (HMM) and traced on 2D-DP. However, it has a
drawback of complexity when the diagram and number of hypotheses are immense, makes it
impractical for real-life cases. ChemInk [50], a system for detecting chemical formula sketches,
categorizing strokes into elements and bonds between them. The final joint is performed using
conditional random fields (CRF), which combines features from a three-layer hierarchy: ink
points, segments, and candidate symbols. Qi et al. [51] used a similar approach to recognize diagram structure with Bayesian CRF - ARD. These methods outperform traditional techniques,
however, by using pairwise at the final layer, it is harder to combine features for future adaptations. Coming to Flowchart recognition, after the release of the Online Handwritten Flowchart
Dataset (OHFCD), multiple studies occurred in resolving this dataset. Lemaitre et al [52]. proposed DMOS (Description and MOdification of the Segmentation) for online flowchart recognition. Wang et al. [53] used a max-margin Markov Random Field to perform segmentation
and recognition. In [54] they extend their work by adding a grammatical description that combines the labeled isolated strokes while ensuring global consistency of the recognition. Bresler
et al. proposed a pipeline model where they separate strokes and text by using a text/non-text
classifier then detect symbol candidates using a max-sum model by a group of temporally and
spatially close strokes. The author also proposes an offline extension that uses a preprocessing
model to reconstruct the strokes from flowchart [55, 56].
While online flowchart recognition detects candidates based on ink strokes, offline flowchart
recognition performs object detection on an image from the user. It is possible to reconstruct online stroke from offline data [57], however, that preprocessing step is not necessary because we
can recognize the whole diagram structure independently with strokes. As online recognition attracts more researchers, there have not been many studies on offline detection. A. Bhattacharya
et al. [58] uses morphological and binary mapping to detect electrical circuits. Although it can
work on a smaller scale, using binary mapping cannot detect curve or zig-zag lines. JulcaAguilar and Hirata proposed a method using Faster R-CNN to detect candidates and evaluate
its accuracy on OHFCD. The model can detect components in the diagram, including arrows,
however, it cannot detect the arrowhead.
6
Chapter 3
Background
In this section, we provide the basic knowledge of the techniques used for the system in our
project. This knowledge is based on our surveys in Chapter 2 and will be used in Chapter 4. We
will summarize about three models in order: Section 3.1 is about Faster R-CNN used in object
detection, section 3.2 introduces Mask R-CNN, a descendant of Faster R-CNN by adding object
segmentation task. Finally, section 3.3 shows Keypoint R-CNN, a variation of Mask R-CNN,
which is important in this project.
3.1
Faster R-CNN
Introduced in chapter 2, Faster R-CNN is an object detection model that extends Fast RCNN. Faster R-CNN replaces the old looping method with a new sub-model called Region
Proposal Network (RPN). As a result, a Faster R-CNN model consists of three main components: Backbone network, RPN, and Regression-Classification layers. Because we do not use
Faster R-CNN model in this project, we will briefly discuss the first two components, the last
one will be mentioned in section 3.2.
3.1.1
Backbone network
The Backbone Convolutional Neural Network is an important part of the algorithm. It plays
the role of a feature extractor, which encodes the image input and returns a feature map. The
better the backbone is, the higher result the model will achieve.
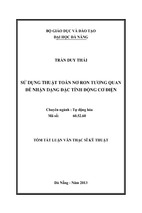
Figure 3.1 shows the pipeline of ResNet50, one example of Residual Network[27]. Residual
Network inherits the idea of stacking many convolution layers to create a model. It consists of
two main blocks: convolution block and identity block. These blocks have similar structures:
they both have two paths, one goes through many convolutional layers and one goes through a
shortcut path. The main path follows three steps:
1. Conv layer, kernel size 1*1 with Batch Normalization and ReLU.
2. Conv layer, kernel size k*k with Batch Normalization and ReLU. In figure 3.1, k = 3.
3. Conv layer, kernel size 1*1 with Batch Normalization.
For the shortcut path, while convolution block contains one conv layer with Batch Normalization, the identity block simply uses the original input. The results of both paths are then added
together with ReLU activation function. The number of layers used in both blocks is three since
the conv layer in the shortcut path of convolution block is redundant.
7
BACKGROUND
Figure 3.1: ResNet50 model, from [1]
Most ResNet model has the same structures, the only difference between them is the number
of convolution and identity blocks. In general, the input is an image resized to 224 by 224
with three channels (RGB). It then goes through a conv layer with kernel size 7*7 with Batch
Normalization, ReLU activation then a MaxPool 3x3. After that, it goes through a series of
convolution and identity blocks before doing global average pool with softmax function to return
the feature map. In figure 3.1, we can see that the model contains four convolution blocks and
twelve identity blocks. Hence, the total number of layers is:
1 + 4 ∗ 3 + 12 ∗ 3 + 1 = 50
implying the name ResNet50. Other model for example ResNet101 has 4 convolution blocks
and 29 identity blocks, so the total number of layers is: 1 + 4 ∗ 3 + 29 ∗ 3 + 1 = 101.
There are other candidates worth mentioning, including Inception, Inception-ResNet,... In
our project, we decide to use ResNet50 and ResNet101. The full ideas will be discussed in
section 4.3.
3.1.2
Region Proposal Network
Region Proposal Network (RPN) is an addition to Faster R-CNN. It is a sub-model that plays
the role to generate proposals from input feature maps and use these proposals for regression
and classification. The way this model solves the task can be divided into three main steps:
At the first step, the model receives the feature maps. If the model is in training, it also
receives ground truth boxes. It then creates a sliding window running on the feature maps. For
each position of the sliding window, the model creates a set of m*n anchors with m different
aspect ratios and n different scales. In practice, m and n are equal to five and three, respectively.
Each anchor A has four attributes < xa , ya , wa , ha > regarding x coordinate, y coordinate of the
center, width, and height from the center (half of total width and height).
The second step involves labeling anchors. For each anchor and ground truth box, a value
called Intersection over Union (IoU) is calculated, indicating the overlapping ratio with the
ground truth bounding box. The anchor will be labeled positive or negative depending on this
value.
if k ≥ FOREGROUND_T HRESHOLD
1
label_box = 0, if k ≤ BACKGROUND_T HRESHOLD
−1 otherwise
where k is the Intersection over Union of the anchor and ground-truth box
k=
AnchorBox ∩ GroundTruthBox
AnchorBox ∪ GroundTruthBox
8
- Xem thêm -