MINISTRY OF TRAINING
MINISTRY OF AGRICULTURE AND
AND EDUCATION
RURAL DEVELOPMENT
THUY LOI UNIVERSITY
Nguyen Thi Lien
APPLICATIONS OF REMOTE SENSING AND GIS TO MAPPING
LAND COVER CHANGE IN SON LA PROVINCE
Master Thesis
Hanoi, May 2007
MINISTRY OF TRAINING
MINISTRY OF AGRICULTURE AND
AND EDUCATION
RURAL DEVELOPMENT
THUY LOI UNIVERSITY
Nguyen Thi Lien
APPLICATIONS OF REMOTE SENSING AND GIS TO MAPPING
LAND COVER CHANGE IN SON LA PROVINCE
Field of study: Disaster Mitigation
Master Thesis
Advisors:
Assoc. Prof. Hoang Thanh Tung
Dr. Vu Thanh Tu
Hanoi, May 2017
ACKNOWLEDGEMENT
I am indebted to my respected Assoc. Prof. Hoang Thanh Tung and Dr. Vu Thanh
Tu who work as lecturers in Department of Hydrology and Water resources in Thuy
Loi University for their continuous guidance, advice and expedience from the
proposal preparation to thesis finalization. Their constructive comments, untiring
help, guidance and practical suggestions inspired me to accomplish this work
successfully.
Besides, I am especially grateful to Dr. Nguyen Quoc Khanh and members in the
Department of Geologycal and Remote Sensing in Vietnam Institute of Geosciences
and Mineral Resources (VIGMR) who supported me in terms of the data collection
and gave me useful advices for my thesis.
I remember all those who have contributed directly or indirectly to
successfully completing my study.
Finally, I must express my very profound gratitude to my family for providing me
with unfailing support and continuous encouragement throughout my years of study
and through the process of researching and writing this thesis. This accomplishment
would not have been possible without them. Thank you.
Hanoi, May 11th 2017
Nguyen Thi Lien
i
DECLRATION
I hereby certify the work which is being presented in this thesis entitled,
“APPLICATIONS OF REMOTE SENSING AND GIS TO MAPPING LAND
COVER CHANGE IN SON LA PROVINCE” in partial fulfillment of the
requirement for the award of the Master of Disaster Management, is an authentic
record of my own work carried out under supervision of Assoc. Prof. Hoang Thanh
Tung and Dr. Vu Thanh Tu. The matter embodied in this thesis has not been
submitted by me for the award of any other degree or diploma.
Date:
Nguyen Thi Lien
ii
ABSTRACT
The thesis "Application of remote sensing and GIS to mapping of land cover changes
in Son La province" was carried out and finished in May 2017. Purpose of the thesis
is to study and apply remote sensing technology and GIS in mapping changes of land
cover in Son La Province. To meet the thesis requirements, the following tasks have
been implemented:
-
Study of land cover, remote sensing and GIS theories.
-
Collection of satellite imagery data and statistical data for classification,
intepretation of land cover maps over years. Implementation of sptial analisis
in GIS for evaluation of land cover change map.
-
Conclusions about the results achieved and the assessment methodology.
After the implementation process, the subject has obtained some results:
-
Land cover map of Son La province in 1999 and 2015 with 7 types of land
cover: bush, lake-river, natural forest, planted forest, bare soil, agricultural
land, specialized land.
-
Land cover changes map in Son La province during 1999-2015.
With the results achieved, remote sensing technology and GIS can be seen as
effective methods with relatively high accuracy, cost savings in classification
and catalytic activity.
iii
Abbreviation
GIS
Geographic Information System
TM
Thematic mapper
ETM
Enhanced Thematic Mapper
MLC
Maximum Like hood classifer method
ROI
Region Of Interest
K
Kapa
CB
Bush
SH
Lake – river
RTN
Natural forest
RT
Planted forest
ĐT
Bare soil
ĐNN
Agricultural
ĐCD
Specialized land
iv
TABLE OF CONTENTS
INTRODUCTION .............................................................................................................. 1
Research rationale ............................................................................................................ 1
Main objective of the research ......................................................................................... 1
Subject and scope of the research .................................................................................... 1
Structure of the research ................................................................................................... 1
CHAPTER I: LITERATURE REVIEWS ...................................................................... 3
1.1. Overall study on applications of Remote Sensing and GIS in mapping land
cover changes in the World .............................................................................................. 3
1.2. Overall study on applications of Remote Sensing and GIS in mapping land
cover changes in Vietnam ................................................................................................ 5
1.3. Approach of the research ........................................................................................... 7
1.3.1. The remote sensing is used for monitoring land cover changes ...................... 10
1.3.2 GIS spatial analysis is used for evaluation of land cover changes.................... 14
CHAPTER II: RESEARCH ON THE APPLICATION OF REMOSTE
SENSING AND GIS IN ESTABLISHMENT OF LAND COVER CHANGE
MAP OF SON LA PROVINCE ..................................................................................... 17
2.1. Overview of study area............................................................................................ 17
2.1.1. Natural and socio-economic conditions ........................................................... 17
2.1.2. Characteristics of land cover in the study area................................................. 18
2.2. Data collection and analysis .................................................................................... 19
2.2.1. Remote sensing data ......................................................................................... 19
2.2.2. Land use status ................................................................................................. 21
2.2.3. Field survey ...................................................................................................... 25
2.3. Preprocess of remote sensing image ....................................................................... 26
2.3.1. Radiant calibration ........................................................................................... 26
v
2.3.2. Enhance image visibility .................................................................................. 26
2.3.3. Geometric correction ........................................................................................ 28
2.4. Image classification method .................................................................................... 30
2.4.1. Unsupervised classification method ................................................................. 30
2.4.2. Supervised classification method ..................................................................... 31
2.5. Evaluate accuracy and image processing after classification ................................. 36
2.5.1. Evaluate the accuracy after classification ........................................................ 36
2.5.2. Image processing after classification ............................................................... 37
2.6. Establish land cover map and land cover change map ........................................... 37
2.6.1. Establish land cover map.................................................................................. 37
2.6.2.Establish land cover change map ...................................................................... 38
CHAPTER III: RESULTS AND DISCUSSIONS ......................................................... 40
3.1. Image classification results in 1999 ........................................................................ 40
3.2. Image classification results in 2015 ........................................................................ 44
3.3. Established results of land cover change map ......................................................... 46
CONCLUSIONS AND RECOMMENDATIONS ......................................................... 51
1. Conclusions ................................................................................................................ 51
2. Recommendations ...................................................................................................... 51
REFERENCES ................................................................................................................. 53
vi
LIST OF FIGURES
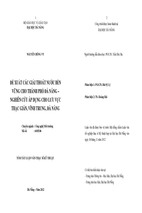
Figure 1. Overview of research ........................................................................................... 8
Figure 2 Remote sensing image processing ........................................................................ 9
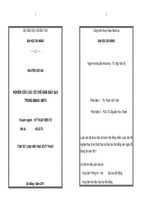
Figure 3.Spectral reflective characteristics of some of the main natural objects .............. 10
Figure 4. Scene P128-R45 covers 90% area of Son La province ..................................... 21
Figure 5. Land use map in Son La province in 2005 ........................................................ 24
Figure 6. Field survey of sample points ............................................................................ 25
Figure 7. Enhance image visibility .................................................................................... 27
Figure 8. Image before and after being enhanced image quality. ..................................... 28
Figure 9. Landsat 7 image in 1999 after geometric grafting and correction. .................... 29
Figure 10. Landsat 8 image in 2015 after geometric grafting and correction. .................. 30
Figure 11. Select the sample area ...................................................................................... 34
Figure 12. Check the difference between the samples ...................................................... 36
Figure 13.Use the Crosstab tool in the IDRISI software to calculate sub-carpets
fluctuations ........................................................................................................................ 39
Figure 14.Photo classification result in 1999. ................................................................... 41
Figure 15. Image classification results in 2015 ................................................................. 44
Figure 16. Land cover change map in Son La province ................................................... 50
vii
LIST OF TABLES
Table 1.Some interpretation signs on the fake color combination of SPOT satellite
images ................................................................................................................................ 14
Table 2. Distribution of vegetation cover and current land use status in 2011. ................ 18
Table 3. Remote sensing image data ................................................................................. 20
Table 4. Land use status of Son La province in 2005 as follows: .................................... 22
Table 5. Statistics of sample scores for each type of cover .............................................. 25
Table 6. Some interpretive patterns used in the topic ....... Error! Bookmark not defined.
Table 7. Assessment accuracy according to Kappa coefficientand overall accuracy
for 1999 image classification results in Son La province ................................................. 42
Table 8. Statistics of area covered by each type of cover in Son La province in 1999 .... 42
Table 9. Statistics of area covered by each type of cover in districts of Son La
province in 1999. ............................................................................................................... 43
Table 10. Assessment of accuracy according to Kappa coefficientand overall
accuracy for image classification in 2015 in Son La province. ........................................ 45
Table 11. Statistics of cover area of each type of cover in Son La province in 1999. ...... 45
Table 12. Statistics of area covered by each kind of cover in districts of Son La
province in 2015. ............................................................................................................... 46
Table 13. The number of pixel land cover change between 1999 and 20015 in Son La
province. ............................................................................................................................ 47
Table 14. Pixel ratio changes in two periods 1999 and 2015 in Son La province. ........... 47
Table 15. Evaluate the maturation variation in stage 1999-2015...................................... 49
viii
INTRODUCTION
Research rationale
Land is an extremely precious natural resource, a special production material. Land
is the living environment of humans as well as creatures, the territory of population
distribution, construction of economic, cultural, national security works. Today, due
to population increase, urban development, socioeconomic growth and other
problems are currently having large impacts on land, especially for Son La province.
Up until now on the territory of Son La province there have been 49 hydropower
plants, which have considerable impact on the narrowed forest area. Standing before
such pressure, land and ground decks also convulse non-stop with the development
of society. This is a special resource that can be exploited for use but cannot be
increased in terms of quantity. Thus the monitoring, research, management and
usage of this resource effectively and reasonably are a very important matter.
Remote sensing technology is applied more and more widely in many sectors, many
fields – hydrology, geology, environment to agriculture – forestry – fishery... in
which land cover changes is monitored with high accuracy, from which it can help
managers to acquire more materials to supervise the convulsion of Land use. This
can be considered one of the solutions to the problems set out. On the other hand this
method has not been applied for piloting in Son La province. Thus, the topic of
“Remote sensing and GIS application for establishment of land cover changes map
of Son La province” was selected to perform for my thesis.
Main objective of the research
The main objective of the research is to study remote sensing and GIS and their
applications in assessment of land cover changes. A case study is then applied to
Son La provinc of Vietnam during the 1999-2015 periods.
Subject and scope of the research
Subjects of the research are Remote Sensing, GIS and their applications in mapping
land covers and in assessing of land cover changes.
Scope of the research is Son La Province in the Northern Part of Vietnam.
Structure of the research
In additional to the Introduction, Conclusion and Recomendation, the thesis is
structured in 3 chapters as the followings:
1
Chapter I: Literature review. In this chapter the author focus on researching the
theoretical basis on the decks on the surface of the earth and domestic and foreign
researches on the application of remote sensing and GIS in research of land cover
changes and Land use. In addition in this chapter the author shall also orientate the
research, and generalize the steps of data collection, image analysis and role of
remote sensing – GIS in research of land cover convulsion.
Chapter II: Research of remote sensing and GIS application in establishment of land
cover changes map of Son La province. In this chapter the author focus on
researching the following issues:
-
Overview of research area: The status quo of the research area land cover.
-
Data collection and analysis: Remote sensing data, Land use status, field
survey data.
-
Pre-processing of remote sensing image: Radiation correction, image quality
enhancement, geometry correction.
-
Methods of image classification, post-classification accuracy assessment.
-
Methods of land cover changes map establishment.
Chapter III: Results and Discussions. In this chapter the author shall present the
achieved results such as:
-
Land cover classification result of 1999.
-
Land cover classification result of 2015.
-
Land cover changes map during the period of 1999-2015.
2
CHAPTER I
LITERATURE REVIEWS
1.1. Overall study on applications of Remote Sensing and GIS in mapping land
cover changes in the World
In the world, research topics on the convulsion of land use form for analysis,
assessment, and forecast of development have been applied fairly widely.
In the topic “Remote sensing based quantification of land cover and land use change
for planning” (Bjorn Prenzel, 2003), the author made scientific bases of the selection
of method for quantitative results in the research of land cover changes and usage
based on remote sensing basis. In which depending on the situation that we use
methods based on defined theory or based on experience. A noteworthy point that
the author mentioned is the requirement of data when assessing convulsion: the
collected data shall have the same characteristics (regarding space, spectral
resolution…) and the data shall reach certain standards in terms of cloud or fog, and
the collected data shall be in the same research area
In the research “Land use/ land cover changes detection and Urban Spawl Analysis”
(M. Harika, et al., 2012) the author assessed the form of land use/ land surface at the
cities of Vijayawada, Hyderabab and Visakhapatanam at Southeast India. In addition
to using remote sensing image data for interpretation, the topic also used the Markov
sequence to predict areas that may be convulsed in the future.
In the research “Monitoring Land Use Change by Multi-temporal Landsat Remote
Sensing Imagery” (Tayyebi, et al., 2008), the author group used multi-time landsat
image to assess the urban land convulsion in the past (the period of 1980-2000) to
make interpretations for the future (year 2020).
In the topic “Analyzing Land use/ Land Cover change Using Remote Sensing and
GIS in Rize, North-East Turkey” (Selcuk Reis, 2008), the author established a land
use / land cover changes map at Rize, Northeast Turkey with 7 types of land cover.
The data the author used in this topic is the image of Landsat MSS (1976) and
Landsat ETM+(2000) with the respective resolution of 79m and 30m. However in
this topic, the author did not explain clearly the method but only focused on the
assessment, statistics of convulsion with profound changes to the agricultural, urban,
grass and forestry land, areas near the sea with low slope.
3
In the topic “Land use/Land Cover Mapping and Change Detection in part of Eastern
Ghats of Tamil Nadu using Remote Sensing and GIS” (S. JAYAKUMAR AND D.I.
AROCKIASAMY, 2003), the author used the software ERDAS IMAGINE 8.3 to
process the satellite image and establish a land cover and land use map of 1990 and
1999. The analysis of land use/ land cover changes is done based on the correlative
matrix in the Erdas Imagine software.
In the research “Land cover change detection using GIS and remote sensing
techniques: A sapatio-temporal study on Tanguar Haor, Sunamganj, Bangkadesh”
(Md. Inzamul Haque,Rony Basak, 2017). This research uses satellite data in the past
and in recent times to assess the change of typical scenery in various decades. Both
methods of prior and post classification are used to assess the result of change from
1980 to 2010. In the prior classification method the NDVI, CVA, NDWI indexes are
used to assess the script of change. The supervised classification technique is used to
create unique land cover of the surface of the earth.
In the research “Monitoring land use/cover change using remote sensing and GIS
techniques: A case study of Hawalbagh block, district Almora, Uttarakhand, India”
(J.S.Rawat, Manish Kumar, 2015). This research demonstrates clearly the strong
change in space and time of land cover and land use at the Hawalbagh area of
Almora province, Uttarakhand, India. The Landsat satellite image of two different
time periods, i.e. Landsat Thematic Mapper (TM) years 1990 and 2010 were
collected at the GLCF webpage. The supervised classification method is maximally
used in the ERDAS 9.3 software. Images of the research area are divided in 5
different classes which are land cover, agriculture, vacant land, construction and
water.
In the research “Monitoring urban growth and land use change detection with GIS
and remote sensing techniques in Daqahlia governorate Egypt” (Ibrahim Rizk
Hegazy, Mosbeh Rash Kaloop, 2015). In this research the author uses the image
source from the USGS Earth Explorer webpage. Image processing is done in the
ERDAS software. Images are geometrically corrected, adjusted and removed of
clouds. These data are stratified into regions, where the land cover has similar
spectral properties. Processed images shall be classified by both methods: supervised
classification and unsupervised classification method. In the unsupervised
classification method, the use of the ISODATA clustering algorithm built in ERDAS
shall classify by the necessary amount of classes and the amount of available pixels.
4
In the supervised classification method, the use of the Maximum likelihood
algorithm shall classify based on the sample set provided by the user based on their
field knowledge. The classification result by the unsupervised classification method
shall be used for reference and understanding on the distribution of pixels. The
classification result divided into four classes of land cover including agricultural
land, construction area, arid land and water areas determined in the research area.
In the research of Li et al (2003) “Research of the change of cover in the Tarim basin
of China in the period of 1964 and 2000”. The author has used Landsat ETM image
for the year 2000 Corona Panchromatic image for the year 1964. Using the method
of post-classification convulsion discovery, the author noticed a change in the area of
reclaimed land from water and soil, the death of an old primeval forest surrounding
Tarim River and also the change in the salinity.
In the research “Analysis of Urban Sprawl Pattern in Tiruchirappalli City Using
Applications of Remote Sensing and GIS” (Nisha Radhakrishnan · Satish Kumar
Eerni ·Sathees Kumar, 2013). The author used ASTER image with high resolution,
collected from the national remote sensing center. Images after processing shall go
through land cover classification via the ERDAS IMAGINE 9.1 software. In this
research the author used the supervised classification method, and used the
Maximum likelihood Classifier algorithm. The classification result divided into 5
types of land cover which are construction soil, vegetation, moist soil, vacant land
determined in the research area.
1.2. Overall study on applications of Remote Sensing and GIS in mapping land
cover changes in Vietnam
Currently there have been many research works on the convulsion of land cover with
many different viewpoints, of which there are works that focus on argumentative
research analysis, while others focus on methods of finding convulsion and there are
works that combine both: convulsion discovery technique, result assessment and
argument supplementation.
The topic “Research of convulsion of several forms of land use in the peri-urban
areas of Tu Liem district Hanoi city on the basis of remote sensing and GIS
technology application” of author Nguyen Thi Thuy Hang has solved problems such
as extraction of information on convulsion of land use from multi-spectral and multitime remote sensing data through several methods of digital image analysis and
5
processing, integrating remote sensing data analysis results with other data to assess
the correlation between convulsion of land use and socioeconomic phenomena.
The author group Nhu Thi Xuan, Dinh Thi Bao Hoa, Nguyen Thi Thuy Hang with
the article “Assessment of land use convulsion of Thanh Tri district, Hanoi city in
the period of 1994 - 2003 on the basis of remote sensing method combined with
GIS” has analyzed, assessed the convulsion of land use in the area of Thanh Tri. This
is also one of the areas largely affected by the urbanization.
In addition to using remote sensing data in the research of convulsion, author Hoang
Thi Thanh Huong in the topic “Research of convulsion of land use in Long Bien
district, Hanoi city during urbanization” has combined remote sensing material with
the spatial analysis of the geo information system. The topic pilots the new
classification method of classification by subject, method of performance on remote
sensing data with very high resolution (VHR). In addition, spatial analysis is used in
GIS to compare classification results with the socioeconomic data to see the
interaction between them. The result shows that the remote sensing image with high
spatial resolution can meet the requirements of accuracy of urban areas with
fragmentation as in Vietnam.
In the topic “Establishment of vegetation map on the basis of remote sensing image
analysis, processing” at the area of Tua Chua – Lai Chau (Hoang Xuan Thanh,
2006), the author used the supervised classification method for the Landsat image
data of 2006 to classify 7 different vegetation classes with the Kapa index ~0.7
In the topic “Application of remote sensing in monitoring the urban land convulsion
of Vinh city, Nghe An province” (Nguyen Ngoc Phi, 2009) the most approximate
classification method was used to divide into 5 classes of subject. The most
noteworthy point of this topic is the combined use of various remote sensing images
such as Landsat (1992, 2000) and SPOT (2005) to bring forth the interpreted results,
while also have a comparison on the accuracy, detail between the image types. With
a Kappa index of ~0.9, the SPOT image data has the post-classification accuracy
higher than compared to Landsat (Kapa~0.7).
In the research “Application of remote sensing and GIS in establishing the land
cover map of the area of Chan May, Phu Loc district, Thua Thien Hue province”
(Nguyen Huy Anh, Dinh Thanh Kien, 2012), the author has used the most
approximate classification method for the Landsat TM image data at a resolution of
6
10m, combined with field sampling to divide into 13 types of cover with relatively
high accuracy.
In the research “Usage of MODIS satellite image material in research of crop season,
establishment of status quo and convulsion map of the Red River delta cover in the
period of 2008 -2010” (Vu Huu Long, Pham Khanh Chi, Tran Hung, 2011), the
author used supervised classification with the most approximate classification
algorithm. The topic classfied 9 types of cover with Kapa index ~0.9. To assess the
accuracy, the author used a combination of the survey sample data, field
investigation and the status quo map of Land use of the most recent year.
In the topic “Research of the impact of shifting agricultural land to non-agricultural
land in the vicinity of Hue city, period of 2006 - 2010” (Nguyen Thi Phuong Anh et
al., 2012), the author assessed the impact of the shift of agricultural land to nonagricultural land on the economic structure, social life and bring out viable solutions,
with the pilot research area being Kim Long ward. In this topic, the author only used
methods of synthesis, analysis, comparison, contrasting, and statistics of data to
perform research. The data is extracted via tables, without visual output by system of
maps.
In the topic “Research of change of forest vegetation at the Bach Ma national garden,
Thua Thien Hue province” (Dang Ngoc Quoc Hung, 2009), the author built forest
vegetation maps of the years 1989, 2001, 2004, 2007 by supervised method of
remote sensing image interpretation to extract information from satellite images.
Erdas software was used to interpret satellite images. The change of the forest
vegetation in the periods 1989-2001, 2001-2004, 2004-2007 was analyzed and
assessed by method of stacking and analysis by Arcview 3.2 software.
The application of remote sensing in monitoring the status of land use, although
popular in the world, is still not widely applied in Vietnam. This may show that, the
capability of remote sensing in status monitoring is very good but the performance of
this task is still difficult, especially for small areas.
1.3. Approach of the research
In this research, the author used the method of remote sensing to extract information
of land cover on the surface of the research area, combined with field survey and
other materials determining the status of land use.
7
Figure 1. 1. Overview of the research
The GIS geographical information system is used to analyze, assess the convulsion
of land resources.
The processing of remote sensing image for analysis of land cover for the research
area adhers to the following procedure
The Landsat 7 remote sensing image data taken in 1999 and Landsat 8 taken in 2015
were used to analyze and establish the land cover map of 2 periods. The methods of
remote sensing image analysis are very diverse. Some of the methods of image
analysis can be listed such as manual threshold, unsupervised classification,
supervised classification, Fuzzy classification or Mixing models but the two popular
methods for classifying land cover currently is the unsupervised classification and
supervised classification.
8
Figure 1. 2 Remote sensing image processing
Each method of classification uses certain algorithms. The algorithms have
limitation and application in different situations (Shrestha and Alfred, 2001). The
popularly used algorithms are the Minimum Distance, Parallelepiped and Maximum
Likelihood (Richards, 1994). Among these, the Maximum Likelihoood algorithm is
used the most by classifiers in works of land cover research (Keuchel et al., 2003;
Shrestha and Alfred, 2001; Swain and Davis, 1978; Este et al., 1983; Schowengerdt,
1983; Sabins, 1986; Lillesand and Kiefer, 2000; Jensen, 1996). The Minimum
Distance algorithm is often applied in the unsupervised classification method, while
the two algorithms Maximum Likelihood and Parallelepiped are usually applied in
the supervised classification method. In addition, people also use several methods to
highlight the vegetation factor such as the vegetation index analysis method – NDVI.
In this research, the author uses the supervised classification method and the
Maximum Likelihood algorithm to analyze the land cover of 2 periods on the
research area.
The calculation of land cover changes of two periods is done by the CROSSTAB
tool (Cross-Classification) in the IDRISI 17 software. This method is the popular
9
approach to calculation of land cover changes in land cover researches around the
world.
1.3.1. The remote sensing is used for monitoring land cover changes
Remote sensing is a science of technology that helps to identify, measure or analyze
the properties of objects or phenomena from a distance without direct contact with
the object.
These natural objects absorb and reflect electromagnetic waves with intensity and in
different ways, known as spectral characteristics. These characteristics contain
important information that allows the grouping of natural formations into objects of
the same spectral reflectance. This is useful for the interpretation of satellite imagery
so the spectral reflectance characteristics of natural objects play a very important role
in exploiting and applying effectively the collected information.
Spectral reflectance properties of natural objects depend on many factors such as
lighting conditions, atmospheric environment and object surface, especially the
objects themselves (moisture, surface roughness, vegetation, humus, surface
structure, etc.). Different objects will have ability to reflect different spectra, with
each object, the reflecting and re-absorbing varies by wavelength. The remote
sensing method relies primarily on this principle to identify and detect objects and
phenomena in nature. The information about the spectral characteristics of natural
objects will help professionals select image processing methods to get optimal
channel, which contains a lot of information about the subject of study, this is the
basis to analyze and research of the properties of the object and proceed to classify
them. The following is spectral reflective characteristics of some of the main natural
objects
Plant
Turbid water
Clear water
Rich soil, clay
Mud
Figure 1.Spectral reflective characteristics of some of the main natural objects
Figure 1. 3: Reflective spectral characteristics of vegetation cover
10
- Xem thêm -