Downloaded from ascelibrary.org by RMIT UNIVERSITY LIBRARY on 01/04/19. Copyright ASCE. For personal use only; all rights reserved.
Congress on Technical
Advancement 2017
Infrastructure Resilience and Energy
Proceedings of the Congress on
Technical Advancement 2017
Duluth, Minnesota
September 10–13, 2017
Edited by Jon E. Zufelt, Ph.D., P.E., D.WRE
Downloaded from ascelibrary.org by RMIT UNIVERSITY LIBRARY on 01/04/19. Copyright ASCE. For personal use only; all rights reserved.
CONGRESS ON TECHNICAL
ADVANCEMENT 2017
INFRASTRUCTURE RESILIENCE AND ENERGY
PAPERS FROM SESSIONS OF THE FIRST CONGRESS ON TECHNICAL
ADVANCEMENT
September 10–13, 2017
Duluth, Minnesota
SPONSORED BY
Committee on Technical Advancement
Aerospace Engineering Division
Cold Regions Engineering Division
Committee on Adaptation to a Changing Climate
Energy Division
Forensic Engineering Division
Infrastructure Resilience Division
Construction Institute
Duluth Section of ASCE
Utility Engineering and Surveying Institute of the
American Society of Civil Engineers
EDITED BY
Jon E. Zufelt, Ph.D., P.E., D.WRE
Downloaded from ascelibrary.org by RMIT UNIVERSITY LIBRARY on 01/04/19. Copyright ASCE. For personal use only; all rights reserved.
Published by American Society of Civil Engineers
1801 Alexander Bell Drive
Reston, Virginia, 20191-4382
www.asce.org/publications | ascelibrary.org
Any statements expressed in these materials are those of the individual authors and do not
necessarily represent the views of ASCE, which takes no responsibility for any statement
made herein. No reference made in this publication to any specific method, product, process,
or service constitutes or implies an endorsement, recommendation, or warranty thereof by
ASCE. The materials are for general information only and do not represent a standard of
ASCE, nor are they intended as a reference in purchase specifications, contracts, regulations,
statutes, or any other legal document. ASCE makes no representation or warranty of any
kind, whether express or implied, concerning the accuracy, completeness, suitability, or
utility of any information, apparatus, product, or process discussed in this publication, and
assumes no liability therefor. The information contained in these materials should not be used
without first securing competent advice with respect to its suitability for any general or
specific application. Anyone utilizing such information assumes all liability arising from such
use, including but not limited to infringement of any patent or patents.
ASCE and American Society of Civil Engineers—Registered in U.S. Patent and Trademark
Office.
Photocopies and permissions. Permission to photocopy or reproduce material from ASCE
publications can be requested by sending an e-mail to
[email protected] or by locating a
title in ASCE's Civil Engineering Database (http://cedb.asce.org) or ASCE Library
(http://ascelibrary.org) and using the “Permissions” link.
Errata: Errata, if any, can be found at https://doi.org/10.1061/9780784481028
Copyright © 2017 by the American Society of Civil Engineers.
All Rights Reserved.
ISBN 978-0-7844-8102-8 (PDF)
Manufactured in the United States of America.
Congress on Technical Advancement 2017
iii
Preface
Downloaded from ascelibrary.org by RMIT UNIVERSITY LIBRARY on 01/04/19. Copyright ASCE. For personal use only; all rights reserved.
The Congress on Technical Advancement was established to bring together several of the
Divisions under the ASCE Board-level Committee on Technical Advancement (CTA) at a
single venue. While some of the CTA Divisions hold regular small conferences, others do
not have an established forum to present technical information to their constituents or the
engineering community. One of the goals of the Congress is to provide greater
opportunities for interaction and synergy among the activities of the Divisions and ASCE’s
Institutes. This 1st Congress on Technical Advancement was held at the Duluth
Entertainment and Convention Center in Duluth, Minnesota on September 10-13, 2017.
This 1st Congress included the participation of and presentations by the Aerospace
Engineering Division, Cold Regions Engineering Division, Committee on Adaptation to a
Changing Climate, Energy Division, Forensic Engineering Division, Infrastructure
Resilience Division, the Construction Institute (CI), and the Utilities Engineering and
Surveying Institute (UESI), representing the combination of existing conference series as
well as opportunities for new periodic technical symposia. The Congress was hosted by the
Duluth Section of ASCE as they celebrated their 100th Anniversary with a special session
and evening social event.
The 2017 Congress on Technical Advancement included 3 days of presentations with daily
plenary sessions followed by 6 parallel tracks of technical sessions providing a venue for
over 160 presentations. The conference also included an Awards Luncheon highlighted by
the presentation of the Harold R. Peyton Award for Cold Regions Engineering, the CANAM Civil Engineering Amity Award, the Charles Martin Duke Lifeline Earthquake
Engineering Award and the Alfredo Ang Award on Risk Analysis and Management of
Civil Infrastructure. Other recognitions during the Congress include the Eb Rice Lecture
Award, the Best Journal of Cold Regions Engineering Paper Award, and the Best Cold
Regions Conference Paper Award. An Opening Congress Reception, Duluth Section 100th
Anniversary Session and Social Event, and Technical Tours provided additional
opportunities for attendees to share ideas.
This collection of 60 papers brings together the current state of knowledge on a variety of
topic areas presented at the 2017 Congress on Technical Advancement and is separated
into three EBooks. The first represents selected papers from the Proceedings of the 17th
International Conference on Cold Regions Engineering. The second includes the papers on
Infrastructure Resilience, Aerospace and Energy. The third EBook presents papers
addressing Construction and Forensic Engineering.
I would like to thank all of the volunteers and ASCE Staff who have made this 1st
Congress on Technical Advancement and Proceedings possible. It could not have been
done without all of the authors, reviewers, attendees, and Congress Committee members.
Jon E. Zufelt, Ph.D., PE, D.WRE, F.ASCE Congress Chair and Proceedings Editor
© ASCE
Congress on Technical Advancement 2017
Acknowledgments
Downloaded from ascelibrary.org by RMIT UNIVERSITY LIBRARY on 01/04/19. Copyright ASCE. For personal use only; all rights reserved.
Congress Organizing Committee
Jon Zufelt, Ph.D, P.E., CFM, D.WRE, F.ASCE
James Anspach, P.G. (ret.), F.ASCE
Ron Anthony, Aff.M.ASCE
Hiba Baroud, Ph.D., Aff.M.ASCE
Ana Boras, Ph.D, P.E., M.ASCE
Martin Derby, A.M.ASCE
Mike Drerup, P.E., M.ASCE
Jim Harris, P.E., Ph.D, F.SEI, F.ASCE, NAE
John Hinzmann, P.E., M.ASCE
Jen Irish, Ph.D, P.E., D.CE, M.ASCE
John Koppelman, A.M.ASCE
Tom Krzewinski, P.E., D.GE, F.ASCE
Bob Lisi, P.E., M.ASCE
Juanyu "Jenny" Liu, Ph.D., P.E., M.ASCE
Pat McCormick, P.E., S.E., F.ASCE, F.SEI
Nick Patterson, P.E., M.ASCE
David Prusak, P.E., M.ASCE
Ziad Salameh, P.E., M.ASCE
J. "Greg" Soules, P.E., S.E., P.Eng, SECB, F.SEI, F.ASCE
Amy Thorson, P.E., F.ASCE
Nasim Uddin, P.E., F.ASCE
Joel Ulring, P.E., M.ASCE
ASCE Staff
Susan Davis, A.M.ASCE
Jon Esslinger, PE, F.ASCE, CAE
Mark Gable
Katerina Lachinova
Shingai Marandure
Amanda Rushing, Aff.M.ASCE
Jay Snyder, Aff.M.ASCE
Catherine Tehan, Aff.M.ASCE
Drew Caracciolo
© ASCE
iv
Congress on Technical Advancement 2017
v
Proceedings Reviewers
Downloaded from ascelibrary.org by RMIT UNIVERSITY LIBRARY on 01/04/19. Copyright ASCE. For personal use only; all rights reserved.
Il-Sang Ahn
Lorenzo Allievi
Ron Anthony
Navid Attary
Bilal Ayyub
Eugene Balter
Heather Brooks
Henry Burton
ZhiQiang Chen
Adrian Chowdhury
Edwin Clarke
Billy Connor
Craig Davis
An Deng
Alicia Diaz de Leon
Curt Edwards
Jon Esslinger
Caroline Field
Madeleine Flint
Chris Ford
Warren French
Subhrendu
Gangopadhyay
Rob Goldberg
Scott Hamel
John Henning
Jiong Hu
Baoshan Huang
© ASCE
Josh Huang
Joshua Kardon
Mehrshad Ketabdar
John Koppelman
Thomas Krzewinski
David Lanning
Spencer Lee
Jenny Liu
Hongyan Ma
Rajib Mallik
Tony Massari
Roberts McMullin
Ralph Moon
Anthony Mullin
Mark Musial
LeAnne Napolillo
Kevin Orban
Sivan Parameswaran
Tim Parker
Robert Perkins
Brian Phillips
Chris Poland
Allison Pyrch
Craig Ruyle
Bill Ryan
Stephan Saboundjian
Ziad Salameh
Andrea Schokker
Yasaman Shahtaheri
Jim Sheahan
Xiang Shu
John Smith
Ryan Solnosky
Greg Soules
Bucky Tart
Scott Tezak
Ganesh Thiagarajan
Eric Thornley
John Thornley
Jeff Travis
Nasim Uddin
Joel Ulring
Shane Underwood
Cindy Voigt
Dan Walker
Haizhong Wang
Chenglin Wu
Gang Xu
Zhaohui Yang
Kent Yu
John Zarling
Chris Zawislak
Weiguang Zhang
Jon Zufelt
Congress on Technical Advancement 2017
vi
Contents
Downloaded from ascelibrary.org by RMIT UNIVERSITY LIBRARY on 01/04/19. Copyright ASCE. For personal use only; all rights reserved.
Testing an Optimization/Simulation Model for the Real-Time Operations
of Water Distribution Systems under Limited Power Availability ........................ 1
Puneet Khatavkar and Larry W. Mays
Risk-Based Assessment of Texas Bridges to Natural and Induced Seismic
Hazards ...................................................................................................................... 10
Farid Khosravikia, Vyacheslav Prakhov, Andy Potter, Patricia Clayton,
and Eric Williamson
A Retrospective Analysis of Hydraulic Bridge Collapse ....................................... 22
Cristopher Montalvo and Wesley Cook
Black Sky Hazards: Resilience Planning ................................................................ 29
John F. Organek
Water Supply Damage, Recovery, and Lifeline Interaction in an
Earthquake Sequence ............................................................................................... 41
Keith Porter, Serge Terentieff, Roberts McMullin, and Xavier Irias
Balanced Lifeline System Resilience: Collaborative Convening
Platforms in the San Francisco Bay Area............................................................... 53
Michael Germeraad
Performance of Interdependent Lifelines in the Pacific Northwest Resulting
from an Earthquake on the Cascadia Subduction Zone: A Portland
Example ..................................................................................................................... 62
Michael Saling and Michael Stuhr
Mapping Slope-Failure Susceptibility for Infrastructure Management ............. 69
Omid Mohseni, Mike Strong, Aaron T. Grosser, Charles Hathaway,
and Aaron M. Mielke
City of Portland Water Bureau Business Continuity Plan
(BCP)/Continuity of Operations (COOP) Case Study .......................................... 79
Teresa Elliott, Kim Anderson, Kent Yu, Jamaal Folsom, and Mary Ellen Collentine
Post-Earthquake Restoration Modelling of a Railway Bridge Network ............. 91
Sushreyo Misra and Jamie E. Padgett
© ASCE
Congress on Technical Advancement 2017
Permafrost-Supported Linear Infrastructure Risk Analysis Software:
Design and Goals..................................................................................................... 104
Heather Brooks, Guy Doré, and Ariane Locat Jr.
Downloaded from ascelibrary.org by RMIT UNIVERSITY LIBRARY on 01/04/19. Copyright ASCE. For personal use only; all rights reserved.
The Core Competencies of Resilience ................................................................... 116
Richard A. Fosse
Experimental Characterization of Hazard-Resilient Ductile Iron Pipe
Soil/Structure Interaction under Axial Displacement ......................................... 124
Brad P. Wham, Chalermpat Pariya-Ekkasut, Christina Argyrou, Addie Lederman,
Thomas D. O’Rourke, and Harry E. Stewart
A Longitudinal Study of Tohoku Telecommunication Network Three
Years after the Great East Japan Earthquake and Tsunami ............................. 135
Alex Tang, Alexis Kwasinski, and Kent Yu
Blast Analysis of Aging Transportation Structures with Little Stand-Off
Distance .................................................................................................................... 143
Yongwook Kim, Salvatore Florio, and Qian Wang
Modular Preference Function Development Strategy for the Design of
Multi-Hazard Resilient and Sustainable Buildings ............................................. 152
Yasaman Shahtaheri, Jesus M. de la Garza, and Madeleine M. Flint
United States Energy Issues ................................................................................... 165
Sam Bandimere
© ASCE
vii
Congress on Technical Advancement 2017
Testing an Optimization/Simulation Model for the Real-Time Operations of Water
Distribution Systems under Limited Power Availability
Puneet Khatavkar1 and Larry W. Mays, F.ASCE2
Downloaded from ascelibrary.org by RMIT UNIVERSITY LIBRARY on 01/04/19. Copyright ASCE. For personal use only; all rights reserved.
1
Graduate Student, School of Sustainable Engineering and the Built Environment, Arizona State
Univ., Tempe, AZ 85257-5306. E-mail:
[email protected]
2
Professor, School of Sustainable Engineering and the Built Environment, Arizona State Univ.,
Tempe, AZ 85257-5306. E-mail:
[email protected]
Abstract
This paper presents a new methodology for the real-time operation of water distribution systems
under critical conditions of limited electrical energy due to emergencies such as extreme drought
conditions, electric grid failure, and other severe conditions related to natural conditions. The
basic objective of optimizing the operations of a water distribution system under limited
availability of energy is to attempt to satisfy the required levels of demand at various locations
while meeting pressure requirements of the system and maintaining an optimal pump schedule.
The approach adopted here is to interface an optimization procedure (genetic algorithm) with a
simulator (EPANET) in the framework of an optimal control problem to determine the real-time
optimal operation of a water distribution system under limited electrical input. The genetic
algorithm (GA) searches over pump operation in combination with maximizing the demands that
can be satisfied with limited energy input. The interfacing of the simulator and the genetic
algorithm has been accomplished within the framework of MATLAB.
INTRODUCTION
The interdependencies between the electric power system and the water distribution utility
systems have long been recognized. These two systems, collectively, are known informally as
the water-energy nexus. The interaction between these two critical infrastructures are being
studied using a coupled, time-domain simulation. The ultimate desired need would be for the
actual systems to exchange real time data. Software Defined Networking (SDN) could be used
to represent the communication overlay implemented via a middleware architecture (see Figure
1). This overlay enables a reliable and efficient data exchange between the two otherwise
isolated supervisory control and data acquisition (SCADA) systems. This is the ultimate
measure of how the two systems behave when subjected to various disturbances in either system
as well as under conditions of long-term water shortages. The control actions undertaken in both
networks represent an improvement over the current implementations due to the increased
situational awareness resulting from the exchanged information.
Real-time Operation Framework during Limited Electrical Energy Input
The basic objective of optimizing the operations of a water distribution system under limited
availability of energy is an attempt to satisfy the required levels of demand at various locations
while also meeting pressure requirements of the system. The objective statement formulated
here considers a particular required or desired demand. The following describes the overall
concept of the real-time operation.
© ASCE
1
Downloaded from ascelibrary.org by RMIT UNIVERSITY LIBRARY on 01/04/19. Copyright ASCE. For personal use only; all rights reserved.
Congress on Technical Advancement 2017
1. At real-time t receive electrical energy input from electrical system.
2. Receive latest data (status of pumps, tank levels, status of valves, and flows in and out of
the system from the SCADA system.
3. Update the EPANET water distribution system (WDS) input using data from the SCADA
system.
4. WDS optimization model is run to determine the actual demand pattern and pump
operation that can be met with the limited electrical energy input. During the
optimization/simulation process the EPANET model is used repeatedly within the genetic
algorithm optimization to determine the status of the network over the next 24 hours.
The optimization model is searching over the decision variables which are the pump
operation and the demand pattern that can be satisfied during the limited electrical energy
input. The simulator is determining the values of the state variables (nodal pressure
heads, pipe flows, and tank levels) for each set of control variables determined in the
optimizer.
5. Implement the optimal pump schedule over the next one hour only which is
accomplished through the SCADA system.
6. Repeat steps 1 through 5 continuously during the emergency event each time
incrementing the time t = t + ∆t in which case ∆t = 1 hour.
MODELLING APPROACH
The overall model interface between the genetic algorithm (WDS optimization model) and the
EPANET (Rossman, 2000) simulator is accomplished using MATLAB as shown in Figure 2.
The interface between MATLAB and EPANET is performed using the open-source EPANETMATLAB toolkit (Eliades, 2016). The interface facilitates use of all the functionalities in the
original EPANET code written in C++ language within the MALTAB environment by passing
the various commands to and from the MATLAB mathematical language to the EPANET
simulator. This toolkit was used in conjunction with genetic algorithm (GA) in MATLAB to
accomplish an overall optimization/ simulation methodology for a WDS. The methodology
works through an interface facilitating data exchange between three systems viz. optimization
model (reduced problem), WDS Supervisory Control and Data Acquisition (SCADA) system
and a WDS hydraulic simulator (EPANET) as shown in Figure 2.
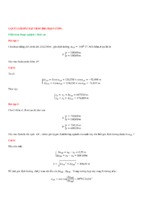
Figure 3 is a schematic of the overall simulation/optimization procedure being
implemented for every unit time period for the entire simulation period. Starting at the first time
period, the optimization/simulation model in MATLAB receives inputs from the power
optimization/simulation model including observed and predicted power availability schedule for
each time period and data from WDS SCADA system including pressure heads, discharges and
tank levels as well as pump status at various nodes and links in the system. The
optimization/simulation model for WDS is then run with the updated information to obtain the
pump controls and demand satisfaction multipliers for the next time period, several times until
the GA stopping conditions are met. The solution of the GA is then sent to the power
optimization/simulation model and the WDS SCADA system as inputs for the next time period.
This process is continued till the last time period for simulation is reached.
© ASCE
2
Downloaded from ascelibrary.org by RMIT UNIVERSITY LIBRARY on 01/04/19. Copyright ASCE. For personal use only; all rights reserved.
Congress on Technical Advancement 2017
Figure 1 Real-time operation model for
power and water systems operation
3
Figure 2 Optimization framework for WDS
operation
Figure 3 Schematic of the overall simulation/optimization procedure
© ASCE
Congress on Technical Advancement 2017
4
Downloaded from ascelibrary.org by RMIT UNIVERSITY LIBRARY on 01/04/19. Copyright ASCE. For personal use only; all rights reserved.
EXAMPLE APPLICATION
The example system is a hypothetical water distribution system (WDS) shown in Figure 4,
including two cities and a hypothetical power distribution system (PDS). The PDS is based on
the IEEE 14 bus system (Kodsi and Canizares, 2003), which consists of five power plants. The
cooling water for these power plants is supplied from both a freshwater source and from the
reclaimed wastewater waste water treatment plant (WWTP). City 1 consists of four pressure
zones with a total base demand of 30,000 gpm and City 2 consists of five pressure zones with a
total base demand of 25,000 gpm. A total of 17 freshwater pumps and 11 reclaimed water
pumps serve the WDS. Figure 5 is a schematic of the directions of flows taking place within the
system.
Figure 4: Example WDS system
PW1
PW2
PW3
PW4
Power Plant
PW
PW5
Pumping Station
P
Check valve
P
Water line
P
Sewer line
P
P
P
Source
P
P
P
P
P
P
WWTP
City 1
City 2
Figure 5 Schematic of water supply system
© ASCE
P
5
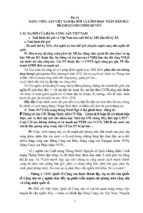
City 1 has four pressure zones designated as nodes 1.1 – 1.4, and city 2 consists of five pressure
zones designated as nodes 2.1 – 2.5. Each pressure zones has a separate demand pattern (Figure
6). The WDS has six demand patterns. One pattern applies to all the residential zones within the
cities and separate demand patterns are provided for each of the 5 five power plants in the
system.
Pipes in the WDS are categorized into three types. The first type includes main lines (ML1 –
ML7), which connect the freshwater pumps to the various power plants and cities. The second
type is intermediate lines (IL 1.1 – IL 1.4 and IL 2.1 – IL 2.5), which are interconnecting nodes
within the cities. The reclaimed water pipelines (RW1 – RW5) are the pipes connecting the
waste water treatment plants to the five power plants in the system respectively.
The pumps supporting the WDS are categorized as fresh water pumps (WP1 – W7 series) and
reclaimed water pumps (RWP1 – RWP5 series). Five types of pumps are used in the system with
each with different pump curves.
Demand patterns for test system
1.8
1.6
Demand Multiplier
Downloaded from ascelibrary.org by RMIT UNIVERSITY LIBRARY on 01/04/19. Copyright ASCE. For personal use only; all rights reserved.
Congress on Technical Advancement 2017
1.4
1.2
1
0.8
0.6
0.4
0.2
0
1
6
11
16
21
Time (hour)
Demand Pattern 1
Demand Pattern 2
Demand Pattern 3
Demand Pattern 4
Demand Pattern 5
Demand Pattern 6
Figure 6. Demand patterns for example system
The simulation – optimization procedure illustrated in Figure 3 was applied to the operation of
the example system under conditions of limited power availability at a few pumps in the system
during a 24-hour real-time simulation run of the system. Table 1 gives the details of the pumps
affected due to the limited power availability at these pumps. The power input was received as
an input from the power simulation – optimization model.
© ASCE
Congress on Technical Advancement 2017
6
Table 1. Details of pumps affected by limited power availability
Downloaded from ascelibrary.org by RMIT UNIVERSITY LIBRARY on 01/04/19. Copyright ASCE. For personal use only; all rights reserved.
Pump #
WP 4.1
WP 4.2
WP 4.3
RWP 1.1
RWP 1.2
RWP 2.1
RWP 2.2
RWP 2.3
Time of Power
Outage (Hrs.)
3:00 to 8:00
3:00 to 8:00
3:00 to 8:00
3:00 to 6:00
3:00 to 6:00
3:00 to 6:00
3:00 to 6:00
3:00 to 8:00
Power Available
(kw-hr)
0.00
0.00
0.00
0.00
0.00
0.00
0.00
0.00
Consumer Served
City 1
City 1
City 1
Power Plant (PW1)
Power Plant (PW1)
Power Plant (PW2)
Power Plant (PW2)
Power Plant (PW2)
RESULTS OF EXAMPLE APPLICATION
The results of application of the optimization – simulation model to the example system for a
scenario of limited power availability at certain pumps for a certain time during real – time
operations simulation for a 24-hour period are presented in Figures 7 and 8. Figures 7 (a) – (f)
show the time series of the power available and the power consumed by pumps WP4.1, WP4.2,
WP4.3, RWP1.1, RWP1.2, RWP2.1, RWP2.2 and RWP2.3 respectively. Figures 8 (a) – (f) show
the required and supplied demand multipliers for residential zones of city 1 and city 2 and the
five power plants respectively. It could be observed from Figures 7 (a) – (f) that the trends of
power consumption closely follow the trends of power availability and the power consumed
consumption never exceeds the availability.
During the periods of power outage (listed in Table 1) the pumps are switched off, as
indicated from the power consumption in Figure 7. The methodology aims at minimizing the
demand deficit (difference between the required and supplied demands) for various consumer
points in the system. The resulting demand pattern multipliers shown in Figure 8 (a) – (b) depict
minimal deficits between the required and supplied demands. An average demand satisfaction of
91 percent was observed in this application. The maximum demand deficits are experienced
during the period of power outages, while a few could be observed during non-power outage
hours of the day. Changes in the pumping schedule due to the power outage, leads to adverse
effects on the water storage in the system. Scarcity of stored water in the system causes low
pressures at the nodes, leading to lower pressure bound violations. Demand deficits could be
observed (in Figures 8 (b), (c) and (d)) even during the non-outage period, since the optimization
model attempts to reduce the pressure bound violations by reducing the demands in that
particular zone.
© ASCE
Downloaded from ascelibrary.org by RMIT UNIVERSITY LIBRARY on 01/04/19. Copyright ASCE. For personal use only; all rights reserved.
Congress on Technical Advancement 2017
(a) Pump WP4.1
(c) Pump WP 4.3
(e) Pump RWP 1.2
© ASCE
7
(b) Pump WP4.2
(d) Pump RWP 1.1
(f) Pump RWP 2.1
Downloaded from ascelibrary.org by RMIT UNIVERSITY LIBRARY on 01/04/19. Copyright ASCE. For personal use only; all rights reserved.
Congress on Technical Advancement 2017
(g) Pump RWP 2.2
8
(h) Pump RWP 2.3
Figure 7. Power availability and consumption patterns for pumps affected by power outage
(a) Pattern 1 - Residential
(c) Pattern 3 – PW 3
© ASCE
(b) Pattern 2 – PW 1
(d) Pattern 4 – PW4
Downloaded from ascelibrary.org by RMIT UNIVERSITY LIBRARY on 01/04/19. Copyright ASCE. For personal use only; all rights reserved.
Congress on Technical Advancement 2017
(e) Pattern 5 – PW 5
9
(f) Pattern 6 – PW 6
Figure 8. Required and satisfied demand pattern multipliers for different consumers in the
example system
CONCLUSIONS
The example application of the model provides evidence of applicability of the model for realtime operations of a realistic WDS under limited power availability. The demands are observed
to be satisfied in the period of sufficient power availability while the demand satisfaction is
curtailed in case of limited power availability time periods. It is thus concluded here that the
model presented in this paper is a novel approach towards optimization of WDS operations under
normal as well as limited power conditions. The methodology presented in this paper can be used
in conjunction with a similar optimization/simulation model for power distribution system to
obtain real time operations of a combined power – water system, thus providing a robust solution
for cascading failures arising out of contingencies in any of the system.
REFERENCES
Elíades, D. (2009). EPANET MATLAB Toolkit. KIOS, University of Cyprus. Nocosia, Republic
of Cyprus. https://www.mathworks.com/MATLIBcentral/filesexchange/25100-kios-researchepanet-MATLAB-tookit/
Kodsi, S.K.M and Canizares, C.A. (2003). Modeling and simulation of IEEE 14 bus systems
with FACTS controllers. Technical Report (vol. 3), University of Waterloo, Waterloo,
Canada.
Rossman, L.A. (2000). EPANET-2 User’s Manual. EPA/600/R-00/057, U.S. Environmental
Protection Agency, Cincinnati, USA.
© ASCE
Congress on Technical Advancement 2017
Risk-Based Assessment of Texas Bridges to Natural and Induced Seismic Hazards
Farid Khosravikia, M.ASCE1; Vyacheslav Prakhov2; Andy Potter3; Patricia Clayton4;
and Eric Williamson5
Downloaded from ascelibrary.org by RMIT UNIVERSITY LIBRARY on 01/04/19. Copyright ASCE. For personal use only; all rights reserved.
1
Ph.D. Student, Dept. of Civil, Architectural, and Environmental Engineering, Univ. of Texas at
Austin, Austin, TX. E-mail:
[email protected]
2
Graduate Student, Dept. of Civil, Architectural, and Environmental Engineering, Univ. of Texas
at Austin, Austin, TX. E-mail:
[email protected]
3
Graduate Student, Dept. of Civil, Architectural, and Environmental Engineering, Univ. of Texas
at Austin, Austin, TX. E-mail:
[email protected]
4
Assistant professor, Dept. of Civil, Architectural, and Environmental Engineering, Univ. of
Texas at Austin, Austin, TX. E-mail:
[email protected]
5
Professor, Dept. of Civil, Architectural, and Environmental Engineering, Univ. of Texas at
Austin, Austin, TX. E-mail:
[email protected]
ABSTRACT
The primary objective of this paper is to study the effects of natural and induced seismic hazards
on Texas bridges. Predicted structural damage forms the primary performance metric for this
study. The motivation for this research stems from the significant increase in the number of
earthquakes greater than magnitude 3.0 in Texas over the past five years. Texas is historically
known as a non-seismic region; therefore, this significant increase in seismicity raises concerns
over the safety of infrastructure designed with little to no consideration of seismic demands. The
bridge population is characterized by different classes, and for each class, computationally
efficient nonlinear models are implemented for simulating damage intensity in non-seismically
detailed bridge components. The damage level is evaluated based on deformations of bridge
components, namely bridge bearings in this paper, and fragility functions representing the
probability of exceeding each damage state for various bridge classes are generated. The results
show that although it is not likely to have full damage of bearing components after the
earthquake, it is more likely to have slight and moderate. This information will be used to inform
post-earthquake inspection plans and identify the most vulnerable bridge types in terms of
bearing fragility.
Keywords: Risk-based assessment; Induced seismic hazards; Bridge assessment; Structural
Damage
© ASCE
10
Congress on Technical Advancement 2017
INTRODUCTION
Beginning in 2008, the rate of earthquakes in Texas greater than magnitude 3 increased from
approximately two per year in previous decades to about twelve per year (Frohlich et al. 2016;
Downloaded from ascelibrary.org by RMIT UNIVERSITY LIBRARY on 01/04/19. Copyright ASCE. For personal use only; all rights reserved.
Hornbach et al. 2016). Most of these earthquakes occurred primarily in areas nearby wastewater
injection wells, and it is believed that the majority of these earthquakes are human-caused,
associated with petroleum production or wastewater disposal (Frohlich et al. 2016; Hornbach et
al. 2016). More importantly, these earthquakes occurred in areas that historically have had
negligible seismicity, and therefore, infrastructures in these areas were designed with little to no
consideration of seismic demands. Therefore, this recent increase in human-induced seismicity
raises concerns over the safety of Texas infrastructure. This study addresses the vulnerability of
Texas bridges to the effects of natural and induced seismic hazards. Predicted structural damage
forms the primary performance metric for this study. Previous research has been done to assess
seismic hazards and bridge vulnerability in regions across the Central and Eastern United States
(CEUS). However, no such study had been done specifically addressing seismic vulnerability of
the bridge inventory in Texas, which use different details than other CEUS states with no seismic
design considerations. This is done with utilizing a probabilistic framework which considers
major sources of uncertainty such as uncertainty in ground motions and local soil conditions, as
well as uncertainty in design and detailing practices over past decades when the bridge
population was constructed.
To assess the seismic vulnerability of the bridge infrastructure in Texas, it is necessary to
address two key parameters:
1) Seismic hazard. Seismic hazard maps are used to geographically show the level of shaking
that is expected due to natural and non-natural earthquakes. Development of a seismic hazard
map of Texas requires that one first understand the locations and expected magnitudes of
potential earthquakes that can occur across the state. To do so, ground motion prediction models
specific to the geologic and soil conditions across the state are required to predict the intensity of
ground shaking. Work is currently being done in collaboration with researchers at The University
of Texas at Austin (UT) in Geotechnical Engineering (Cox Rathje), the UT Institute of
Geophysics (Frohlich, Walter), and the UT Bureau of Economic Geology (Paine). These
collaborators develop ground motion prediction equations based on recordings throughout the
© ASCE
11
Congress on Technical Advancement 2017
state, and they estimate the shear wave velocity over the top 30 m of soil, VS30, across the state of
Texas.
2) Seismic vulnerability, or fragility, of Texas bridges. Fragility curves can be used to predict
Downloaded from ascelibrary.org by RMIT UNIVERSITY LIBRARY on 01/04/19. Copyright ASCE. For personal use only; all rights reserved.
the likelihood of bridge damage for a given level of seismic intensity, measured by metrics such
as Peak Ground Acceleration (PGA) or spectral acceleration at a structure’s fundamental period
(Sa(Tn)). Developing seismic fragility curves for Texas bridges requires an understanding of the
inventory, structural detailing, and seismic behavior of typical bridges in the state. This part of
the seismic assessment is the focus of the current paper. Quantification of bridge vulnerability
and seismic hazards across the state is used to develop a rapidly-deployable post-earthquake
response plan for state bridge officials. Establishing a post-event response plan can help ensure
public safety and facilitate economic and timely bridge inspections following a seismic event.
To create probabilistic models of expected bridge damage, the sources of uncertainty in
bridge demands and capacities are taken into account. One approach to creating empirical
fragility curves is to observe damage in constructed bridges following real earthquakes. While
this approach inherently incorporates variability in material strength, construction quality,
seismic demands, detailing, etc., it requires that a significant number of bridges be damaged
during one or more seismic events to make meaningful probabilistic models. This approach is
not feasible for predicting probabilistic seismic damage in Texas bridges since little to no bridge
damage data exist from past seismic events in Texas. Alternatively, an analytical fragility curve
can be developed in which numerical models representative of Texas bridges and ground motion
records representative of Texas seismic hazards are used.
The numerical models used to develop analytical fragility curves are capable of simulating
bridge damage that may occur under seismic loading. To name but a few, the typical damage in
bridge are bearing deformation and unseating, column damage, abutment and bridge deck
pounding. Such models should incorporate potential variation, or uncertainty, in bridge geometry
and component strength. The bridge population is characterized by different classes, and a set of
bridges representative of each class are established using statistical sampling techniques. Using
Monte Carlo Simulation methodologies, each bridge model parameter such as concrete strength,
bearing stiffness, unit-weight, span length, column height, is selected from its respective
probabilistic distribution as determined from the Texas bridge inventory. Like previous studies
such as Zelaschi et al. (2015b), bridge samples are selected from the population to account for
© ASCE
12