TECHNICAL REPORT
ON
TEXTILE APPLICATION OF THE
COLOR SENSITIVITY OF DYE
MIXTURES
TEXTILE LABORATORY
APPLIED CHEMISTRY RESEARCH CENTRE.
1
TECHNICAL REPORT
ON
TEXTILE APPLICATION OF THE
COLOR SENSITIVITY OF DYE
MIXTURES
Prepared By
Javaid Mughal, Mansoor Iqbal and Muhammad Naeem
(A Team of Textile Scientists at PCSIR Lab Complex Karachi)
E-mail:
[email protected]
[email protected]
[email protected]
TEXTILE LABORATORY
APPLIED CHEMISTRY RESEARCH CENTRE
2
INTRODUCTION:
Cotton is the backbone of the world’s textile trade. It has many qualities and countless end
uses, which make it one of the most abundantly, used textile fibres in the world. It is a seed
hair of plant of genus gossypium, the purest form of cellulose found in nature. However,
cotton is one of the most problematic fibres as far as its general wet processing or dyeing is
concerned. Quite frequently, the problems in dyed cotton materials are not due to the actual
dyeing process but due to some latent defects introduced from previous production and
processing stages. Often, the root-cause of a problem in the dyed material can be traced as far
back as to the cotton field.
The dyeability variations are cotton obtained from different sources. It has been suggested
that the substrate should be obtained from a single source, wherever possible, in order to keep
the dyeability. Variations than other, those dyes should be selected for dyeing which are less
sensitive to dyeability variation. In dyeing, if resultant shade for a dye mixture passes the
quality examination after its first dyeing, the product is called a right-first-time product. The
process producing the right-first-time product is thus called a right-first-time process: one that
is economical because it consumes the least energy, labor, and time etc. To produce a rightfirst-time product, process control is essential for dyeing and, to enable this, many modern
dyeing control systems have been developed. Unfortunately, errors in the dyeing operation
will still sometimes occur. Therefore employing a low-sensitivity recipe in dyeing may be an
alternative approach. Should dyeing errors occur, the less sensitive the recipe is to such
errors, the more chance there is that the resultant shade will successful.
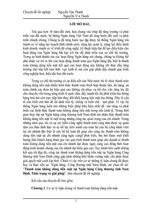
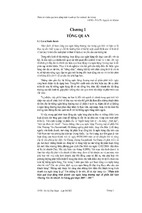
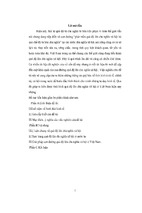
Target Shade
Dye Brand
Sensitivity
Normal
Concentration
Sensitivity
Modified
Dye
Total
Sensitivity
Temperature
Sensitivity
Time
Sensitivity
Auxiliaries
Sensitivity
Liquor Ratio
Sensitivity
Temperature
Change database
Time
Change database
Auxiliaries
Change database
Liquor Ratio
Change database
Figure 1: Procedure for predicting colour sensitivity.
3
The research that has been done in this field has been limited to establishing and applying a
method of predicting the colour sensitivity of a matching recipe. This research help us the
selection of dyes in a mixture recipe for dyeing. However, in practice, the effectiveness of the
recipe solution by the concentration sensitivity could be only marginal and other parameters
might be more important to the recipe performance than an error in the dye concentration.
Therefore it is important to consider colour sensitivity in its widest possible context. Dye
sensitivity is collection of various functional parameters. If we want to measure reactive dye
sensitivity, we must know the conditions, type of dyes added, nature of dyeing (PDC, PB,
Exhaust), what auxiliaries are added, time, temperature, liquor ratio, fabric etc. so many
factors affected on the dyes sensitivity.
Sensitivity measuring terminology:
Sensitivity has two major parts first, part is to do the changes in dyeing parameters
chemically or mechanically, in second part is to measure the sensitivity by colour measuring
instruments in the terms of K/S, CIE Lab, %E, %F, Build-up properties, Strength comparison
or by fastness properties.
There are many diverse reasons for measuring colour, and instrument requirements vary
widely with each application. Relative measurements at a single location are obviously less
stringent than absolute measurements that must provide comparable data when measured at
different locations. Spectrophotometers, colorimeters, and instruments that combine various
features of both are available to meet most of these requirements. Although simple, low-cost
colorimeters and spectrophotometers are usually adequate for relative colour measurements
on specific problems, the more complex and costly double-beam recording
spectrophotometers, interfaced to a computer, is the preferred instrument system for the
general analysis of synthetic dyes.
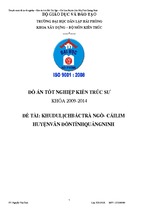
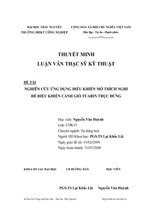
Colour is three dimensional, a property that is apparent in various ways. Colour atlases
arrange colours using three scales (Hue, value and chroma) in the case of the Munsell system.
To accurate specification of object colours and colour differences, CIE recommended threedimensional uniform colour spaces-CIE Lab and CIE LUV in 1976. Since the equations are
long, they are omitted here. These are called the CIE 1976 (L* a* b*) colour space or CIE
Lab colour space, and the other, CIE 1976 (L* U* V*) colour space or CIE LUV colour
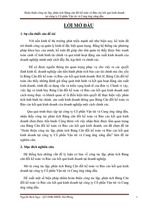
space, and have similar structures as the Munsell colour solid. In imaging applications, CIE
Lab space is commonly used. In CIE Lab space, L* shows the lightness, and (a* b*) the
colour as shown in fig, 1
Figure 1. CIE Lab.
4
The coordinate (L*, a*, b*) is calculated from the (x, y, z) of the given light stimulus and
(Xn, Yn, Zn) of the white point. Therefore, the CIE Lab space has a function of correcting for
chromatic adaptation to the white point, and is intended for object colour and displays. The
colour difference in the CIE Lab space is calculated as the Euclidean distance between the
points in this three-dimensional space, and is given by,
ΔE*ab = [ (ΔL*)2 + (Δa*)2 + (Δb*)2
]1/2
This equation is called the CIE 1976 (L* a* b*) colour difference formula .The chroma C*ab
and the hue angle hab are also calculated from (l * a* b*) by,
C*ab = (a*2
Hab
= tan-1
+
b*2)1/2
(b*/a*)
The CIE LUV space is defined in a similar manner, and the coordinate (L*, U*, V*) is
calculated from the Y and (u’, v’) of the given light stimulus and the white point. The colour
difference, ΔE*ab is widely used; its chroma scale is known to be fairly nonlinear. For more
accurate colour difference evaluations, CIE recommended an improved industrial colour
difference formula in 1994-CIE 94 formula. The colour difference ΔE* is calculated from
ΔL*, ΔC*ab and ΔH*ab of the CIE Lab formula. Another improved formula, the CMC colour
difference formula, is mainly used in textile industry. Further improved colour difference
formulas are being investigated by CIE.
In CIE Lab, the selections of light sources are also available in the system.
• An artificial day light source, D65.
• A tungsten-filament sources.
• A three-band fluorescent sources TL84.
• A UV source (For enhancing fluorescent white)
Steps in the determination of a dyeing recipe:
A recipe of dyes consists of one or many dyes, the quality of each dye (in the quantity of
product that should be used at the beginning of the dyeing) and the application process. Recipe
of dyes also indicates all the parameters of dyeing process, such as the temperature, time,
liquor ratio, quantity of chemicals and auxiliaries.
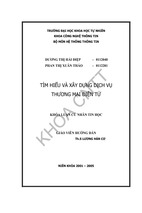
The determination of a dyeing recipe takes place in three main steps:
First step:
The first step consists of selection of the dyestuffs and of the dyeing process that may be used
to calculate the recipes of dyes.
Second step:
The second step is the calculation of the recipes of dyes from the previously selected objects.
This calculation is done from calibration range of dyes. A calibration range consists in dyeing
an article, using a specific process and with several concentration of dyes. Computer provides
5
a mean of testing alternative dye combinations to find the optimum mixture that will
minimum cost and /or color difference relative to the target shade.
The number of recipes to be predicted rises very rapidly as the number of possible dyes is
increased. Then, it is very important to eliminate as soon as possible, all the objects that will
not permit the requirement to be fulfilled. Moreover, in the case of article made of several
fibers, such as cotton/polyester articles, a recipe of dye has to be calculated for cotton fiber,
and another one for the polyester fibers.
Third step:
In the third step “best” calculated recipe of dyes is selected. The complete dyeing recipe is
determined. Then a sample is dyed and if the dyed sample has the desired color and if the
client requirements are fulfilled, this dyeing recipe is accepted for production. If the desired
color is not obtained, then the recipe of the dyes is to be modified (i.e. the concentration of
each dyes), until the color difference between target and the match sample is negligible.
Finally if the requirements are not achieved by the dyeing recipe (for instance the washing
fatness is too low), then the dyer must choose another recipe of dyes. Whenever there is some
difficulties with all the calculated recipes of dyes, it means that the textile processing mills
can not fulfill the client specifications due to dyes or process.
At present, there are tools that permit the recipe of dyes to be calculated by using the Kubelka
– Munck’s relationship or K / S values.
Fig. Process of determination of a dyeing recipe.
6
COLOR SENSITIVITY OF DYE MIXTURE:
Formulating colorant recipes to match target colours is not an easy task. Manual color
prediction often uses a trial and error method, for which the experience of the colourist is
essential. The majority of color matching also required color to be matched not only under
daylight, but also under other artificial light sources such as cool white fluorescent (CWF),
TL84, D65, etc. a previous recipe archive is very useful for manual color matching. A colourist
would firstly search the previous recipe archive to find out the closest colour matching target
or standard and then make sure adjustment to the recipe if the recipe color is not the exact
match to the target. However this trial and error process is lengthy and arduous even for a
professional colourist.
Computer color matching is an alternative method. Alderson first discovered the commercial
application of computer color recipe formulation in textile in 1961.the computer color
matching becomes a necessity for a modern dye house to install a computer colorant
formulation system. Color matching to a target shade depends not only on the formulation
system but also on the:
-
Accuracy of the recipe preparation.
The repeatability of the dyeing process.
The color measurement process.
There is a need of quality control at each step in the coloration and the measuring process.
The core of the formulation system is based on the theory developed by Kubelka & Munk
known as Kubelka – Munk theory.
Recipe correction:
After recipe formulation, a new color sample can be produced according to the colorant
concentration suggested. Because of the influence of the various variables in the dyeing
process, the produced sample may not be acceptable and a recipe correction process may be
needed.
Laboratory correction:
Laboratory correction gives a fresh recipe according to what was obtained by previous
dyeing. The new concentration calculation as follows:
Cn = Cp X Cu / Cb
(1 ).
Cn = Cp + Cu - Cb
(2 ).
or
Where
Cn = corrected recipe.
Cp = predicted recipe for target.
7
Cu = recipe used in dyeing equal to Cp .
Cb = recipe back – predicted for the batch dyeing results.
Correction method in equation 1 is called weighted or ratio correction and that is given in
equation 2 is called additive correction.
Production correction:
Production correction predicts the additional amount of dyes to be added to the dyeing bath:
Cadd = Cn -
Cu
(3 ).
Where Cn is calculated according to the laboratory correction via either weighted or additive
methods. There is no beed – off included in the calculation. It may be added if bleeding is a
problem.
If a batch is already too dark compared with standard this correction for exhaust dyeing will
fail, mean that the absorbed dyes should be stripped before correction. for continuous dyeing
diluents need to be added to dilute the dye liquor,. However for a slight dark color, the
production correction for exhaustion dyeing should correct huge difference and try to reduce
the overall color difference.
Visual assessment of colour:
For the visual determination of the specification of an unknown specimen, a colour atlas is
viewed alongside the specimen under prescribed conditions. An approximate specification of
the specimen is given by the denotation of the chip juded closest to its colour. The human
visual system can distinguish several million colour, however, where as most colour atlases
contain at best a few thousands chips. Even the most comprehensive systematic sampling of
colour space yet produced, whilst the human visual system is an excellent null detector (being
very capable of assessing whether or not colours match), it is not good at estimating the
relative magnitude of differences in colour. If several assessors interpolate to arrive at
specification their reports usually differ, after significantly, and even the some assessor
assessing on different occasions usually gives a variety of specifications. In an experiment,
the ICI colour atlas coordinates of six specimens were assessed, to the nearest chip, by five
experienced assessors under identical conditions on each of six occasions, not one assessor
chose the same three coordinates for any specimen on all occasions, and one assessor did not
choose the same three coordinates, for three of the specimens, on any occasion.
Lack of correlation between interpolations is one of the principle problems of visual methods
of specifying colour. Nevertheless colour atlases continue to be used because it is necessary
in same applications, and desirable in others, to have available a collection of chips
systematically sampling colour space.
Variables in the analytical method:
Specific details concerning sampling, solvents, weights, volumes, and special techniques to
cope with solution and measurement idiosyncrasies must be established individually for each
species of colorant. Although several of these problems are minimized simply by good
analytical technique, some problems are unique to the spectrophotometeric measurement of
8
colorants in solution. A few of the pitfalls encountered in solution coloristics are discussed
below.
Solution variables:
Solution variables may have a pronounced effect on colour measurement. Each effect should
be considered from its dual aspect; by measuring the material the effect may be studied, and
by controlling the effect the material may be determined. In developing an analytical method
each new colorant should be screened to determine its behaviour towards each of the solution
variables. If a solution variable is found to have a significant effect on the coloristics,
conditions must be changed to maximize analytical precision. Shade and strength parameters
may both vary with solution conditions, one parameter may change without any significant
effect upon the other.
Concentration effect:
Variation in absorptivity with concentration represents non-conformance to beer’s law rather
than a failure of the law. Beer’s law holds for single molecular or ionic species of the colorant
being analysed. If aggregate molecules or ions are present in equilibrium, the equilibrium
may shift with changes in the concentration and the system does not conform to Beer’s law.
If the aggregate equilibrium is constant with changes in concentration, the system conforms.
Conformance to Beer’s law is required to obtained reliable coloristics data. Non conformance
is usually dealt with by narrowing the concentration range or by changing the solvent strength
alone can be accurately determined in a non conforming system either measuring the
absorbance at an isobestic point or by making appropriate corrections from a predetermined
plot of absorbance versus concentration.
Temperature effect:
At very low temperature the molecular vibrations of a colorant may be so restricted that the
solution becomes colourless. At room temperature and higher, colour variation with
temperature is usually attributed to isomerization, aggregation, or chemical reaction.
Temperature effects on coloristics properties are either reversible or irreversible. A reversible
effect during heating to dissolve the dye is unimportant because the original form is obtained
after cooling. If an irreversible change occurs during heating for dissolution conditions can be
changed to avoid the temperature effect. If temperature affects the dilute solution it should be
thoroughly investigated to determine whether the change is reversible and at what
temperature the changed occurs.
pH effect:
The initial pH of the dyebath will be lower at the end of the dyeing by one half to whole unit,
indicating that some alkali has been used up during dyeing. The cellulosic fibre is responsible
for some of this reduction, while a smaller part is used by the dyestuff as it hydrolysis. The
effect of pH, account must be taken of the internal pH of the fibre as well as the external pH
of the solution. The internal pH is always lower than external pH of the solution. Since the
decomposition reaction is entirely in the external solution, the higher external pH favors
decomposition of the dye rather than reaction with the fiber. pH influences primarily the
concentration of the cellusate site on the fibre. It also influences the hydroxyl ion
concentration in the bath and in the fibre. Raising the pH value by 1 unit corresponds to a
temperature rise of 20oc; the dyeing rate is best improved by raising the dyeing temperature
9
once a pH of 11-12 is reached. Further increased in pH will reduce the reaction rate as well as
the efficiency of fixation. Different types of alkalis, such as caustic soda, soda ash, sodium
silicate or a combination of these alkalis, are used in order to attain the required dyeing pH.
The choice of alkali usually depends on the nature of dye.
The colour of many dyes varies quite drastically with pH, and in most instances this
behaviour is predictable from chemical structure. To provide reliable coloristics data for
products that vary with pH, it is necessary to adjust the pH prior to measurement. Adjustment
is made either by titration or by using a solvent buffered to a specific pH. For case of
operation the buffered solvent is preferred, provided its buffering capacity is capable of
suppressing pH variation from one sample to another.
Electrolyte effect:
The addition of electrolyte results in an increase in the rate and extent of exhaustion, increase
in dye aggregation and a decrease in diffusion. The electrolyte efficiency increases in the
order: KCl
- Xem thêm -