UNIVERSITY OF ECONOMICS
HO CHI MINH CITY
VIETNAM
INSTITUTE OF SOCIAL STUDIES
THE HAGUE
THE NETHERLANDS
VIETNAM – THE NETHERLANDS PROGRAMME FOR M.A IN
DEVELOPMENT ECONOMICS
RECREATIONAL VALUES OF CORAL REEFS AT
CU LAO CHAM ISLANDS, VIETNAM
MASTER OF ARTS IN DEVELOPMENT ECONOMICS
By
NGUYEN HUU DANG TRINH
Academic Supervisor
PHAM KHANH NAM
HCM city, January 2014
CERTIFICATION
―I certify that the substance of this thesis has not already been submitted for any
degree and has not been currently submitted for any other degree.
I certify that to the best of my knowledge and help received in preparing this thesis
and all used sources have acknowledged in this dissertation‖.
NGUYEN HUU DANG TRINH
Date: 5th January, 2015
i
ACKNOWLEDGE
Upon completing this thesis, I have received a great deal of encouragement and
support from many people.
To complete this study, I am really happy to get a big encouragement and support
from many people.
First of all, I am very grateful to Dr. Pham Khanh Nam, my academic supervisor for
his useful help, support and professional advice.
My gratefulness is also extended to all of my lecturers and staff of the VietnamNetherlands Program, particularly, Assoc. Prof. Nguyen Trong Hoai and Dr. Pham
Khanh Nam for their assistance during the first days when I started this program.
During the period of my study, family is a great encouragement that I would like to
express my deep thank to them.
The last person who I also want to give a big thank is my close friend, Ms Huynh Thi Na.
She is a good companion giving me the ideas for my tendency.
Finally, I would like to thank all my friends and other people who have had any help
and support for my study but are not above-mentioned.
ii
ABSTRACT
This thesis used the travel cost approach to estimate the recreational values of coral
reefs at Cham islands, Vietnam. Since the on-site data has addressed some problems
such as non-negative integers, zero-truncated, endogenously stratified and overdispersion, two count models: the Poisson model and negative binomial model have
been used in the study. From the econometric results, we can clearly see that the
negative binomial models produced better results than the corresponding Poisson
models. It is also indicated that the gross Consumer surplus of total visitors to Cham
islands in 2013 is about VND 292.75 billion and the gross WTP of total visitors is
about VND 7.12 billion.
Key words: coral reefs, recreational value, total economic value, travel cost method,
count model
.
iii
CONTENTS
CHAPTER 1: INTRODUCTION ..............................................................................1
1.1. Problem statements ........................................................................................... 1
1.2. Research objectives ........................................................................................... 2
1.3. Research questions ............................................................................................ 2
1.4. Scope of the study ............................................................................................. 3
1.5. Structure of the study ........................................................................................ 3
CHAPTER 2: LITERATURE REVIEWS ................................................................4
2.1. Total economic value of the environmental resources ..................................... 4
2.2. Environmental valuation methods .................................................................... 6
2.3. The Travel cost method .................................................................................... 8
2.3.1.
The concept of Consumer surplus .............................................................. 8
2.3.2.
The Travel cost method .............................................................................. 9
2.3.3.
Theoretical framework ............................................................................. 10
2.3.4.
Problems with the Travel cost method ..................................................... 12
2.4. Empirical literature review ............................................................................. 12
2.5. Conceptual framework .................................................................................... 15
CHAPTER 3: DATA AND RESEARCH METHODOLOGY..............................16
3.1. Overview of Hoi An........................................................................................ 16
3.1.1.
Brief of forming history of Hoi An ........................................................... 16
3.1.2.
Evaluation of Tourism resources of Hoi An: ........................................... 18
3.2. Overview of Cham islands .............................................................................. 19
3.2.1.
Biodiversity in Cham islands ................................................................... 20
3.2.2.
Cu Lao Cham marine protected area ...................................................... 22
3.3. Data collection ................................................................................................ 25
3.3.1.
Survey design ........................................................................................... 25
3.3.2.
Sample design........................................................................................... 26
iv
3.3.3.
Variables and expected signs ................................................................... 27
3.4. Methodology ................................................................................................... 29
3.4.1.
Computing total travel cost ...................................................................... 29
3.4.2.
Econometric models ................................................................................. 32
CHAPTER 4: RESEARCH RESULTS AND DISCUSSION ...............................37
4.1. Descriptive Statistics ....................................................................................... 37
4.2. Econometric results ......................................................................................... 41
4.3. Computation of consumer surplus (CS) estimates .......................................... 44
4.4. Estimation and suggestion of an entrance fee ................................................. 45
CHAPTER 5: CONCLUSION AND RECOMMENDATION .............................48
5.1. Main findings .................................................................................................. 48
5.2. Policy implications.......................................................................................... 49
5.3. Research limitations ........................................................................................ 49
5.4. Suggestions for future researches ................................................................... 50
REFERENCES ............................................................................................................51
APPENDIXES ............................................................................................................56
Appendix A: Literature reviews worksheet.............................................................. 56
Appendix B: Descriptive statistic ............................................................................. 60
Appendix C: Econometric results ............................................................................. 61
Appendix D: Multicollinearity test ........................................................................... 63
Appendix E: Sample profile ..................................................................................... 63
Appendix F: Questionnaire....................................................................................... 75
v
LIST OF TABLES
Table 1: Number of environmental valuation methods .............................................. 7
Table 2: Definition of variables in the data set ........................................................ 27
Table 3: Expected sign of the coefficients in the model .......................................... 29
Table 4: Means of transportation to Cham islands ................................................... 30
Table 5: Distribution of gender and marital status of respondents .......................... 37
Table 6: Distribution of age of respondents ............................................................. 38
Table 7: Education level of respondents .................................................................. 38
Table 8: Monthly income of respondents in million VND ...................................... 39
Table 9: Number of visitors in a group .................................................................... 39
Table 10: Number of trips in 5 years ........................................................................ 40
Table 11: Visitor‘s total travel cost (million VND) ................................................. 40
Table 12: Number of nights travel at Cham islands ................................................. 41
Table 13: Empirical results of count models ............................................................ 42
Table 14: Estimated Consumer surplus .................................................................... 44
Table 15: WTP the fees to visit Cham islands ......................................................... 45
Table 16: WTP the fees to visit Cham islands ......................................................... 46
vi
LIST OF FIGURES
Figure 1: Total economic value of environmental assets ........................................... 4
Figure 2: Travel cost demand function and Consumer Surplus ................................. 8
Figure 3: Conceptual framework .............................................................................. 15
Figure 4: Cu Lao Cham MPA zoning plan map ....................................................... 25
Figure 5: Histogram of the number of trips in 5 years to Cham islands .................. 33
vii
CHAPTER 1: INTRODUCTION
1.1. Problem statements
According to Ceasar ed al (2000), coral reefs is one of the most productive, diverse,
and attractive ecosystems. Not only plays an important role for marine life, coral reefs
also provides a valuable range of benefits for mankind such as: Physical structure
services: by reducing the speed and strengthen of the currents and waves, coral reefs
protect our coasts; biotic and economic services: many species of fish use coral reefs
as their shelter and the places to have babies; biogeochemical services: the existence
of coral control the amount of carbon dioxide in the ocean environment…
Cu Lao Cham, is a small group of eight islands located, which is 19km offshore from
Hoi An city, in the eastern part of Quang Nam Province, central Vietnam. Cu Lao
Cham Marine Protected Area was established in December 2005 with the support
from the Danish Government and recognized as World Biosphere Reserve by
UNESCO in 2009. Cu Lao Cham is famous by wonderful coral reefs that bring many
benefits such as fish habitat, beach protection, fishery and recreation. In recent years,
the local economy that is supported by tourism to coral reefs has been greatly
improved. However, the threat to coral reefs is also accompanied by tourism growth.
According to Department of Commerce and Tourism of Hoi An, the number of
tourists visiting Cu Lao Cham surpassed 190,000 in 2013, and to transport those
visitors required about 13,000 turns of high-speed canoe, equivalent to 480.000 liters
of gasoline consumed and exhausted directly into the sea. In addition, the coral reefs
are also destroyed by tourism activities such as swimming, diving, scuba and garbage
of visitors as well as residents. Therefore, the local government needs to keep the
balance between tourism development and coral reefs conservation.
There were some researches showing relation between tourism development and coral
reefs conservation at Bolinao Philippine (Ahmed et al, 2007), Great Barrier Reef1
Australia (Carr and Mendelsohn, 2003), or Hon Mun MPA – Vietnam (Nam et al,
2005)… Ahmed et al. (2007) showed that making sure healthy coral reefs can create
potential revenues for a sustained period of time. Carr and Mendelsohn (2003)
emphasized the importance of conservation policies to protect coral reef systems when
these resources were worth from USD 18 to 40 billion for Australia. In Vietnam, the
study of Nam et al. (2005) concluded that a management of coral reefs could provide
higher benefits than a ―no management‖ scenario. Among the benefits to local
economy as well as threats to coral reefs from tourism, there is a need for research on
estimating the recreational value of coral reefs at Cu Lao Cham islands so that policymakers could figure out the damage if the coral reefs disappear. And in order to avoid
that worst case happen, the conservation policies to protect coral reefs at Cu Lao
Cham islands need to be warranted and should be supported.
Valuation all economic benefits provided by the coral reefs is very difficult because
they have a wide range of value uses and most economic values associated with the
coral reefs must be estimated using non-market methods. Therefore, this study just
focuses on measuring the recreational value of coral reefs at Cu Lao Cham islands by
using travel cost approach.
1.2. Research objectives
The goals of this study are to measure the annual recreational value of the coral reefs
at Cu Lao Cham islands for the purpose of improving the awareness of local
communities and governments in exploitation and protection of coral reefs ecosystem.
1.3. Research questions
The study tries to address the following questions:
-
What are the key determinants of recreational demand for the coral reefs at
Cham islands?
2
-
How much is the annual recreational value of the coral reefs at Cham islands?
1.4. Scope of the study
This study limits itself to the estimation of the recreational value of the Cham islands.
Other values such as the value of commercial fishing or the value of seaport are not
taken into consideration. Granted that the value of the Cham islands lies beyond
recreation, it demands much more time and financial resources to carry out a study
which will capture the other benefits of the islands. These time and material resources
could not have been incorporated into the framework of this study. Therefore, a
broader study will be well suited to capture all these values.
It is also worth noting that the study is anchored on information obtained from onsite
visitors from April to August 2013. This therefore means that results might be
different if information is obtained in different time periods such as December or
winter periods which are off-periods for visitors.
1.5. Structure of the study
The following section of this thesis is organized as follows. Chapter 2 discusses the
literature review of the total economic value and the travel cost model. Chapter 3
presents the data and methodology research. Chapter 4 describes the results obtained
from count data models and discussion and Chapter 5 is conclusion.
3
CHAPTER 2: LITERATURE REVIEWS
This chapter presents four main parts. First of all, it introduces the definition of total
economic value of the environmental resources. Secondly, it presents the theoretical
generations of environmental valuation methods. Thirdly, it focuses on the travel cost
method. Finally, it summarizes existing empirical researches.
2.1. Total economic value of the environmental resources
The total economic value of an ecosystem is given by the sum of all the goods and
services it provides (Ceasar, 2000). An overview, the economists distinguish between
two categories of economic value related to an environmental resource: use values and
non-use values (Ceasar, 2000; Munasinghe, 1992; Spurgeon, 1992; Philcox, 2007).
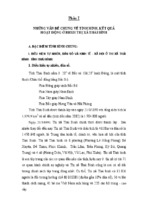
Total economic value = Use values + Non-use values
Figure 1: Total economic value of environmental assets
Total economic value
Use value
Direct use
value
Output that can
be consumed
directly
Food
Biomass
Recreation
Health
Indirect
use value
Non-Use value
Option
value
Functional
benefits
Future direct an
indirect use
values
Ecological
functions
Storm protection
Biodiversity
Conserved
habitats
Bequest
value
Value of leaving
use and non-use
values for offspring
Habitats
Irreversible
changes
4
Decreasing ―tangibility‖ of value to individuals
Source: Munasinghe (1992)
Existence
value
Value from
knowledge of
continued existence
Habitats
Endangered
species
Use values are separated into direct use values, indirect use values, and option values.
Non-use values come from both bequest values and from existence use values. Figure
1 presents the subdivision of the total economic value.
Use value is the benefits derived from the use of resources in practice. Sometimes, it
can also be understood as personal values associated with consuming directly or
indirectly services provided by natural resources. Use value is formed from actual use
of environmental assets. In fact it includes:
Direct use value of environmental resources is the benefit that people derive
from their actual use of environmental resources and can be divided into two
types are consumptive use and non-consumptive use. For example, the direct
use values of coral reefs include consumptive use as fishery and coral mining,
and non-consumptive use as scuba diving and recreation.
Indirect use value of environmental resources is indirect benefits obtained from
ecosystems. The indirect use values of coral reefs could be the basic function of
the environment that supports indirectly for economic activities of human such
as storm protection, carbon absorption, or food chain, etc.
Option value of environmental resources is the values that people obtain from
environmental goods and services in the future use although they do not use
them currently. In case of are creation area, people would be willing to make a
payment to preserve the area in order to maintain the option to visit it in the
future. However, in some cases, the boundary between the option value and
non-use value is not clear.
Non-use value (also called passive use value or intrinsic value) represents the value
that society assigns to an environmental resource even though they never intended to
5
use it directly. Non-use value consists of bequest value, which refers to the benefits
arising from the desire to preserve and bequeath to future generations; and existence
value, which refer to the value arising from knowing that environmental assets exists.
Existence value can be defined as the benefit people derive from knowing that
a resource exists, despite the fact that they have never used the resource in the
future. For example, in order to protect the endangered species, people are
willing to make a payment for protection regardless of the fact they cannot see
these species in practice.
Bequest value is derived from the benefits that people obtain from knowing that
a resource will be available for future generations. For example, people are
concerned about the global warming issue and would be willing to pay to
diminish the impact of it, despite the fact that the damages are expected to take
place in the distant future.
2.2. Environmental valuation methods
In the environmental economics literature, there are several different valuation
methods of estimating the economic values of an environmental resource. These
valuation methods are generally categorized into stated preference approaches
(Ahmed et al, 2007; Seenprachawong, 2003; Nam and Son, 2001) and revealed
preference approaches (Ahmed et al, 2007; Ceasar and Beukering, 2004; Chea et al.,
2012; Seenprachawong, 2003; Wang et al., 2004; Nam and Son, 2001). The stated
preference methods are direct methods which use surveys to elicit information from
individuals about costs and benefits of an environmental resource. On the other hand,
the revealed preference method is a market based indirect method as it values nonmarket goods and services indirectly by observing individual‘s behavior in actual or
simulated markets.
6
The most popular method of the stated preference approaches is the Continent
Valuation Method (CVM). It has been used more than the other one – Choice
Experiment Method. The main purpose which CVM wants to obtain is to form a
hypothetical market situation for non-maket resources. However, this situation is
realistic also because it makes us feel easy to communicate to people about the
contingent market to get their reaction to this hypothetical market. We could evaluate
economics benefits related to the provision of these resources thank to this
information. For valuing bequest, existence and option values of environmental
resources, CVM is the only available method.
Travel Cost Method (TCM) and Hedonic Pricing Method (HPM) are two well-known
methods of indirect valuation. Using travel costs as a representative for the price of
visiting outdoor recreational sites is a part of TCM (Ceasar, 2000; Spurgeon, 1992;
Philcox, 2007). It indicates weak complementarities between the environmental asset
and consumption expenditure. It is noticed that TCM cannot estimate non-use values.
Otherwise, through multiple regressions, the HPM help us analyze the total value of a
good into the value of its several attributes. And we could understand that Hedonic
price is an latent price and the method which the value of the attribute is capitalized
into the total value of the good.
Table 1: Number of environmental valuation methods
Travel Cost Method
Hedonic Pricing Method
Producer/Consumer Surplus
Revealed Preference
Factor of Production
Defensive Expenditure
Choice Experiment
Stated Preference
Contingent Valuation
7
2.3. The Travel cost method
According to the previous part, revealed preference and stated preference methods are
two categories of non-market valuation technique. Nevertheless, the revealed
preference technique is more interested in since it is the major purpose of this work.
Therefore, the concepts and theories related to the revealed preference technique will
be necessary reviews.
2.3.1. The concept of Consumer surplus
One of the key concepts of the travel cost method which we should study carefully is
consumer surplus (CS). It demonstrates how much a visitor values a trip to a
recreational site. Sohngen et al. (1999) state that the consumer surplus is the value
added above travel cost that visitors get by taking a trip to recreation site each season.
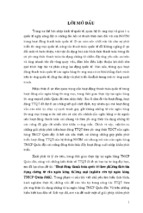
To illustrate the concept of the CS, consider Figure 2
Figure 2: Travel cost demand function and Consumer Surplus
From the Figure 2, At0t1 represents the area named – consumer surplus. The CS can be
calculated by integrated the travel cost demand function between the actual travel cost
8
and the choke price travel cost. So we have a travel cost demand function of the
functional form:
Tij = f(Pi, Yi, Zj)
(1)
Ti is the number of trips undertaken by visitor i to the recreation site in a year, Pi is the
total travel cost for visitor i, Yi the income level of visitor i and Zj is the quality of the
site j.
From equation (1), CS can be derived by taking the integral value of the demand
function i.e.
(2)
CS =
The CS formula presented above will only be admitted when the data is in a case that
OLS regression or any other appropriate estimation procedures can be used precisely
to get the travel cost demand function. Nonetheless, in some cases (effects of other
elements), the CS is also computed as follows
CS = -1/β
(3)
where β is the coefficient of the total travel cost (TTC) variable obtained when the
maximum likelihood estimation is used to the final TCM models and the sign of β
should be negative. Because of that the CS per trip estimate should always be positive.
2.3.2. The Travel cost method
In a letter to the U.S Department of the Interior‗s National Park Service, the first time
that Hoteling (1947) proposed the travel cost approach. Although this approach has
been used for outdoor recreation in the United State and Canada, it is the most wellknown and valuable method of evaluating outdoor recreation benefits of natural
resources such as water and forests.
9
The travel cost method is a non-market valuation that is used for measuring visitor
benefits from travel to a recreation site. The travel expenditure including travel costs,
entry fees, onsite expenditures are used as a proxy for price. When this price is high,
the number of trips taken by individuals will be low. By measuring how the price
impacts on visitation, a demand function for a site can be estimated. And this demand
function is used to get consumer surplus result or recreational benefits attached with
the site. The method has become widely used to valuating recreation benefit of
environmental resources.
There are two types of travel cost method, individual travel cost method (ITCM) and
zonal travel cost method (ZTCM). The ITCM uses the number of trips per year of a
visitor as dependent variable. This approach creates a problem when the visitors
cannot make more than one trip to the zone per year. The solution is using the
dependent variable in the number of individual trips in certain period of time instead
of a year. Whereas, ZTCM can solve this problem by using the visitation rate of a
zone as dependent variable.
2.3.3. Theoretical framework
The underlying theory of TCM is associated with the demand function of the
household production model. Households maximize utility subject to two constraints,
household income and time available. With the public goods and services, the visitor
to a recreational site is a consumer of two goods or services (i.e. recreational goods
and services (denoted as ri) and all other private or marketed goods and services
(denoted as xi), who is affected by budgetary and time constraints (see Sarker and
Surry, 1998).
Let‘s assume xi and ri to represent a vector of private goods and a vector of
recreational goods or services, respectively. Let again the prices of these two set of
goods be px and pr, respectively. The representative consumer can therefore spend
10
visitor‘s income (denoted as Yi) on the purchase of these two set of goods. Hence, the
budget constraint of the visitor is given as
Yi = wTw = px xi + pr ri
(4)
Yi is the income level of the individual consumer i, w is the hourly wage rate and Tw
is the total number of hours worked. The visitor faces a time constraint as he must
decide on how much time to spend on work and leisure (recreation). The time
constraint can be stated as
T = Tw + Tl
(5)
T is the total time of the consumer and Tl is time devoted to leisure (recreation). Note
that the quality of recreational sites is a key determinant of the visitor‘s choice of the
site to visit. If we denote the quality yardsticks of a recreational site as qj, then the
utility function of the representative recreation consumer can be written as
Uij = U(xi ri qj)
(6)
By maximizing equation (6) subject to equations (4) and (5), ordinary or Marshallian
demand functions for private goods and recreational goods are obtainable:
xi = g(px, pr, Yi, qj)
(7)
rij = f(px, pr, Yi, qj)
(8)
Equations (7) and (8) represent the ordinary demand functions of private goods and
recreational goods, respectively. However, the focus of this work is on the latter
equation (8). Note that it is difficult to measure the flow of the recreational services
(Sarker and Surry, 1998) so as a consequence, the number of trips to the recreational
site is used as surrogates. As already discussed in the previous section, equation (8) is
11
crucial in computing the CS per trip since it coefficients can be obtained
econometrically.
2.3.4. Problems with the Travel cost method
The method is based on real data which can be considered the strength of the
approach. However, the assumption that the recreational value of a site depending on
travel costs could be an oversimplification of reality. Some of the main limitations of
the TCM are discussed below.
First is the treatment of multiple site visitors. One of the major assumptions of the
travel cost methodology is that only one site is visited per trip (Haspel and Johnson,
1982). However, most of visitors tend to travel multiple destinations in one journey.
That implies the full cost of the trip is not an implicit price for the specific recreation
site.
Second is the treatment of time. The TCM only use the total amount of money spent
to visit a site to estimate an individual‗s willingness to pay while a time cost
representing the opportunity cost of working should be included to get a good
measuring. However, there is no clear solution for the time-cost problem. Nowadays,
several authors use a certain percentage of wage rates to provide an estimate of the
opportunity cost of time.
2.4. Empirical literature review
The travel cost method (TCM) is used in the thesis to estimate the value of recreation
of coral reefs at Cham islands. TCM is proposed the first time in 1949 when Harold
Hotelling replied to US National Park Service on approach of estimating the economic
values of National Parks. His idea was that tourists must spend the travel expenses if
they visit a National park. Because visitors come from various locations, their travel
12
- Xem thêm -