Management Accounting Research 18 (2007) 399–424
A survey of factors influencing the choice of product
costing systems in UK organizations
Mohammed Al-Omiri a , Colin Drury b,∗
a
b
Umm Al-Qura University, Saudi Arabia
Department of Accountancy, University of Huddersfield, UK
Abstract
This paper reports on the findings of a postal questionnaire that examines the extent to which potential contextual
factors influence the characteristics of product costing systems. Prior research has mostly used the adoption or
non-adoption of ABC systems to capture the characteristics of product costing systems. This research has generally
been inconclusive and has been unable to establish strong links between ABC adoption and those contextual factors
that have been identified in the literature that are conducive to the adoption of ABC systems. Instead of using only
the adoption or non-adoption of ABC systems as a measure of product cost system design this research uses four
different proxy measures of cost system sophistication to capture the characteristics of the product costing systems.
This allows for a more robust test of the relations among the predictor variables and cost system sophistication.
Results indicate that higher levels of cost system sophistication are positively associated with the importance of
cost information, extent of use of other innovative management accounting techniques, intensity of the competitive
environment, size, extent of the use of JIT/lean production techniques and the type of business sector. No association
was found between the level of cost system sophistication and cost structure, product diversity and quality of
information technology.
© 2007 Elsevier Ltd. All rights reserved.
Keywords: Product costing; Activity-based costing; Direct costing; Absorption costing; Cost system sophistication; Contingent
factors; Cost pools; Cost drivers
∗
Corresponding author at: Department of Accountancy, University of Huddersfield, Queensgate, Huddersfield. HD1 3DH,
UK. Tel.: +44 1484 472840; fax: +44 1484 473062.
E-mail address:
[email protected] (C. Drury).
1044-5005/$ – see front matter © 2007 Elsevier Ltd. All rights reserved.
doi:10.1016/j.mar.2007.02.002
400
M. Al-Omiri, C. Drury / Management Accounting Research 18 (2007) 399–424
1. Introduction
To explain the diversity of management accounting practices researchers have adopted contingency
theory to demonstrate how specific aspects of an accounting system are associated with various contextual variables. A considerable amount of contingency-based research has been undertaken relating
to management accounting control systems (Chenhall, 2003). Little attention, however, has been given
to identifying the factors that explain the content of product costing systems. This is surprising considering the vast amount of publicity given to developing more sophisticated product costing systems
(Cooper, 1988a; Cooper, 1988b; Cooper and Kaplan, 1992; Kaplan and Cooper, 1998). The need to
improve the sophistication of product costing systems has been driven by changes in manufacturing
technology, global competition, information costs and customers’ demands for greater product diversity. These changes prompted criticisms of the ability of traditional management accounting systems
to report sufficiently accurate product costs and ABC systems were promoted as the solution to overcome the distortions in the product costs reported by traditional costing systems (Cooper, 1988b; Kaplan,
1994).
The survey evidence suggests that the ABC adoption rate has been fairly low, being approximately
15% of the companies surveyed by UK studies (Innes et al., 2000; Drury and Tayles, 2000). This low
rate of adoption has prompted several writers to question the usefulness of ABC in generating more
accurate product costs (Noreen, 1991; Datar and Gupta, 1994; Yahya-Zadeh, 1997; Maher and Marais,
1998) and the costly design, implementation and operation of such systems (Cobb et al., 1992). Research
has only been recently undertaken into examining the contingencies influencing the nature of product
costing systems. Virtually all of this research has concentrated on the factors influencing the adoption
or non-adoption of ABC systems. This research has generally been inconclusive and has been unable to
establish strong links between the adoption of ABC and those contextual factors that have been identified
in the literature that are conducive to the adoption of ABC systems. Two possible reasons may account for
this situation. First, there may be no relations between the constructs of interest and thus any significant
findings may have been spurious and not reproducible. Second, the methods adopted by previous research
may have fatal flaws relating to poor measures, measurement error, bias etc. The lack of consistent
findings from previous research suggests that there is a need for continuing empirical research on this
topic.
Besides using the measure adopted by previous research (i.e. the adoption or non-adoption of ABC
systems) this study also uses alternative proxy measures for identifying the characteristics of product costing systems. The paper examines the extent to which different contextual factors influence
the choice of product costing systems using these alternative proxy measures. Thus, the distinguishing feature of the research is that provides the potential for testing the robustness of the contextual
factors based on using different proxy measures to identify the characteristics of product costing
systems.
The paper consists of nine sections. The next section considers how the characteristics of product
costing systems can be classified in terms of their level of sophistication. Section 3 summarizes the
previous studies relating to this research and the following section provides a justification for the further
research. The research hypotheses are presented in Section 5 and the research design and methods used
to measure the variables tested in the research are presented in Sections 6 and 7. Section 8 presents the
research findings and the final section contains a discussion of the limitations of the research and the
potential for future areas of research.
M. Al-Omiri, C. Drury / Management Accounting Research 18 (2007) 399–424
401
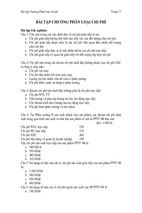
Fig. 1. Dimensions determining the varying levels of cost system sophistication.
2. Classifying product costing systems by their level of sophistication
Product costing system design choices can be viewed as varying along four dimensions: the number of
cost pools, the number of different types of cost drivers used in the second stage of the two-stage overhead
assignment process, the types of second stage drivers used and the extent to which direct assignments
or resource drivers are used in the first stage of the allocation process. Costing systems are classified
according to their level of sophistication based on where they fit on a continuum representing the four
dimensions for assigning indirect costs.1 Fig. 1 presents the model we use to classify product costing
systems by their level of sophistication.2
The most simplistic system is a direct costing system and this is located on the extreme left of the
continuum shown in Fig. 1. Moving along the continuum represents different sophistication levels in
terms of assigning indirect costs to cost objects. Towards the extreme left are the simplistic systems (e.g.
single plant-wide cost pools). Higher levels of sophistication are assumed to be associated with increasing
the number of cost pools based on the premise that creating a greater number of cost pools enables the
costing system to better capture the variability in cost pool resource consumption by products/services.
The second dimension influencing the level of sophistication relates to the number of different types of
1
Both simplistic and sophisticated costing systems can accurately assign direct costs to cost objects. Cost assignment merely
involves the implementation of data processing systems to identify and record the resources consumed by products. The choice
of costing system design choices therefore generally applies to the assignment of indirect costs.
2
The model represents an extension of the method adopted by Abernethy et al. (2001) to evaluate the level of cost system
sophistication.
402
M. Al-Omiri, C. Drury / Management Accounting Research 18 (2007) 399–424
second stage cost drivers that are used. Using a greater variety of cost drivers that are the significant
determinants of costs enables cause-and-effect drivers to be established for each cost pool that more
accurately measure the resources consumed by cost objects.
The level of cost system sophistication in respect of the third dimension relates to the extent to which
transaction or duration drivers are used in the second stage of the allocation process (Kaplan and Cooper,
1998). Transaction drivers are less sophisticated since they assume that the same quantity of resources is
required each time an activity is performed. In contrast, duration drivers are more sophisticated since they
represent measures based on the amount of time required to perform an activity. Finally, higher levels of
sophistication are also achieved by relying more extensively in the first stage of the allocation process
on directly assigning costs to each cost pool or using cause-and-effect first stage drivers (i.e. resource
drivers).
Costing systems with many cost pools and different types of cost drivers that rely extensively on using
direct first stage assignments or resource drivers and second stage duration drivers (e.g. sophisticated ABC
systems) would be located at the extreme right of the continuum. Locating costing systems at intermediate
and other points along the continuum is more problematic. Generally costing systems that have both a
greater number of cost pools and different types of cost drivers can be classified as more sophisticated
than those with both fewer pools and types of drivers.3 Problems arise, however, in determining the order
of the location of costing systems along the continuum when comparing systems that have a greater
number of cost pools with those that have fewer cost pools but a greater number and variety of second
stage drivers.
In summary, the above discussion has identified four dimensions that can be used as a guide for
determining the sophistication of product costing systems. Unfortunately, they are not homogenous and
cannot be combined. It is thus only possible to rank costing systems as being more sophisticated than
others only when the former exceeds the latter in terms all of the four above determinants of sophistication.
Alternatively, the sophistication of costing systems can be classified by broad categories such as direct
and absorption costing systems or ABC and non-ABC systems. The disadvantage of such categorizations
is that they entail only two very broad categories.4
Information relating to the above four dimensions is unlikely to be reliably obtainable from postal
questionnaire surveys. Only information relating to the number of first stage cost pools and the number of
different types of second stage drivers is likely to be reliably obtainable. However, these two determinants
do represent the dominant factors in determining the classification of product costing systems (Kaplan
and Cooper, 1998). Therefore, to measure the level of cost system sophistication large scale surveys must
rely on using either single proxy measures (e.g. the number of cost pools and/or different types of second
stage drivers) or broad dichotomous categories, such as ABC adopters or non-adopters, to identify where
costing systems are located on the cost system continuum.
The optimal cost system is different for different organizations and is dependent on various contextual
factors (Cooper, 1988a). Thus, this research seeks to empirically identify where cost systems are broadly
3
This is based on the assumption that use of first stage cost drivers and duration/transaction drivers are held constant or have
little impact.
4
For example, the direct costing category incorporates very simplistic systems at the extreme left of the continuum whereas the
absorption costing category incorporates a broad range of costing systems varying from simplistic to highly sophisticated. Similarly, if the ABC adoption and non-adoption categories are used the latter category includes levels of cost system sophistication
ranging from very simplistic to moderate levels of sophistication.
M. Al-Omiri, C. Drury / Management Accounting Research 18 (2007) 399–424
403
located along the sophistication continuum shown in Fig. 1 and identify the contextual factors that
influence their location along this continuum based on the following proxy measures:
•
•
•
•
Number of first stage drivers.
Number of different types of second stage cost drivers.
ABC or traditional costing systems.
Direct or absorption costing systems.
3. Previous studies
The key concept in contingency based research has been the concept of fit whereby contextual factors
and aspects of an accounting system must somehow fit together for an organization to be effective. Drazin
and Van de Ven (1985) identify two forms of fit relating to structural contingency theory—the selection and
interaction approaches. The former examines the relationship between contextual factors and organization
structure without examining whether this context-structure relationship affects performance. In contrast,
the interaction approach seeks to explain variations in organizational performance from the interaction
of organizational structure and context. Thus, only certain designs are expected to give high performance
in a given context, and departures from such designs are expected to give lower performance. Given that
organizations are assumed to have varying degrees of fit the task of the researcher is to show that a higher
degree of fit between context and structure is associated with higher performance.
In terms of management accounting control systems research the vast majority of studies have adopted
the selection approach to fit (Chenhall, 2003; Luft and Shields, 2003) whereby characteristics of the
accounting system represent the dependent variable. Accounting researchers have justified the selection
approach based on the assumption that rational managers are unlikely to use accounting systems that do
not assist in enhancing performance (Chenhall, 2003).5 Where the interaction approach to fit has been
adopted, with a measure of organizational performance as the dependent variable, outcome measures
such as satisfaction or usefulness of the management control system have been widely used as proxy
measures of desired organizational performance.
The literature review relating to product costing contingency research indicated that virtually all of the
research has concentrated on contextual factors influencing the adoption or non-adoption of ABC systems.
Seven survey-based studies published in the major journals were identified (Bjornenak, 1997; Gosselin,
1997; Krumwiede, 1998; Malmi, 1999; Clarke et al., 1999; Hoque, 2000 and Cagwin and Bouwman,
2002). The first six studies adopted the selection approach to fit and the latter adopted the interaction
approach. The most widely used contextual variable has been product diversity, being included in four of
the six studies that have adopted the selection approach. The impact of cost structure and size has been
examined in three of the six studies. Other variables that have been examined by only one or two of the
above studies include the level of competition, quality of information technology, the extent of advanced
technologies/practices and competitive strategy. Only one variable (size) has consistently been identified
as a significant variable. Product diversity was identified as a significant variable in two of the four studies
and cost structure was not a significant variable at the 5% level in the three studies that examined this
5
Chenhall (2003) also indicates that an alternative view is that managers adopt accounting systems for institutional and political
reasons that may be inconsistent with economic reasons.
404
M. Al-Omiri, C. Drury / Management Accounting Research 18 (2007) 399–424
variable. The interaction study by Cagwin and Bouwman (2002) reported a positive association between
the interactions of ABC with business complexity and the use of other initiatives employed concurrently
with ABC (e.g. JIT, TQM, BPR etc.) and improvements in return on investment.
The literature review identified only two studies that sought to classify product cost systems by characteristics other than by the discrete alternatives of traditional and ABC systems. The first by Abernethy
et al. (2001) adopted an interactive approach to fit. Based on case study research they classified product
costing systems by their level of sophistication using data collected from five divisions within two firms in
Australia. Four divisions had a low level of sophistication but there was a reasonable level of satisfaction
with the information provided by the costing systems at three of the four divisions. The authors attributed
this to the ‘fit’ between the levels of sophistication of the costing system and the contextual factors of
cost structure and product diversity. All three divisions had low product diversity and low overhead costs.
In the fourth division overhead costs and product diversity were high. Management was dissatisfied with
the costing system and the authors attributed this to the lack of ‘fit’ between the contextual factors and
the existing costing system.
The fifth division operated a sophisticated traditional costing system. The users were very satisfied
with the costing system. Product diversity was high but this was facilitated by investment in advanced
manufacturing technology (AMT) resulting in overhead costs being mainly associated with investment
in AMT, which represented facility-sustaining costs. In these circumstances the authors argued that there
was little justification for sophisticated ABC systems because the batch-related and product sustaining
costs associated with product diversity were low thus reducing the need for incorporating a variety of
non-volume-based drivers.
The second study that adopted a broader perspective to classify costing systems was a survey undertaken
by Drury and Tayles (2005). A measure of cost system complexity represented the dependent variable.
An 8-point scale was used to obtain information relating to the number of cost pools and different types
of cost drivers. The two scales were aggregated to subjectively determine a measure of cost system
complexity.6 The contextual variables, derived mostly from single questions, were incorporated into a
multiple regression model with the dependent variable being the measure of cost system complexity. Four
variables were statistically significant – product diversity, degree of customization, size and corporate
sector (the financial and service sectors had significantly higher levels of cost system complexity compared
with companies operating in the manufacturing sector).
4. The need for further studies
Previous studies have used different measures for both the dependent and independent variables. Where
the adoption or non-adoption of ABC systems has been used as the dependent variable the terms ‘adoption’
and ‘non-adoption’ have been subject to different interpretations with some studies defining adoption as
actual ABC implementation and others defining it as actual implementation or a desire to implement it.
The studies have also generally allowed the respondents to self-specify whether their organization operate
an ABC system despite the fact that there is also some disagreement as to whether systems described
by survey respondents as ABC are really ABC systems (Dugdale and Jones, 1997; Innes and Mitchell,
6
Each point on the 8-point scale represented class intervals specifying a range relating to the number of cost pools and different
types of cost drivers for the product costing system.
M. Al-Omiri, C. Drury / Management Accounting Research 18 (2007) 399–424
405
1997). Inconsistent measures have also been used for measuring the independent variables. Most of the
studies have used measures derived from a single question for obtaining non-factual data rather than using
composite scores derived from multiple questions (Foster and Swenson, 1997).
Apart from the studies by Gosselin and Krumwiede, the ABC studies based on a selection approach
to fit have used bivariate statistics to examine whether the difference between adopters and non-adopters
were statistically significant. Where the contextual variables are related to each other there is a danger that
spurious relationships may be reported. There is a need for tests to be undertaken using higher powered
multiple and logistic regression statistical tests that express the unique contribution of each variable by
systematically controlling for the impact of other variables in the model.
This research therefore seeks to remedy the above deficiencies. In particular, prior research has adopted
a much too simplistic approach to product cost system design. Instead of using only the adoption or nonadoption of ABC systems as a measure of product cost system design this research uses four different
measures of cost system sophistication to capture the attributes of the product costing systems. This allows
for a more robust test of the relations among the predictor variables and cost system sophistication.
5. Research hypotheses
A literature review was undertaken to identify the potential contextual factors that may influence the
level of sophistication of product costing systems. The following contextual factors are examined:
1.
2.
3.
4.
5.
6.
7.
8.
9.
Importance of cost information
Product diversity
Cost structure
Intensity of the competitive environment
Size of the organization
The quality of information technology
Extent of the use of innovative management accounting techniques
Extent of use of lean production techniques (including JIT techniques)
Business sector
5.1. Importance of cost information
Even if sophisticated cost systems could substantially reduce product cost distortions it is unlikely
to be helpful unless a firm can actually utilise better cost information in its decision-making process
(Cagwin and Bouwman, 2002). Firms mainly relying on cost information for inventory valuation/profit
measurement rather than decision-making purposes may rely on less accurate cost information derived
from simplistic costing systems (Kaplan and Cooper, 1998). According to Anderson (1995) and Estrin
et al. (1994) the differing needs by organizations for accurate cost data for strategic decisions and cost
reduction may affect ABC adoption. Factors affecting the decision usefulness of cost information include
the firm’s use of cost data in pricing decisions, cost reduction efforts and the need for special cost studies.
The following hypothesis is therefore tested:
Hypothesis 1 (H1). There is a positive relationship between the importance of cost information and the
level of cost system sophistication.
406
M. Al-Omiri, C. Drury / Management Accounting Research 18 (2007) 399–424
5.2. Product diversity
Product diversity leads to a higher potential for cost distortion and applies when products consume
activity resources in different proportions. Greater product diversity requires more sophisticated costing
systems to capture the variation in resource consumption by different products. Cooper (1988b) and Estrin
et al. (1994) point out that product diversity includes support, process and volume diversity. Support
diversity refers to varying support given to each product by various support departments whereas process
diversity refers to differences in consumption among all identifiable activities relating to product design,
manufacture, and distribution. Volume diversity occurs when products are manufactured in different
batch sizes thus affecting how batch level costs should be assigned to products. The more complex the
production process the more complex the costing system that is required to model it (Malmi, 1999).
Product diversity determines production process complexity resulting in more activities being required to
manufacture them. Thus, to measure the resource consumption of different products in a complex setting,
sophisticated costing systems are required. Based on the above discussion the following hypothesis is
formulated:
Hypothesis 2 (H2). There is a positive association between higher levels of product diversity and the
level of cost system sophistication.
5.3. Cost structure
A review of European surveys relating to cost structures of manufacturing companies by Brierley
et al. (2001) indicated that direct material costs tend to be higher than indirect costs. They conclude
that if indirect costs make up a relative small proportion of total costs in some industries it may not be
worthwhile investing in sophisticated accounting methods to allocate indirect costs. Kaplan and Cooper
(1998) advocate that firms with high indirect costs should assign these costs using sophisticated systems,
since unsophisticated systems are likely to report distorted costs. Conversely, where the proportion of
indirect costs is low, direct costing may be appropriate or, if indirect costs are assigned to cost objects,
unsophisticated traditional costing systems may not result in the reporting of seriously distorted costs.
Thus, the following hypothesis is tested:
Hypothesis 3 (H3). There is a positive association with the proportion of indirect costs within an
organization’s cost structure and the level of cost system sophistication.
5.4. Intensity of the competitive environment
Studies by Libby and Waterhouse (1996) and Simons (1990) suggest that companies facing intensely
competitive market environments tend to employ relatively more sophisticated management accounting
systems. These views are also consistent with Khandwalla’s (1972) finding of a positive relationship
between sophisticated management controls and competition intensity. Bruns and Kaplan (1987) identify
competition as the most important external factor for stimulating managers to consider redesigning their
costing systems. Cooper (1988b) has also argued that organizations facing fierce competition should
implement ABC.
M. Al-Omiri, C. Drury / Management Accounting Research 18 (2007) 399–424
407
Companies facing intensive competition also have a greater impetus to find ways to differentiate
their products and services from those provided by competitors (Guilding and McManus, 2002). This
requirement frequently results in a greater number of product and service lines. In addition, it results in
differentiation sought through increased customization of products and services in order to meet specific
customer desires. In these circumstances companies require sophisticated costing systems to measure
accurately the costs of increased variety and customization. They will then be able to ascertain whether
the strategy adopted results in the revenues generated exceeding the higher costs associated with the
increase in variety and customization. Companies facing relatively intensive market conditions are also
likely to have products and services with low profit margins due to pressure to match or under-cut prices
charged by competing firms. Thus, there is a greater need for accurate cost systems since there is a danger
that inaccurate systems may significantly overcost or undercost products/services to such an extent that
they result in incorrect decisions. For example, undercosting may lead to incorrectly continuing with
low margin products which are really loss making. Conversely, overcosting may mistakenly result in
the discontinuation of reported loss making products or services, which are really generating low profit
margins. Thus, organizations facing intense competition have a greater need for accurate cost information.
Based on the above discussion the following hypothesis is tested:
Hypothesis 4 (H4). There is a positive association between the intensity of competition and the level
of cost system sophistication.
5.5. Size of the organization
Size has been found to be an important factor influencing the adoption of more complex administration
systems (Moores and Chenhall, 1994). Previous studies have also noted a positive relationship between
company size and the adoption of ABC systems (Innes and Mitchell, 1995; Bjornenak, 1997; Malmi,
1999). A possible reason for this is that larger organizations have relatively greater access to resources
to experiment with the introduction of more sophisticated accounting systems. Therefore, the following
hypothesis is tested:
Hypothesis 5 (H5). There is a positive relationship between the size of the organization and the level
of cost system sophistication.
5.6. The quality of information technology
The chosen level of cost system sophistication should be made on costs versus benefits criteria. Sophisticated costing systems become more beneficial as the cost of data collection and processing is reduced
(Cooper, 1988b). The level of information technology can thus play an important role in influencing cost
system design. For example, the measurement cost associated with using additional cost drivers depends
on whether the data required by that driver is already available or has to be specifically determined. Organizations with high quality information systems can provide detailed data that is easy to access relating to
the cost driver information that is needed by more sophisticated costing systems. In general, companies
with shared databases that track the detailed operational data needed for resource and activity analysis
have an easier time implementing and maintaining ABC (Reeve, 1995; Anderson, 1995). Therefore, the
following hypothesis is tested:
408
M. Al-Omiri, C. Drury / Management Accounting Research 18 (2007) 399–424
Hypothesis 6 (H6). There is a positive relationship between the quality of an organization’s information
technology and the level of cost system sophistication.
5.7. Extent of the use of innovative management accounting techniques
ABC is often linked to other strategic and business initiatives that are likely to complement and enhance
each other, rather than being individually necessary and sufficient for improvement (Cooper and Kaplan,
1991). In particular, studies indicate that improvements in costing systems have been implemented to
reconcile management accounting information with other advanced management practices (Anderson,
1995). According to Swenson (1995) linkages with other initiatives provides a ready application for the
ABC information. Krumwiede (1998) also reported that firms linked ABC to other improvement initiatives
(e.g. target costing, benchmarking of activities and value chain analysis) because of their need for more
accurate product/activity costs. Thus, other initiatives may act as catalysts for replacing simplistic costing
systems with more sophisticated ones (Innes and Mitchell, 1990). Therefore, the following hypothesis is
tested:
Hypothesis 7 (H7). The level of cost system sophistication will be greater in organizations adopting
other accounting innovations than the organizations not adopting them.
5.8. Extent of use of lean production techniques (including JIT techniques)
Firms adopting JIT production techniques establish production cells that are dedicated to the manufacturing of a single product or family of similar products. Hence, many of the support activities can be
directly traced to the dedicated cells. Therefore, the benefits from implementing sophisticated costing
systems may be lower in JIT organizations. Also given that JIT production is oriented towards process
and time it is likely to be supported by traditional costing methods that are based on how long the product
is in the process
The pursuit of lean production techniques and a JIT philosophy that focuses on eliminating waste or
non-value-added activities also motivates firms to derive a better understanding of what is creating the
firm’s product and support costs and what are the cost drivers. The focus on activity analysis makes the
implementation of sophisticated costing techniques based on activity costing and the identification of
appropriate cost drivers easier to implement. Based on the conflicting relationship on the impact of lean
production techniques the following null hypothesis is formulated:
Hypothesis 8 (H8). There is no relationship between the implementation of lean production techniques
and the level of cost system sophistication.
5.9. Business sector
Shields (1997) argues that the design and effectiveness of cost accounting information and systems are
conditional on characteristics of industries. The diffusion of innovation literature (Abrahamson, 1991)
also implies that organizations within an industry sector may imitate other organizations. Therefore, the
imitation process may result in similar accounting systems being adopted within specific business sectors. ABC was initially introduced in manufacturing organizations. Thus, mimicking behaviour suggests
M. Al-Omiri, C. Drury / Management Accounting Research 18 (2007) 399–424
409
that manufacturing organizations may be more likely to adopt sophisticated costing systems. Kaplan and
Cooper (1998), however, suggest that service firms are ideal candidates for ABC, even more than manufacturing firms, because most of their costs are fixed and indirect. In contrast, manufacturing firms can
trace important components of costs (i.e. direct costs) to individual products so traditional product costing
systems may report reasonably accurate product costs. Both of the above arguments suggest that the level
of cost system sophistication may differ between business sectors but it is unclear which sectors would
have the more sophisticated systems. The following non-directional hypothesis is therefore formulated:
Hypothesis 9 (H9). The level of cost system sophistication will differ significantly according to the
business sector in which an organization operates.
6. Research design and data collection
A postal questionnaire survey was used to gather the data. A random sample consisting of 1000 UK
manufacturing/service firm of was chosen from the Financial Analysis Made Easy (FAME) database.
Only firms with annual sales exceeding £50 million were selected since the focus was on larger companies that would be likely to have an established management accounting function. The membership
database of the Chartered Institute of Management Accountants (CIMA) was used to assist in identifying
potential respondents within the selected FAME sample. An attempt was made to match the 1000 firms
with the CIMA database. This resulted in the identification of 534 firms where named individuals were
identified operating within the management accounting function but the remaining 466 questionnaires
were addressed to the Finance Director with the instruction that the questionnaire should be completed
by the head of the management accounting function.
A total of 384 questionnaires were returned from the sample of 1,000 companies consisting of 176
completed and usable questionnaires and 208 uncompleted. This yielded a usable response rate of 19.6%
based on the method recommended by De Vaus (1990).7 Details relating to the respondents’ business
sector and annual sales turnover are presented in Table 2.8
Respondents were asked to complete the questionnaire from the perspective of the business unit where
they were employed. The justification for this is that the features of costing systems and contextual factors
may differ between business units in large companies. For example, one business unit may have low product diversity and low overhead costs thus resulting in a simplistic costing being appropriate. In contrast,
another business unit within the same company may engage in different activities and have high product
diversity and overhead costs resulting in a more sophisticated costing system being appropriate.9 It was
7
The 208 non-respondents consisted of 102 indicating that either the company had ceased to exist or the company no longer
employed the respondent and 106 specifying lack of time or it was not company policy to participate in surveys. The usable
response rate was derived as follows:
176/(1000 − 102) = 19.6%.
Low response rates appear to be a feature of recent product costing surveys. Ittner et al. (2002) and Cagwin and Bouwman (2002)
respectively reported response rates of 11% and 21.2%.
8
Approximately 80% of the responses were received from the 534 questionnaires mailed to a named CIMA member. Thus the
mailing of 466 questionnaires to unnamed individuals had a detrimental impact on the response rate.
9
The study by Abernethy et al. (see Section 3 of this paper) described how the costing systems differed, in terms of their level
of sophistication, between different divisions in the same company. Also, 57% of the respondents to this survey indicated that
the costing system was only applicable to the business unit where they were employed.
410
M. Al-Omiri, C. Drury / Management Accounting Research 18 (2007) 399–424
not possible to undertake non-response bias tests relating to comparing demographic data for respondents
and non-respondents as no data were available at the business unit level. Respondents provided details
relating to their business units (e.g. annual sales turnover, number of employees, types of business activities undertaken) but this frequently differed from the information contained for the company as a whole
in the FAME database. Thus, it was inappropriate to compare respondents demographic data (based on
business unit responses) with those of non-respondents (based on the company as a whole recorded in
the FAME database).
The initial mailing of the questionnaire resulted in 83 usable responses and the first and second
reminders respectively resulted in 46 and 18 usable responses. Thus, after the second reminder stage
a total of 147 usable responses were received. The analysis of the respondents indicated that 22 of the
responding organizations (15%) were ABC users. Given that the research sought to examine the influence
of contextual factors on ABC adoption and sophisticated costing systems it was considered that the aims
of the research could not be achieved based on responses from only 22 ABC adopters. 10
In order to increase the number of respondents using sophisticated costing systems we obtained the
assistance of a UK firm of ABC consultants. They agreed to mail the questionnaire to their clients and
this process resulted in the receipt of a further 29 responses from ABC adopters. All of the 29 respondents
were included in the FAME database11 .
The responses of the 22 ABC adopters obtained from the initial, first and second reminder mailings
were compared with the 29 ABC adopters obtained from the ABC consultants for all of the variables
used in this research. There were no significant differences in the responses between these two groups
of ABC adopters. A non-response bias test, based on the assumption that later respondents more closely
resemble non-respondents was undertaken, by comparing the responses of the initial mailing (N = 83)
with the responses from the reminder mailings (N = 64) in respect of all of the dependent and independent
variables used in the research.12 There was no evidence of non-response bias.
7. Measurement of the variables
Objective data were used for size, cost structure and business sector. Size was measured using the
annual sales turnover (£ million) for the respondents’ business unit. The cost structure of the business
unit was measured by indirect costs as a percentage of total costs and the respondents were asked to
indicate which of six business sectors applied to their business unit. The other independent variables of
interest required the use of perceptive measures and thus multi-question Likert-type seven point scales
were used to derive composite scores for each variable. Where possible the measures were based on prior
literature. Details specifying the number of questions used and Cronbach’s Alpha for the independent
variables are shown in Table 1.13
10
The initial analysis of the responses also indicated that only a very small number of respondents would be located within the
sophisticated region at the extreme right of the sophistication continuum presented in Fig. 1. Therefore, there was a danger that
the statistical analysis would not identify the factors influencing the costing system for such a small number of organizations.
11
The firm of consultants were not prepared to provide us with a list of their clients and they insisted on mailing the survey.
They were provided with 50 copies of the questionnaire and this process yielded 29 responses.
12
In addition, the responses from the initial mailing were also compared with the responses from the second reminder (N = 18).
There was no evidence of non-response bias.
13
The complete questionnaire is available on request from the corresponding author.
M. Al-Omiri, C. Drury / Management Accounting Research 18 (2007) 399–424
411
Table 1
Details of the independent variables used in the researcha
Independent variables
Number of questions used
Cronbach’s Alpha
Size
Cost structure
Business sector
Importance of cost information
Quality of information technology
Extent of use of innovative management accounting techniques
Intensity of the competitive environment
Extent of use of lean production techniques
1
1
1
4
4
7
4
6
Objective measure
Objective measure
Objective measure
0.62
0.77
0.76
0.87
0.78
Product diversity
Volume diversity
Support diversity
2
2
0.75
0.53
a
Note: A complete version of the questionnaire is available from the corresponding author.
The exploratory factor analysis showed a one factor solution for all of the independent variables derived
from multiple questions apart from product diversity. Four questions were used to measure product
diversity. Two factors emerged from the factor analysis with loadings greater than 0.4 that explained 74%
of the variance. Two questions that were concerned with volume diversity loaded on to one factor and
the remaining two relating to support diversity loaded on to the other factor. These factors were therefore
respectively labeled volume diversity and support diversity. Cronbach’s alpha for the latter item (0.53)
is marginally below the minimum acceptable level of 0.60 suggested by Hair et al. (1998) but above the
minimum of 0.5 suggested by Nunnally (1978).14
Four different measures were used as a proxy for the dependent variable for determining the level
of cost system sophistication. First, two dichotomous variables were used to measure the level of cost
system sophistication. ABC adopters were categorized as sophisticated systems and non-ABC adopters
were categorized as non-sophisticated systems. A question, adapted from Krumwiede (1998), was used
to identify which of nine different stages towards ABC implementation best described the business unit’s
current situation and thus identify whether organizations were ABC adopters or non-adopters.15 The
second measure for the dependent variable focused on the number of cost pools (centres) used in the
first stage of the two-stage allocation process and the third measure used the number of different types
of second stage cost drivers. Respondents were requested to insert the number of cost centers/cost pools
that were used in the first stage of the two-stage allocation process to assign indirect costs to products or
services. Information for the third measure was derived from a question that requested the respondents
to insert how many different types of overhead allocation bases were used in the second stage of the two-
14
Taking into account that Cronbach’s alpha is sensitive to the number of items, and that alpha provides conservative results
for scales with a few items, it was decided to use a composite score for support diversity. This is consistent with Hair et al.’s
assertion that as Cronbach’s alpha has a positive relationship with the number of items within the scale. Thus, researchers can
rely on less stringent reliability measurements for scales consisting of a few items.
15
The following are examples of the different stages included in the question—ABC has not been seriously considered (stage
1), ABC has been considered but not approved (stage 2) and ABC has been implemented and is generally accepted (stage 9)
412
M. Al-Omiri, C. Drury / Management Accounting Research 18 (2007) 399–424
Table 2
Information relating to the respondents’ business sector and annual sales turnover
Number of Cases (N)
Business sector
Manufacturing
Financial and commercial
Retail
Service
Conglomerate
Other
Annual sales turnover
Less than £ 25 ma
£26-£50 ma
£51-£75 m
£76-£100 m
£101-£200 m
£201-£300 m
Over £300 m
Total
Percentage (%)
91
22
9
40
0
14
176
52
12
5
23
0
8
100
6
19
19
30
26
30
46
3
11
11
17
15
17
26
176
100
a
Note: Because the respondents were asked to complete the questionnaire from the perspective of the business units where
they were employed the annual sales revenues for some of the business units shown in Table 2 is below the minimum sales
turnover of £50 million used to select the sample from the FAME database. As indicated in Section 6 the annual sales turnover
in the FAME database was recorded at the group level.
stage allocation process.16 Finally, the fourth measure compared the results with the dependent variable
being categorized by dichotomous variables represented by direct costing and absorption costing systems.
To ascertain whether absorption or direct costing systems were used respondents were asked to indicate
whether or not their costing systems assigned indirect costs to products or services.
8. Research findings
The descriptive statistics relating to the research findings are presented in Tables 2–6. Table 2 indicates
that 52% of the respondents were employed in the manufacturing sector and the remainder in the nonmanufacturing sector.17 An analysis of total costs by business sectors is presented in Table 3. This
table indicates that the average direct and indirect costs for all organizations were respectively 69% and
31%. Manufacturing units have a significantly larger percentage of direct costs (75%) and financial and
16
Detailed examples were provided for the questions relating to the number of cost pools and different types of overhead
allocation bases in order to ensure that the respondents fully understood what information was required.
17
The non-manufacturing sector accounts for more than 48% of UK gross domestic product and the lower proportion of nonmanufacturing organizations included in this survey is likely to be attributed to the fact that the sample omitted organizations
whose objectives were not profit making. Most of the organizations (e.g. municipal authorities and public sector organizations)
within this category are likely to operate in the service (non-manufacturing) sector.
M. Al-Omiri, C. Drury / Management Accounting Research 18 (2007) 399–424
413
Table 3
Average cost structure as a percentage of total costs analysed by business sectors
Manufacturing
Direct materials
Direct labour
Direct non-manufacturing costs
Indirect manufacturing costs
Indirect non-manufacturing costs
Total direct costs—mean/(standard deviation)
Total indirect costs—mean/(standard deviation)
N
52.2
14.0
8.7
10.3
14.8
74.9 (13.9)
25.1 (13.9)
87
Financial and
commercial
Service
Retail and
other
Total
49.0 (23.9)
51.0 (23.9)
20
68.1 (25.6)
31.9 (25.6)
39
66.4 (18.5)
33.6 (18.5)
20
69.1 (19.1)
30.9 (19.1)
166
Table 4
Analysis of costing systems by business sectors
Business sector
% ABC
adoption
% Traditional absorption
costing
% Direct costing
systems
% No formal
costing system
N (%)
Manufacturing
Financial and commercial
Retail and other
Service
Total (%)
Total (N)
20
68
22
33
29
51
52
9
26
17
35
62
21
9
35
28
23
40
7
14
17
22
13
23
91 (52%)
22 (12%)
23 (13%)
40 (23%)
100%
176
commercial organizations have a significantly higher proportion of indirect costs (51%).18 Tables 4 and 5
provide an analysis of the types of costing systems used by business sectors and sales turnover. Both
tables indicate that the following types of costing systems were used:
•
•
•
•
Traditional absorption costing systems (35%; N = 62).
ABC systems (29%; N = 51). 19
Direct costing systems (23%; N = 40).
No formal costing systems (13%; N = 23).
Table 4 indicates that 68% of the organizations within the financial and commercial sector compared
with 20% in the manufacturing sector have implemented ABC systems. Table 5 indicates that 53% of
the smallest firms (annual sales of less than £100 million) have either no formal costing systems or
18
A t-test was performed comparing the differences between the responses for the percentage of indirect costs for financial and
commercial organizations (N = 20) and the remaining organizations (N = 146). The results were significant at the one per cent
level (two-tailed) level of confidence. In addition, the t-test was also performed to examine the differences in the responses for
the cost structures between the manufacturing (N = 87) and the non-manufacturing (N = 79) organizations. The results were also
significant at the one per cent level (two-tailed) of confidence.
19
The adoption rate of 29% is likely to represent an over estimate of ABC usage because of the inclusion of 29 ABC adopters
derived from the firm of ABC consultants (see Section 6 for an explanation). Care should therefore be taken in generalising the
findings relating to ABC adoption rates. The adoption rate (without including the responses from the ABC consultants) was 15%
and is likely to represent a more reliable estimate of ABC adoption.
414
M. Al-Omiri, C. Drury / Management Accounting Research 18 (2007) 399–424
Table 5
Analysis of costing systems by annual sales turnover
Annual sales revenue
(£ million)
% ABC adoption
(N = 51)
% Traditional
absorption costing
(N = 62)
% Direct costing
systems (N = 40)
% No formal
costing system
(N = 23)
N (%)
(N = 176)
< £100 m
£100 m–£300 m
Over £300 m
Total (%)
Mean (£ million)
Standard deviation (£
million)
12
39
43
29
995
2,093
35
34
37
35
309
471
30
23
11
23
188
327
23
4
9
13
105
90
74 (42%)
56 (32%)
46 (26%)
176
Table 6
Cross tabulation table (cost pools by cost drivers)
a
Note: The numbers in the parentheses relate to the number of individual observations (N) expressed as a percentage of the total
number of observations.
operate only direct costing systems. The corresponding percentage for the largest companies (annual
sales exceeding £300 million) is 20%. Table 5 also indicates that 43% of the largest firms compared with
12% of the smallest firms had adopted ABC systems.
Table 6 presents a cross tabulation table and frequency distributions for the number of cost pools
and the different types of second stage cost drivers in respect of 112 of the 113 respondents that operated absorption costing systems. The shaded area in the lower right hand corner represents the more
sophisticated costing systems in terms of the number of cost pools and different types of drivers and
those towards the top left hand corner the least sophisticated systems. Of the 50 companies that are
located in the shaded area 45 out of the 46 companies currently using ABC were located in this area.20
In addition, the number of cost pools and different types of cost drivers was significantly higher for ABC
users compared with non-users (p-value using the t-test < .01, two-tailed). Therefore, the analysis suggests that those respondents that claim that their organizations have implemented ABC ‘really’ are ABC
adopters.
20
Of the 51 companies that had adopted ABC 46 were currently using ABC and 5 were in the process of implementing it.
M. Al-Omiri, C. Drury / Management Accounting Research 18 (2007) 399–424
415
In order to test the hypotheses specified in Section 5 the following model was applied in respect of the
four different measures of the dependent variable:
Y = b1 + b2 COSTIMP + b3 SUPDIV + b4 VOLDIV + b5 INDCOST + b6 COMPET + b7 SIZE
+ b8 ITQUAL + b9 INOVMAT + b10 SERV + b11 FIN + b12 RETAIL + e
where Y: level of cost system sophistication using the four measures described at the end of Section 7 to
measure the dependent variable; COSTIMP: importance of cost information; SUPDIV: support diversity;
VOLDIV: volume diversity; INDCOST: indirect costs as a percentage of total costs; COMPET: intensity
of the competitive environment; SIZE: size measured by annual sales turnover logarithmically adjusted
for the observed non-linearity; ITQUAL: quality of information technology; INOVMAT: extent of the
use of innovative management accounting techniques; SERV: service sector, dummy variable set equal
to 1 if company is in service sector, otherwise zero; FIN: finance sector, dummy variable set equal to 1
if company is in finance sector, otherwise zero; RETAIL: retail sector, dummy variable set equal to 1 if
company is in retail sector, otherwise zero.
The variable ‘the extent of lean production techniques (including JIT techniques)’ is excluded from
the above regression equation since this variable is only applicable to manufacturing organizations.21
The first of the four measures of the dependent variable classifies the dependent variable in terms of the
dichotomous variable of ABC adoption and non-adoption. Therefore, logistic regression is used and the
applied to the 153 companies that had established formal costing systems as shown in Table 4. The above
model contains 11 independent variables (including 3 dummy variables).22
Table 7 presents the results of the logistic regression. The final two columns of the table present the
collinearity statistics. It can be seen the variance inflation factors well below the generally accepted
critical threshold of 10 (an indication of high levels of multicollinearity) and the tolerances are above 0.2
(tolerances below 0.2 represent a more conservative estimate that multicollinearity may be a problem).
Table 8 also presents a correlation matrix for the independent variables. None of the correlation coefficients
are high thus suggesting that multicollinearity is not an issue. Table 7 indicates that the following variables
are statistically significant:
Importance of cost information (p < .01).
Intensity of the competitive environment (p < .01).
Size measured by annual sales turnover (p < .01).
Extent of the use of innovative management accounting techniques (p < .01).
Finance sector; dummy variable (p < .01).
Service sector; dummy variable (p < .05).
A positive sign for the logistic regression coefficient indicates that the variable is positively related
to ABC adoption whereas a negative sign indicates that as the variable increases, an organization is less
21
The results relating to this variable are reported later in this section.
Green (1991) proposed a general rule of thumb for determining the minimum sample size to test the R2 and significance tests
on the regression coefficients. He suggested that the minimum sample should be greater than 50 + 8k for the former and greater
than 104 + k for the latter, where k is equal to the number of independent variables. Therefore, the sample of 153 respondents
exceeds the minimum requirements specified by Green for applying regression models.
22
416
M. Al-Omiri, C. Drury / Management Accounting Research 18 (2007) 399–424
Table 7
Logistic regression analysis with the dichotomous variable ABC/non-ABC as the dependent variable (N = 153)
Volume diversity
Support diversity
Intensity of the competitive
environment
Quality of information
technology
Importance of cost information
Extent of use of innovative
management accounting
practices
Size (Annual sales in £ million)
Cost structure (% of indirect
costs)
Financial sector dummy variable
Retail and other sector dummy
variable
Service sector dummy variable
Intercept
Chi-square
Cox and Snell R square
Hosmer and Lemeshow
goodness of fit
Nagelkerke R square
Per cent correctly classified
a
Standard
error
p-valuesa
Expected sign
B (Logistic
coefficient)
Exp. B
Collinearity statistics
tolerance VIF
+
+
+
−.032
−.244.
.479
.177
.190
.229
.427
.100
.002
.968
.783
1.620
.756
.870
.695
1.322
1.150
1.439
+
−.234
.194
.114
.791
.800
1.250
+
+
1.272
.556
.359
.226
.000
.007
3.569
1.744
.781
.794
1.281
1.259
+
+
.854
−.013
.250
.014
.000
.172
2.350
.987
.785
.805
1.274
1.242
Non-directional
Non-directional
2.864
.555
.886
.727
.001
.223
17.529
1.743
.638
.787
1.567
1.271
Non-directional
−9.182
1.239
2.408
.625
2.466
.000
.371
.574
.047
.000
3.452
.860
1.163
.515
83%
Note: p-values are two-tailed for the dummy variables and one-tailed for the remaining variables.
likely to adopt ABC.23 All of the significant variables listed above are in the direction predicted. The
Chi-square statistic shown in Table 7 is comparable to the overall F-test in multiple regression. The
model is statistically significant at the .000 level. The Hosmer and Lemeshow goodness of fit value (.574)
measures the correspondence of the actual and predicted values of the dependent variable. This statistic
tests the hypothesis that the observed data are significantly different from the predicted values. Thus, a
non-significant statistic indicates that the model does not differ significantly from the observed data (Hair
et al., 1998).24 Nagelkerke R2 (.515) attempts to quantify the proportion of explained “variation” in the
logistic regression model. It is similar in intent to the R2 in a linear regression model (Norusis, 2000).
23
Exp B shown in the final column of Table 7 is an indicator of the change in odds resulting from a unit change in the indicator.
Values greater than 1 indicate that as the predictor increases, the odds of the outcome occurring increase; conversely, a value
less than one indicates that as the predictor increases, the odds of the outcome occurring decrease. This is consistent with the
signs of the regression coefficients.
24
In other words, if the p-value is large, the model fits the data well, whereas a p-value that is smaller than alpha indicates a
lack of fit.
1
1. Volume diversity
2. Support diversity
3. Intensity of the competitive
environment
4. Quality of information
technology
5. Extent of use of lean
production techniques
(including JIT)
6. Extent of use of innovative
management accounting
techniques
7. Size (Annual sales turnover)
8. Average % indirect costs
9. Manufacturing sector dummy
variable
10. Financial sector dummy
variable
11. Retail sector dummy variable
12. Service sector dummy
variable
*
**
2
3
1.000
.092
1.000
.302**
.045
−.031 −.185*
1.000
.078
Correlation is significant at the 0.05 level (2-tailed).
Correlation is significant at the 0.01 level (2-tailed).
4
1.000
5
6
.156
.031
−.024 −.022
.319**
.047
.253*
1.000
7
.222**
.148*
−.168*
.184*
−.172*
.222*
1.000
8
.159*
.165*
.041
9
10
11
12
.175*
−.166*
.010
.072
−.172*
.250**
−.128
−.017
−.171*
−.163*
.076
−.072
−.098
.131
−.190
.022
−.024
.176
.056
.034
.159
−.170
.013
.142
.016
−.032
.160*
−.077
−.025
1.000
.127
1.000
−.080
−.170*
1.000
.244**
.245**
−.391**
−.056
.065
−.401**
−.051
−.043
−.561**
1.000
−.147
−.205**
1.000
−.210**
1.000
M. Al-Omiri, C. Drury / Management Accounting Research 18 (2007) 399–424
Table 8
Spearman correlation matrix for the independent variables
417
418
M. Al-Omiri, C. Drury / Management Accounting Research 18 (2007) 399–424
Table 9
Multiple regression analysis with the number of cost pools as the dependent variable (N = 153)
Unstandardized coefficients
Standardized
coefficients
Beta
t
Significance (p-value)
B
(Constant)
Volume diversity
Support diversity
Intensity of the competitive
environment
Quality of information
technology
Importance of cost information
Extent of use of innovative
management accounting
practices
Size (annual sales in £ million)
Cost structure (% of indirect
costs)
Financial sector dummy variable
Retail and other dummy variable
Service sector dummy variable
Standard error
−1.215
.700
.253
4.399
12.096
1.040
1.037
1.322
.057
.019
.292
−.100
.673
.244
3.327
.920
.251
.404
.001
−.690
1.189
−.048
−.581
.281
3.221
1.417
1.578
1.363
.169
.085
2.041
1.040
.021
.150
4.159
−.012
1.201
.081
.286
−.012
3.463
−.147
.001
.442
11.154
−4.524
1.366
5.157
4.644
3.646
.198
−.080
.030
2.163
−.974
.375
.032
.332
.708
R square, .24; adjusted R square, .19; F, 4.123; significance (p = 0.000).
Note: p-values are two-tailed for the dummy variables and one-tailed for the remaining variables.
The final entry in Table 7 indicates that the model correctly classified 83% of the respondents as ABC
adopters or non-adopters.25
The second and third measures classify the level of cost system sophistication in terms of the number
of cost pools and different types of cost drivers being the dependent variables.26 Both of these dependent
variables were measured on an interval scale so multiple regression was used. The results of the multiple
regression analysis are presented in Table 9 for the number of cost pools and Table 10 for the number
of different types of cost drivers. Reference to these tables indicates that the following variables were
significant for both dependent variables:
• Importance of cost information (p < .05 for number of cost pools and p < .01 for number of different
types of cost drivers).
• Intensity of the competitive environment (p < .01 for both dependent variables).
• Size (p < .01 for both dependent variables).
• Financial sector (p < .05 for both dependent variables).
25
It should also be noted that the differences in the responses for ABC adopters and non-adopters were also examined based on
bivariate analysis using either the Mann–Whitney or t-tests. The results were identical to those reported for logistic regression
in terms of the same variables being significant or non-significant for both tests. The above analysis compared ABC adopters
(N = 51) with non-adopters that operate formal reporting systems (N = 102). Thus, those organizations not operating a formal
costing system (n = 23) were excluded from the analysis. The latter group were, however, also incorporated in a separate logistic
regression analysis within the non-ABC adopters category (N = 102 + 23) but there were no differences in the outcomes in terms
of the significant and non-significant variables.
26
The number of cost pools and cost drivers were coded as zero for organizations operating a direct costing system.