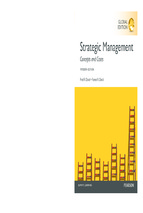
The world by income
Low ($1,035 or less)
Lower middle ($1,036–$4,085)
Upper middle ($4,086–$12,615)
High ($12,616 or more)
No data
Classified according to
World Bank estimates of
2012 GNI per capita
2014
World Development
Indicators
© 2014 International Bank for Reconstruction and Development / The World Bank
1818 H Street NW, Washington DC 20433
Telephone: 202-473-1000; Internet: www.worldbank.org
Some rights reserved
1 2 3 4 17 16 15 14
This work is a product of the staff of The World Bank with external contributions. The findings, interpretations, and conclusions
expressed in this work do not necessarily reflect the views of The World Bank, its Board of Executive Directors, or the governments they represent. The World Bank does not guarantee the accuracy of the data included in this work. The boundaries, colors,
denominations, and other information shown on any map in this work do not imply any judgment on the part of The World Bank
concerning the legal status of any territory or the endorsement or acceptance of such boundaries.
Nothing herein shall constitute or be considered to be a limitation upon or waiver of the privileges and immunities of The World
Bank, all of which are specifically reserved.
Rights and Permissions
This work is available under the Creative Commons Attribution 3.0 IGO license (CC BY 3.0 IGO) http://creativecommons.org/
licenses/by/3.0/igo. Under the Creative Commons Attribution license, you are free to copy, distribute, transmit, and adapt this
work, including for commercial purposes, under the following conditions:
Attribution—Please cite the work as follows: World Development Indicators 2014. Washington, DC: World Bank. doi:10.1596/9781-4648-0163-1. License: Creative Commons Attribution CC BY 3.0 IGO
Translations—If you create a translation of this work, please add the following disclaimer along with the attribution: This translation was not created by The World Bank and should not be considered an official World Bank translation. The World Bank shall
not be liable for any content or error in this translation.
Adaptations—If you create an adaptation of this work, please add the following disclaimer along with the attribution: This is an
adaptation of an original work by The World Bank. Responsibility for the views and opinions expressed in the adaptation rests
solely with the author or authors of the adaptation and are not endorsed by The World Bank.
Third-party content—The World Bank does not necessarily own each component of the content contained within the work. The
World Bank therefore does not warrant that the use of any third-party-owned individual component or part contained in the
work will not infringe on the rights of those third parties. The risk of claims resulting from such infringement rests solely with
you. If you wish to re-use a component of the work, it is your responsibility to determine whether permission is needed for
that re-use and to obtain permission from the copyright owner. Examples of components can include, but are not limited to,
tables, figures, or images.
All queries on rights and licenses should be addressed to the Publishing and Knowledge Division, The World Bank, 1818 H Street
NW, Washington, DC 20433, USA; fax: 202-522-2625; e-mail:
[email protected].
ISBN (paper): 978-1-4648-0163-1
ISBN (electronic): 978-1-4648-0164-8
DOI: 10.1596/978-1-4648-0163-1
Cover design: Communications Development Incorporated.
Cover photo: © Arne Hoel/The World Bank. Used with permission; further permission required for reuse.
Other photos:
Page xviii © Liang Qiang/The World Bank. Used with permission; further permission required for reuse.
Page 26 © Arne Hoel/The World Bank. Used with permission; further permission required for reuse.
Page 42 © Nahuel Berger/The World Bank. Used with permission; further permission required for reuse.
Page 56 © Maria Fleischmann/The World Bank. Used with permission; further permission required for reuse.
Page 70 © Roy Witlin/The World Bank. Used with permission; further permission required for reuse.
Page 84 © Mai Ky/The World Bank. Used with permission; further permission required for reuse.
Preface
In 2013 the World Bank Group announced that it
would focus on two overarching measurable goals:
ending extreme poverty by 2030 and promoting
shared prosperity. The chance to end poverty in a
generation is an unprecedented opportunity—and one
that requires data to monitor progress, to understand
the complexities of development, and to manage the
effective delivery of programs and services.
World Development Indicators 2014 provides a compilation of relevant, high-quality, and internationally
comparable statistics about global development and
the fight against poverty. It is intended to help users of
all kinds—policymakers, students, analysts, professors, program managers, and citizens—find and use
data related to all aspects of development, including those that help monitor and understand progress
toward the two goals.
Six themes are used to organize indicators—world
view, people, environment, economy, states and markets, and global links. As in past editions, World view
reviews global progress toward the Millennium Development Goals (MDGs) and provides key indicators
related to poverty. A complementary online data analysis tool is available this year to allow readers to further
investigate global, regional, and country progress on
the MDGs: http://data.worldbank.org/mdgs. Each of
the remaining sections includes an introduction; six
stories highlighting specific global, regional, or country
trends; and a table of the most relevant and popular
indicators for that theme, together with a discussion
of indicator compilation methodology.
This printed edition, and its companion The Little
Data Book 2014, presents a subset of the data collected in World Development Indicators; an index to
the full list of available indicators is at the end of
each section. Many additional relevant indicators are
available online, in database and tabular formats, and
through applications for web and mobile devices, at
http://data.worldbank.org/wdi. Online applications
also provide the indicator description and footnotes in
several languages, including Arabic, Chinese, French,
and Spanish.
World Development Indicators is the result of a collaborative effort of many partners, including the United
Nations family, the International Monetary Fund, the
International Telecommunication Union, the Organisation for Economic Co-operation and Development,
the statistical offices of more than 200 economies,
and countless others. I am extremely grateful to them
all—and especially to government statisticians around
the world. Without their hard work, professionalism,
and dedication, measuring and monitoring trends in
global development, and advancing toward the new
World Bank goals, would not be possible.
I welcome your suggestions to improve the usefulness of World Development Indicators.
Haishan Fu
Director
Development Economics Data Group
World Development Indicators 2014
iii
Acknowledgments
This book was prepared by a team led by William
Prince under the management of Neil Fantom and
comprising Azita Amjadi, Maja Bresslauer, Liu Cui,
Federico Escaler, Mahyar Eshragh-Tabary, Juan Feng,
Masako Hiraga, Wendy Ven-dee Huang, Bala Bhaskar Naidu Kalimili, Haruna Kashiwase, Buyant Erdene
Khaltarkhuu, Tariq Khokar, Elysee Kiti, Ibrahim Levent,
Hiroko Maeda, Maurice Nsabimana, Leila Rafei, Evis
Rucaj, Umar Serajuddin, Rubena Sukaj, Emi Suzuki,
Jomo Tariku, and Rasiel Victor Vellos, working closely
with other teams in the Development Economics Vice
Presidency’s Development Data Group.
World Development Indicators electronic products
were prepared by a team led by Soong Sup Lee and comprising Ying Chi, Jean-Pierre Djomalieu, Ramgopal Erabelly, Shelley Fu, Omar Hadi, Gytis Kanchas, Siddhesh
Kaushik, Ugendran Machakkalai, Nacer Megherbi, Shanmugam Natarajan, Parastoo Oloumi, Manish Rathore,
Ashish Shah, Atsushi Shimo, and Malarvizhi Veerappan.
All work was carried out under the direction of Haishan Fu. Valuable advice was provided by Poonam
Gupta, Zia M. Qureshi, and David Rosenblatt.
iv
World Development Indicators 2014
The choice of indicators and text content was
shaped through close consultation with and substantial contributions from staff in the World Bank’s
four thematic networks—Sustainable Development,
Human Development, Poverty Reduction and Economic Management, and Financial and Private Sector
Development—and staff of the International Finance
Corporation and the Multilateral Investment Guarantee Agency. Most important, the team received substantial help, guidance, and data from external partners. For individual acknowledgments of contributions
to the book’s content, see Credits. For a listing of our
key partners, see Partners.
Communications Development Incorporated provided overall design direction, editing, and layout, led
by Jack Harlow, Bruce Ross-Larson, and Christopher
Trott. Elaine Wilson created the cover and graphics
and typeset the book. Peter Grundy, of Peter Grundy
Art & Design, and Diane Broadley, of Broadley Design,
designed the report. Staff from The World Bank’s Publishing and Knowledge Division oversaw printing and
dissemination of the book.
Table of contents
Preface
iii
Acknowledgments
iv
Partners
vi
User guide
xii
1.
World view
2.
People
27
3.
Environment
43
4.
Economy
57
5.
States and markets
71
6.
Global links
85
Primary data documentation
1
Introduction
MDG 1 Eradicate extreme poverty
MDG 2 Achieve universal primary education
MDG 3 Promote gender equality and
empower women
MDG 4 Reduce child mortality
MDG 5 Improve maternal health
MDG 6 Combat HIV/AIDS, malaria, and
other diseases
MDG 7 Ensure environmental sustainability
MDG 8 Develop a global partnership for
development
Targets and indicators for each goal
World view indicators
About the data
Online tables and indicators
Poverty indicators
About the data
Introduction
Highlights
Table of indicators
About the data
Online tables and indicators
99
Statistical methods
110
Credits
113
World Development Indicators 2014
v
Partners
Defining, gathering, and disseminating international
statistics is a collective effort of many people and
organizations. The indicators presented in World
Development Indicators are the fruit of decades of
work at many levels, from the field workers who
administer censuses and household surveys to the
committees and working parties of the national and
international statistical agencies that develop the
nomenclature, classifications, and standards fundamental to an international statistical system. Nongovernmental organizations and the private sector
have also made important contributions, both in gathering primary data and in organizing and publishing
their results. And academic researchers have played
a crucial role in developing statistical methods and
carrying on a continuing dialogue about the quality
vi
World Development Indicators 2014
Front
?
User guide
and interpretation of statistical indicators. All these
contributors have a strong belief that available, accurate data will improve the quality of public and private
decisionmaking.
The organizations listed here have made World
Development Indicators possible by sharing their data
and their expertise with us. More important, their collaboration contributes to the World Bank’s efforts, and
to those of many others, to improve the quality of life
of the world’s people. We acknowledge our debt and
gratitude to all who have helped to build a base of
comprehensive, quantitative information about the
world and its people.
For easy reference, web addresses are included for
each listed organization. The addresses shown were
active on March 1, 2014.
World view
People
Environment
International and government agencies
Carbon Dioxide Information
Analysis Center
International
Diabetes Federation
http://cdiac.ornl.gov
www.idf.org
Centre for Research on the
Epidemiology of Disasters
International
Energy Agency
www.emdat.be
www.iea.org
Deutsche Gesellschaft für
Internationale Zusammenarbeit
International
Labour Organization
www.giz.de
www.ilo.org
Food and Agriculture
Organization
International
Monetary Fund
www.fao.org
www.imf.org
Internal Displacement
Monitoring Centre
International Telecommunication
Union
www.internal-displacement.org
www.itu.int
International Civil
Aviation Organization
Joint United Nations
Programme on HIV/AIDS
www.icao.int
www.unaids.org
Economy
States and markets
Global links
Back
World Development Indicators 2014
vii
Partners
viii
National Science
Foundation
United Nations Centre for
Human Settlements,
Global Urban Observatory
www.nsf.gov
www.unhabitat.org
The Office of U.S. Foreign
Disaster Assistance
United Nations
Children’s Fund
www.globalcorps.com/ofda.html
www.unicef.org
Organisation for Economic
Co-operation and
Development
United Nations Conference on
Trade and Development
www.oecd.org
www.unctad.org
Stockholm International
Peace Research Institute
United Nations Department of
Economic and Social Affairs,
Population Division
www.sipri.org
www.un.org/esa/population
Understanding
Children’s Work
United Nations Department of
Peacekeeping Operations
www.ucw-project.org
www.un.org/en/peacekeeping
United Nations
United Nations Educational,
Scientific, and Cultural Organization,
Institute for Statistics
www.un.org
www.uis.unesco.org
World Development Indicators 2014
Front
?
User guide
World view
People
Environment
United Nations
Environment Programme
Upsalla Conflict
Data Program
www.unep.org
www.pcr.uu.se/research/UCDP
United Nations Industrial
Development Organization
World Bank
www.unido.org
http://data.worldbank.org
United Nations
International Strategy
for Disaster Reduction
World Health Organization
www.unisdr.org
www.who.int
United Nations Office on
Drugs and Crime
World Intellectual
Property Organization
www.unodc.org
www.wipo.int
United Nations Office
of the High Commissioner
for Refugees
World Tourism
Organization
www.unhcr.org
www.unwto.org
United Nations
Population Fund
World Trade
Organization
www.unfpa.org
www.wto.org
Economy
States and markets
Global links
Back
World Development Indicators 2014
ix
Partners
Private and nongovernmental organizations
x
Center for International Earth
Science Information Network
International Institute for
Strategic Studies
www.ciesin.org
www.iiss.org
Containerisation
International
International
Road Federation
www.ci-online.co.uk
www.irfnet.ch
DHL
Netcraft
www.dhl.com
http://news.netcraft.com
World Development Indicators 2014
Front
?
User guide
World view
People
Environment
PwC
World Economic
Forum
www.pwc.com
www.weforum.org
Standard &
Poor’s
World Resources
Institute
www.standardandpoors.com
www.wri.org
World Conservation
Monitoring Centre
www.unep-wcmc.org
Economy
States and markets
Global links
Back
World Development Indicators 2014
xi
User guide to tables
World Development Indicators is the World Bank’s premier
compilation of cross-country comparable data on development. The database contains more than 1,300 time series
indicators for 214 economies and more than 30 country
groups, with data for many indicators going back more
than 50 years.
The 2014 edition of World Development Indicators
offers a condensed presentation of the principal indicators, arranged in their traditional sections, along with
regional and topical highlights.
4 Economy
Gross domestic product
% of GDP
% of GDP
% of GDP
% growth
% of GDP
2012
2012
2012
2012
2012
2012
2012
..
..
..
..
..
–0.6
..
5.7
9.4
3.1
3.5
–14.9
..
–35.5
–0.6
..
7.2
31.9
Albania
5.0
1.3
2.1
14.5
–1.3
–10.4
–3.4
56.6
2.0
82.1
Algeria
3.7
2.8
3.3
47.5
28.3
6.0
–0.3
..
8.9
..
..
..
..
..
..
..
..
..
Andorra
The aggregate measures for regions cover only low- and
middle-income economies.
The country composition of regions is based on the
World Bank’s analytical regions and may differ from common geographic usage. For regional classifications, see
the map on the inside back cover and the list on the back
cover flap. For further discussion of aggregation methods,
see Statistical methods.
xii
World Development Indicators 2014
Front
?
User guide
..
..
..
..
..
..
..
18.0
–25.2
12.1
..
..
10.3
34.9
Antigua and Barbuda
2.2
..
..
24.9
..
–6.9
–1.4
..
3.4
102.6
Argentina
5.8a
5.0
2.8
21.9
10.1
0.0
..
..
10.0a
33.0
–3.7
–11.1
–1.4
11.7
..
2.6
33.7
7.6
3.2
5.0
–0.1
..
..
..
..
–9.5
..
..
0.6
68.3
3.1
..
..
25.5
12.0
–3.7
–3.7
30.6
1.8
102.8
1.7
..
..
24.6
13.1
1.6
–2.2
75.3
2.5
..
14.8
4.9
5.3
41.9
15.9
22.5
6.1
6.4
1.1
31.1
Bahamas, The
0.6
..
..
8.4
..
–18.4
–4.1
47.9
2.0
76.6
Bahrain
5.4
..
..
19.5
–0.8
9.7
–0.5
35.6
2.8
74.1
39.8
21.3
2.3
–0.9
..
–4.9
1.2
..
..
8.4
3.6
–8.0
96.8
4.5
..
7.5
1.0
1.5
31.5
19.7
–2.7
1.7
40.8
59.2
30.5
1.4
..
..
20.3
7.9
–2.0
–3.6
91.1
2.8
..
3.8
1.8
2.7
15.8
9.3
–1.3
–0.2
74.2
1.3
77.4
Benin
3.8
4.2
4.1
7.1
–5.2
–7.1
–1.4
..
6.8
37.9
Bermuda
0.9
..
..
..
..
14.1
..
..
..
..
8.1
23.7
–19.7
10.9
Belize
5.7
69.7
6.0
Barbados
Belgiumb
6.0
6.2
Bangladesh
Belarus
8.7
7.6
..
..
Bolivia
4.2
5.3
4.7
25.7
5.5
7.9
..
..
4.6
Bosnia and Herzegovina
3.8
0.8
2.0
14.5
..
–9.3
–1.2
..
2.0
58.1
Botswana
4.2
4.6
4.9
40.7
33.2
–7.4
–1.9
..
7.5
44.2
Brazil
3.7
2.2
2.4
14.8
4.3
–2.4
–2.6
52.8
5.4
80.8
Brunei Darussalam
1.2
..
44.5
..
..
..
..
4.0
1.7
21.7
–1.4
–2.0
15.4
3.0
79.6
5.9
7.0
7.0
22.9
8.5
–2.0
–3.2
..
3.8
30.3
Burundi
3.6
4.3
4.5
17.5
–13.7
–10.3
..
..
18.0
23.0
Cabo Verde
6.7
2.6
2.9
35.0
..
–11.5
–9.0
..
2.5
–4.4
10.9
..
..
0.5
73.8
Burkina Faso
0.6
..
61.2
Bulgaria
65.9
78.7
Cambodia
8.1
7.0
7.0
10.6
–7.5
–8.6
2.9
50.1
Cameroon
3.3
4.8
5.0
15.8
–1.6
–3.8
..
..
2.9
21.2
Canada
1.9
..
..
23.6
13.0
–3.5
–1.3
53.8
1.5
..
Cayman Islands
..
..
..
..
..
..
4.8
–18.0
–1.8
..
..
..
0.7
..
5.8
18.1
Chad
9.6
5.0
8.7
..
..
..
..
..
10.2
11.9
..
..
..
..
..
..
3.0
..
..
..
..
Chile
4.1
..
..
21.4
–0.2
–3.5
1.3
China
10.6
7.7
7.7
51.2
35.0
2.3
..
..
2.7
187.6
4.4
..
..
28.3
..
2.3
3.8
39.2
4.1
335.3
107.6
Hong Kong SAR, China
0.5
..
..
..
Central African Republic
Channel Islands
..
77.3
..
..
57.4
..
42.9
23.8
..
6.1
Colombia
4.5
4.0
4.3
18.9
–3.2
–3.3
–1.1
62.6
3.2
42.9
Comoros
1.9
3.3
3.5
..
..
..
..
..
1.8
38.3
Congo, Dem. Rep.
5.7
7.5
7.5
..
..
..
3.8
..
85.1
18.3
Macao SAR, China
12.7
Front
World Development Indicators 2014
?
User guide
World view
People
Data presentation conventions
• A blank means not applicable or, for an aggregate, not
analytically meaningful.
• A billion is 1,000 million.
• A trillion is 1,000 billion.
• Figures in blue italics refer to years or periods other
than those specified or to growth rates calculated for
less than the full period specified.
• Data for years that are more than three years from the
range shown are footnoted.
• The cutoff date for data is February 1, 2014.
World view
..
..
8.0
Aggregate measures for income groups
Aggregate measures for regions
61.0
..
Bhutan
Aggregate measures for income groups include the 214
economies listed in the tables, plus Taiwan, China, whenever data are available. To maintain consistency in the
aggregate measures over time and between tables, missing data are imputed where possible.
35.8
5.1
Azerbaijan
60
Forecast
2013–14
5.9
Armenia
Tables
Estimate
2012–13
11.8
Angola
Global links
The tables include all World Bank member countries (188),
and all other economies with populations of more than
30,000 (214 total). Countries and economies are listed
alphabetically (except for Hong Kong SAR, China and
Macao SAR, China, which appear after China).
The term country, used interchangeably with economy,
does not imply political independence but refers to any territory for which authorities report separate social or economic
statistics. When available, aggregate measures for income
and regional groups appear at the end of each table.
% of GNI
Broad
money
Afghanistan
American Samoa
Environment
States and markets
% of GDP
Central
Central
Consumer
government government price index
cash surplus
debt
or deficit
average annual % growth
Austriab
Economy
Current
account
balance
..
2000–12
Australia
People
Adjusted
net savings
Afghanistan
Aruba
World view
Gross
savings
People
Environment
Environment
Classification of economies
For operational and analytical purposes the World Bank’s
main criterion for classifying economies is gross national
income (GNI) per capita (calculated using the World Bank
Atlas method). Because GNI per capita changes over time,
the country composition of income groups may change
from one edition of World Development Indicators to the
next. Once the classification is fixed for an edition, based
on GNI per capita in the most recent year for which data
are available (2012 in this edition), all historical data presented are based on the same country grouping.
Low-income economies are those with a GNI per capita
of $1,035 or less in 2012. Middle-income economies are
those with a GNI per capita of more than $1,035 but less
than $12,616. Lower middle-income and upper middleincome economies are separated at a GNI per capita of
$4,085. High-income economies are those with a GNI per
capita of $12,616 or more. The 18 participating member
countries of the euro area are presented as a subgroup
under high-income economies.
Economy 4
Gross domestic product
Gross
savings
Adjusted
net savings
Current
account
balance
% of GNI
% of GDP
2012
2012
Central
Central
Consumer
government government price index
cash surplus
debt
or deficit
Broad
money
average annual % growth
2000–12
Estimate
Forecast
% of GDP
2012–13
2013–14
2012
% of GDP
% of GDP
% growth
% of GDP
2012
2012
2012
2012
..
3.9
31.5
..
4.5
49.4
..
1.3
39.0
–4.7
..
3.4
80.7
..
..
..
..
..
..
..
..
3.9c
–6.9
–6.3
113.3
2.4
..
Congo, Rep.
4.6
5.6
5.4
..
..
..
..
Costa Rica
4.7
3.4
4.3
15.9
15.1
–5.3
–3.5
Côte d’Ivoire
1.2
8.7
8.2
..
..
2.0
–3.1
Croatia
2.1
..
..
18.9
9.3
–0.3
Cuba
5.8
..
..
..
..
..
..
..
..
..
Curacao
8.8c
..
..
Cyprusb
2.6c
..
..
Czech Republic
3.3
..
..
21.0
5.1
–2.4
–4.4
38.3
3.3
77.3
74.6
Denmark
0.6
..
..
23.6
15.7
5.9
–2.0
50.6
2.4
Djibouti
3.5
..
..
..
..
..
..
..
3.7
Dominica
3.2
1.1
1.7
10.8
..
–11.5
–11.9
..
1.4
97.4
Dominican Republic
5.6
2.5
3.9
9.2
..
–6.8
–2.9
..
3.7
34.3
6.1
Ecuador
Egypt, Arab Rep.
El Salvador
Equatorial Guinea
Eritrea
Estoniab
4.4
4.0
4.1
26.9
–0.2
..
4.9
1.8
2.3
13.0
0.0
–2.7
–10.6
..
7.1
74.1
2.0
1.9
2.3
8.9
6.6
–5.3
–2.2
47.8
1.7
44.6
10.9
..
..
..
..
..
..
..
6.1
18.7
6.0
3.5
..
..
..
..
..
..
114.7
–1.8
0.9
3.7
5.1
31.6
..
25.0
12.5
1.0
6.9
3.9
7.2
28.8
6.1
–7.2
–1.4
..
22.8
..
..
..
..
..
..
..
..
..
..
Fiji
1.2
2.4
2.1
..
..
–1.4
..
..
3.4
68.8
Finlandb
1.7
..
..
18.1
7.6
–1.5
–0.5
48.0
2.8
..
93.7
2.0
Ethiopia
8.9
Faeroe Islands
Franceb
1.1
French Polynesia
Gabon
..
..
..
7.0
..
59.6
..
..
17.5
9.9
–2.2
–5.1
..
..
..
..
..
..
..
..
..
..
2.4
4.2
4.2
..
..
..
..
..
2.7
20.8
..
6.4
..
..
4.3
53.6
–11.7
–0.5
32.6
–0.9
30.2
15.8
7.0
–0.4
55.3
2.0
..
21.5
2.7
–11.7
–3.9
..
9.2
31.3
9.8
–4.3
–2.5
–9.8
106.5
1.5
Gambia, The
3.4
6.5
7.5
17.1
Georgia
6.5d
2.5d
6.3d
18.3d
Germany b
1.1
..
..
24.2
Ghana
6.6
7.4
7.4
Greeceb
1.1
..
..
0.9
7.0 d
..
Greenland
1.7
..
..
..
..
..
..
..
..
..
Grenada
1.9
1.1
1.1
–10.2
..
–28.0
–5.8
..
2.4
95.4
..
..
..
..
..
..
..
..
..
..
3.5
3.3
3.4
12.0
–2.3
–2.6
–2.3
–42.8
Guam
24.4
3.8
Guinea
2.6
4.0
–18.4
..
..
15.2
36.4
Guinea-Bissau
Guatemala
2.3
3.0
2.7
1.5
–22.4
–8.5
..
..
2.1
38.8
Guyana
1.7
4.4
3.9
11.1
–11.8
–13.9
..
..
2.4
67.0
Haiti
0.8
3.4
4.2
25.6
12.7
–4.4
..
..
6.3
45.8
Honduras
4.3
2.9
3.4
16.5
11.4
–8.6
–3.2
..
5.2
51.0
Hungary
1.6
0.7
1.7
23.4
12.4
0.9
3.7
82.4
5.7
60.9
119.1
5.2
89.8
4.7
–6.2
46.2
..
..
9.3
..
–5.5
–5.3
4.8
6.2
30.3
14.8
–4.9
–3.8
49.7
9.3
75.6
Indonesia
5.5
5.6
5.3
32.0
24.1
–2.7
–1.1
26.2
4.3
40.1
Iran, Islamic Rep.
4.8
–1.5
1.0
..
..
..
..
..
27.3
19.7
Iraq
5.1
4.2
6.5
26.7
..
13.7
..
..
5.8
30.7
Irelandb
2.2
..
..
16.0
10.9
4.4
–13.0
102.0
1.7
..
Isle of Man
6.2
..
..
..
..
..
..
..
..
..
Iceland
2.4
India
7.7
Economy
States and markets
Global links
Back
World Development Indicators 2014
Statistics
61
Additional information about the data is provided in Primary data documentation, which summarizes national and
international efforts to improve basic data collection and
gives country-level information on primary sources, census
years, fiscal years, statistical methods and concepts used,
and other background information. Statistical methods provides technical information on some of the general calculations and formulas used throughout the book.
Symbols
Country notes
..
• Cabo Verde is the new name for the country previously
listed as Cape Verde.
• Data for China do not include data for Hong Kong SAR,
China; Macao SAR, China; or Taiwan, China.
• Data for Serbia do not include data for Kosovo or
Montenegro.
• Data for Sudan include South Sudan unless otherwise
noted.
means that data are not available or that aggregates
cannot be calculated because of missing data in the
years shown.
0 or means zero or small enough that the number would
0.0 round to zero at the displayed number of decimal places.
/
in dates, as in 2011/12, means that the period of
time, usually 12 months, straddles two calendar years
and refers to a crop year, a survey year, or a fiscal year.
$
means current U.S. dollars unless otherwise noted.
<
means less than.
Economy
States and markets
Global links
Back
World Development Indicators 2014
xiii
User guide to WDI online tables
Statistical tables that were previously available in the
World Development Indicators print edition are available
online. Using an automated query process, these reference tables are consistently updated based on revisions to
the World Development Indicators database.
How to access WDI online tables
To access the WDI online tables, visit http://wdi.worldbank
.org/tables. To access a specific WDI online table directly,
xiv
World Development Indicators 2014
Front
?
User guide
use the URL http://wdi.worldbank.org/table/ and the
table number (for example, http://wdi.worldbank.org
/table/1.1 to view the fi rst table in the World view section). Each section of this book also lists the indicators
included by table and by code. To view a specifi c indicator online, use the URL http://data.worldbank.org
/indicator/ and the indicator code (for example, http://data
.worldbank.org/indicator/SP.POP.TOTL to view a page for
total population).
World view
People
Environment
Breadcrumbs to show
where you’ve been
Click on an indicator
to view metadata
Click on a country
to view metadata
How to use DataBank
Actions
DataBank (http://databank.worldbank.org) is a web
resource that provides simple and quick access to collections of time series data. It has advanced functions
for selecting and displaying data, performing customized
queries, downloading data, and creating charts and maps.
Users can create dynamic custom reports based on their
selection of countries, indicators, and years. All these
reports can be easily edited, saved, shared, and embedded as widgets on websites or blogs. For more information,
see http://databank.worldbank.org/help.
Click to edit and revise the table in
DataBank
Click to download corresponding indicator
metadata
Click to export the table to Excel
Click to export the table and corresponding
indicator metadata to PDF
Click to print the table and corresponding
indicator metadata
Click to access the WDI Online Tables Help
file
Click the checkbox to highlight cell level
metadata and values from years other
than those specified; click the checkbox
again to reset to the default display
Economy
States and markets
Global links
Back
World Development Indicators 2014
xv
User guide to DataFinder
xvi
DataFinder is a free mobile app that accesses the full
set of data from the World Development Indicators database. Data can be displayed and saved in a table, chart,
or map and shared via email, Facebook, and Twitter.
DataFinder works on mobile devices (smartphone or
tablet computer) in both offline (no Internet connection)
and online (Wi-Fi or 3G/4G connection to the Internet)
modes.
•
•
•
•
• View reports in table, chart, and map formats.
• Send the data as a CSV file attachment to an email.
• Share comments and screenshots via Facebook,
Twitter, or email.
Select a topic to display all related indicators.
Compare data for multiple countries.
Select predefined queries.
Create a new query that can be saved and edited later.
World Development Indicators 2014
Front
?
User guide
World view
People
Environment


