Kobe University Repository : Thesis
学位論文題目
Title
Usefulness of the Six-minute Walk Test as a Screening Test for
Pulmonary Arterial Enlargemant in COPD(COPD患者の肺動脈拡張ス
クリーニングテストとしての6分間歩行試験の有用性)
氏名
Author
Oki, Yutaro
専攻分野
Degree
博士(保健学)
学位授与の日付
Date of Degree
2017-03-25
公開日
Date of Publication
2018-03-01
資源タイプ
Resource Type
Thesis or Dissertation / 学位論文
報告番号
Report Number
甲第6907号
権利
Rights
JaLCDOI
URL
http://www.lib.kobe-u.ac.jp/handle_kernel/D1006907
※当コンテンツは神戸大学の学術成果です。無断複製・不正使用等を禁じます。著作権法で認められている範囲内で、適切にご利用ください。
Create Date: 2018-09-19
博士論文
Usefulness of the Six-minute Walk Test as a Screening Test for
Pulmonary Arterial Enlargement in COPD
(COPD 患者の肺動脈拡張スクリーニングテストとしての 6 分間歩行試験の有用性)
平成 29 年 1 月 18 日
神戸大学大学院保健学研究科保健学専攻
沖
侑大郎
Usefulness of the Six-minute Walk Test as a Screening Test for
Pulmonary Arterial Enlargement in COPD
Yutaro Oki1, 2, Masahiro Kaneko3, Yukari Fujimoto1, Hideki Sakai2, Shogo Misu1,2,
Yuji Mitani1,4, Takumi Yamaguchi1, 2, Hisafumi Yasuda1, Akira Ishikawa1
1
Department of Community Health Sciences, Kobe University Graduate School of Health Sciences,
2
Department of Rehabilitation, Kobe City Medical Center West Hospital, Kobe,
3
Department of Respiratory Medicine, Kobe City Medical Center West Hospital, Kobe,
4
Department of Rehabilitation, Sapporo Nishimaruyama Hospital, Sapporo, Japan
Keywords:
Six-min walk test, chronic obstructive pulmonary disease, exercise-induced oxygen desaturation,
pulmonary artery
Paper published in International Journal of COPD 2016;11:2869-2875.
6MWT as a Screening Test for PAE in COPD
Abstract:
Purpose: Pulmonary hypertension and exercise-induced oxygen desaturation (EID) influence
acute exacerbation of chronic obstructive pulmonary disease (COPD). Computed tomography
(CT)-detected pulmonary artery (PA) enlargement is independently associated with acute COPD
exacerbations. Associations between PA to aorta (PA:A) ratio and EID in patients with COPD
have not been reported. We hypothesised that the PA:A ratio correlated with EID and results of
the 6-min walk test (6MWT) would be useful for predicting the risk associated with PA:A > 1.
Patients and methods: We retrospectively measured lung function, 6MWT, emphysema area,
and PA enlargement on CT in 64 patients with COPD. The patients were classified into groups
with PA:A ratio ≤ 1 and > 1. Receiver-operating characteristic (ROC) curves were used to
determine the threshold values with the best cutoff points to predict patients with PA:A > 1.
Results: The PA:A > 1 group had lower forced expiratory volume in 1 second (FEV1), forced
vital capacity (FVC), FEV1:FVC ratio, diffusion capacity of lung carbon monoxide (DLCO), 6min walk distance (6MWD) and baseline peripheral oxygen saturation (SpO2), lowest SpO2,
highest modified Borg Scale results, percentage low-attenuation are (LAA%), and history of
acute COPD exacerbations ≤ 1 year and worse BODE (Body mass index, airflow Obstruction,
Dyspnea, and Exercise) index results (p < 0.05). Predicted PA:A >1 was determined for SpO2
during 6MWT (best cutoff point: 89%, area under the curve [AUC] 0.94, 95% confidence
interval 0.88–1). SpO2 < 90% during 6MWT showed a sensitivity of 93.1, specificity of 94.3,
positive predictive values of 93.1, negative predictive values of 94.3, positive likelihood ratios of
16.2, and negative likelihood ratios of 0.07.
Conclusion: Lowest SpO2 during 6MWT may predict CT-measured PA:A ratios, and lowest
SpO2 <89% during 6MWT is excellent for detecting pulmonary hypertension in COPD.
1
6MWT as a Screening Test for PAE in COPD
Introduction
Exacerbations of chronic obstructive pulmonary disease (COPD) are associated with accelerated
loss of lung function, poor quality of life and mortality.1,2 These events can be predicted by
numerous clinical factors, including prior exacerbations, airflow obstruction, symptom burden,
gastroesophageal reflux, and leukocytosis.3 It is important to detect COPD exacerbations early
and minimise their severity.
Patients with COPD frequently experience significant decreases in oxygen saturation during
exercise attributed to the imbalance between oxygen delivery and exercise-induced demand.4
Exercise-induced oxygen desaturation (EID) is reported to be associated with hospitalisation and
mortality in patients with COPD.5 The 6-min walking test (6MWT) has been suggested as the
preferred measure to identify patients with COPD and EID.6 EID occurs frequently during
6MWT in patients with COPD.7 EID has been related to forced expiratory volume in 1 s (FEV1),
diffusion capacity of lung carbon monoxide (DLCO), amount of emphysema and baseline oxygen
saturation.8–10
Pulmonary hypertension (PH) is an important factor contributing to acute exacerbation of
COPD.11 PH appears when airflow limitation is severe, and is associated with chronic hypoxemia.
Pulmonary vascular remodelling in COPD is the main cause of increased pulmonary artery (PA)
pressure, and is thought to result from the combined effects of hypoxia, inflammation and
capillary loss in severe emphysema.12 The presence of PH has been shown to increase the
hospitalisation rate and mortality of patients with COPD.13,14 Computed tomography (CT)detected PA enlargement is independently associated with acute exacerbations of COPD.15 The
PA-to-aorta (PA:A) ratio measured by CT scan outperforms echocardiography for diagnosing
resting PH in patients with severe COPD.16 A PA:A >1 indicates lower oxygen saturation at rest
2
6MWT as a Screening Test for PAE in COPD
than a PA:A <1.15 However, there are no reports on the association between PA:A and EID in
patients with COPD.
We hypothesised that the PA:A correlates with the presence of EID and that 6MWT results are
useful for predicting the risk of having a PA:A >1. The present study aimed to examine the
relationship between PA:A and EID and develop a simple screening tool by determining the
appropriate cut-off score on 6MWT to predict a PA:A >1 in patients with COPD.
Patients and methods
Study design and patient selection
This study analysed regularly treated outpatients with COPD between 2014 and 2015 at the Kobe
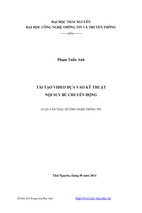
City Medical Center West Hospital. A total of 64 patients with COPD were included after
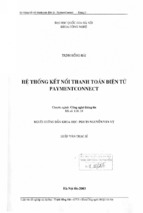
applying the exclusion criteria in this study (Figure 1). The criteria for diagnosing COPD were a
smoking history (≥20 pack-years) and post-bronchodilator FEV1/forced vital capacity (FVC) <
70%. Furthermore, we used the following inclusion criteria to define COPD clinically, all of
which had to be fulfilled: symptoms, including cough, sputum production, wheezing, dyspnea, a
smoking history (≥20 pack-years), existence of emphysema on chest CT, and a physician
diagnosis of COPD.17–21 Study-exclusion criteria were as follows: history of lung surgical
procedures, exacerbation-related hospitalization 3 months before 6MWT, and patients on longterm oxygen therapy. This study was approved by the ethics committee of Kobe University
(N287). All the participants provided written or oral informed consent.
3
6MWT as a Screening Test for PAE in COPD
Figure 1 Patients flow diagram
Abbreviations: PA, pulmonary artery; A, aorta.
Clinical Characterisation
Assessments
A chest physician performed the physical examination for all outpatients. This examination
included an assessment of body weight, height, and medical history (eg, pulmonary embolism
and sleep apnea syndrome), GOLD (Global Initiative for Obstructive Lung Disease) grade 0–4,
history of acute exacerbations of COPD within the previous year, COPD Assessment Test (CAT),
level of dyspnea (using the modified Medical Research Council [mMRC] dyspnoea scale), postbronchodilator spirometry, DLCO, 6MWT (according to international recommendations),
emphysema area, and PA enlargement on CT. Body mass index (BMI) was calculated as weight
in kilograms divided by height in meters squared. GOLD 0 was defined as current and former
smokers with a normal post-bronchodilator ratio of FEV1: FVC exceeding 0.7 and an FEV1 of at
least 80%, symptoms, including cough, sputum production, wheezing and dyspnea, smoking
4
6MWT as a Screening Test for PAE in COPD
history (≥20 pack-years), existence of emphysema on chest CT, and a physician diagnosis of
COPD.17–21
Six-minute walk test
The 6MWT was performed according to the 2002 American Thoracic Society guidelines.22
Participants were asked to walk indoors on a flat, round, 25 m walking course supervised by a
physician and physical therapist. A practice 6MWT was not undertaken. Subjects were
encouraged using standard methodology every minute of the 6MWT. A pulse oximeter (WristOx
3150; Nonin Medical, Plymouth, MN, USA) with a finger probe measured peripheral oxygen
saturation (SpO2) during 6MWT, and 6MWT-analysis software (WristOx 2; Star Product, Tokyo,
Japan) was used. In addition, a modified Borg scale was used to quantify the levels of dyspnea
perceived by subjects at each minute during 6MWT. EID was defined as a nadir SpO2 <90%,
SpO2 ≤88% and ΔSpO2 ≥4%.23–25
Measuring the PA:A ratio
One reviewer, blinded to hemodynamic information, analysed CT scans (Optima CT 660
Discovery; GE Healthcare, Little Chalfont, UK). Measurements of the diameter of the main PA
and the diameter of the aorta (A) at the level of the bifurcation were used to calculate the PA:A
ratio, as previously reported.14–16 In cases where the aorta was not uniform in diameter, two
measurements were taken 90° apart and the larger diameter used. PA was measured on the line
that joins the origin of the left PA and the centre of the adjacent ascending aorta on the axial
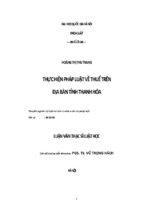
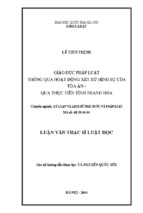
section at the level of PA bifurcation.26 CT-measured relative PA enlargement was defined as
PA:A >1 (Figure 2).14–16
5
6MWT as a Screening Test for PAE in COPD
(a)
(b)
Figure 2. Measurement of the PA and A diameters at the PA bifurcation.
Notes: (A) PA:A ≤1, (B) PA:A >1. The κ-values for intraobserver and interobserver agreements for detecting PA:A >1 were 0.87 (95% confidence interval 0.74–
0.99) and 0.75 (95% confidence interval 0.58–0.91), respectively.
Abbreviations: PA, pulmonary artery; A, aorta.
Statistical Analysis
Results are expressed as counts or median (interquartile range). Data are presented as means and
standard deviations or as proportions, as appropriate. Cohen’s κ-coefficient measured
intraobserver and interobserver agreements for CT measurements of the PA:A ratio. Bivariate
analyses were performed with the use of a Pearson’s χ2 test for categorical data and Mann–
Whitney U-test for continuous data when appropriate. The Spearman’s rank-correlation
coefficient was determined for relationships between the PA:A ratio, lung function parameters,
6MWT parameters, and CT parameters. Receiver operating characteristic (ROC) curves were
used to determine the threshold values with the best sensitivity and specificity to predict PA:A >
1, with the best being defined as the point on the ROC curve with the shortest distance from the
upper-left corner. Sensitivity, specificity, positive/negative predictive value (PPV/NPV), and
positive/negative likelihood were calculated for lung-function parameters and 6MWT parameters
of exacerbation-risk factors on the basis of a previous study.6,27,28
6
6MWT as a Screening Test for PAE in COPD
All statistical analyses were performed with EZR (Saitama Medical Center, Jichi Medical
University, Saitama, Japan), which is a graphical user interface for the R project (R Foundation
for Statistical Computing, Vienna, Austria).29 More precisely, it is a modified version of R
Commander designed to add statistical functions frequently used in biostatistics, and P-values
<0.05 were considered statistically significant.
Results
The current analysis comprised 64 patients who were separated into groups on the basis of PA:A
>1 (n = 29) and ≤1 (n = 35). Participants had a mean age of 73 (68–79) years. Fifty were male
(78.1%) and 14 were female (21.9%). The κ-values for intraobserver and interobserver
agreements for detecting PA:A >1 were 0.87 (95% confidence interval [CI] 0.74–0.99) and 0.75
(95% CI 0.58–0.91), respectively.
Differences in the PA:A ratio between both groups were driven by the diameter of PA (2.9
[2.7–3.3] cm in PA:A ≤ 1 vs. 3.7 [3.5–3.9] cm in PA:A >1, P= 0.002), because no differences
were detected in the diameter of aortae (3.7 [3.4–3.9] cm vs. 3.5 [3.3–3.7] cm, P= 0.20). There
were no significant differences between the two groups with regard to age, sex, BMI, pack-years,
mMRC dyspnea scale, GOLD, COPD assessment test, baseline pulse rate, baseline modified
Borg Scale (P> 0.05). On the other hand, there were significant differences between the two
groups with regard to FEV1 (71.6% [60.5%–80.8%] vs. 52.6% [39.6%–72.1%], P= 0.013), FVC
(82.3% [50.3%–93.6%] vs. 75.8% [42.7%–86.0%], P= 0.04), FEV1:FVC ratio (68% [61%–
73.3%] vs. 53.8% [48.8%–69.4%], P= 0.023), %DLCO (72.5% [55.5%–82.9%] vs. 44.6%
[37.7%–49.6%], P= 0.005), BODE (BMI, obstruction [airflow], dyspnea, and exercise
performance) index (2 [1–3] vs. 4 [2–5], P< 0.001), 6-min walking distance (6MWD; 450 m
7
6MWT as a Screening Test for PAE in COPD
[400–510.5] vs. 325 m [238–466], P< 0.001), baseline SpO2 (97% [95%–97.5%] vs. 95% [93%–
96%], P= 0.001), lowest SpO2 (92% [91%–94%] vs. 86% [84%–88%], P< 0.001), highest
modified Borg Scale result (2 [0–5] vs. 5 [2–5], P= 0.04), low-attenuation area (LAA; 6.8%
[2.8%–14.7%] vs. 25.4% [11.3%–33.4%], P< 0.001), and history of acute exacerbations of
COPD within the previous year (1 [2.9%] vs. 7 [24.1%], P= 0.019) (Table 1).
The PA:A ratio demonstrated a significant linear correlation with lowest SpO2 (r= −0.68, r2=
0.46; P< 0.001), %DLCO (r= −0.61, r2= 0.37; P< 0.001), 6MWD (r= −0.43, r2= 0.18; P< 0.001),
BODE index (r= 0.41, r2= 0.17; P< 0.001), baseline SpO2 (r= −0.36, r2= 0.13; P= 0.003), LAA%
(r= 0.36, r2= 0.13; P= 0.004), FVC (r= −0.34, r2= 0.12; P= 0.006), FEV1 (r= −0.29, r2= 0.08; P=
0.019) and highest pulse rate (r= 0.26, r2= 0.07; P= 0.035) (Table 2).
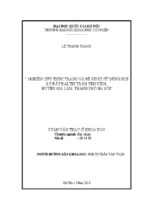
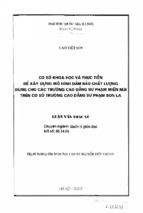
Using ROC curves, the threshold values with the best cutoff point, sensitivity, and specificity
to predict PA:A >1 were determined for SpO2 during 6MWT (best cutoff points 89%, area under
curve [AUC] 0.94, 95%CI 0.88–1), DLCO (best cutoff points 51%, AUC 0.87, 95%CI 0.78–0.96),
6MWD (best cutoff points 388m, AUC 0.75, 95%CI 0.62–0.87), BODE index (best cutoff points
4, AUC 0.74, 95%CI 0.61–0.87) (Table 3, Figure 3). The performance data on the 6MWT and
lung function for predicting PA enlargement are depicted in Table 4. SpO2 < 90%, SpO2 ≤ 88%,
and ΔSpO2 ≥4% during 6MWT were 94.3 (80.8–99.3), 97.1 (85.1–99.9), and 45.7 (28.8–63.4),
respectively, for specificity, 93.1 (77.2–99.2), 95.8 (78.9–99.9) and 59.6 (44.3–73.6), respectively,
for positive predictive value, and 16.2 (4.2–62.8), 27.7 (4–193.3), and 1.8 (1.3–2.4), respectively,
for positive likelihood ratios.
8
6MWT as a Screening Test for PAE in COPD
Table 1 General characteristics of the patients with PA:A ≤1 and PA:A >1
Variable
PA:A ≤1 (n=35)
PA:A >1 (n=29)
P-value
Age (years)
71 (66.5–76.5)
78 (70–79)
0.06b
Male sex (%)
28 (80)
22 (75.9)
0.76a
Body mass index (kg/m2)
21.1 (19.5–23.4)
22.4 (20.4–24.7)
0.33b
Smoking history (pack-years)
40 (26.8–60)
40 (35–50)
0.49b
PE
0
1 (3.4%)
0.45a
SAS
1 (2.8%)
0
1a
GOLD (0/1/2/3/4)
14/3/13/4/1
7/2/8/11/1
0.14a
mMRC (0/1/2/3/4)
1/7/22/5/0
0/2/21/5/1
0.36a
COPD Assessment Test (points)
15 (8–22)
14 (11.5–22)
0.62b
BODEindex (points)
2 (1–3)
4 (2–5)
<0.001b
FEV1 (% of predicted value)
71.6 (60.5–80.8)
52.6 (39.6–72.1)
0.013b
FVC (% of predicted value)
82.3 (50.3–93.6)
75.8 (42.7–86)
0.04b
FEV1:FVC ratio
68 (61–73.3)
53.8 (48.8–69.4)
0.023b
DLCO (% of predicted value)
72.5 (55.5–82.9)
44.6 (37.7–49.6)
0.005b
RV/TLC (%)
43.7 (37.4–48.6)
48.8 (39.8–53.8)
0.12b
LAA (%)
6.8 (2.8–14.7)
25.4 (11.3–33.4)
<0.001b
Admission for exacerbation
1 (2.9)
7 (24.1)
0.019a
6MWD (m)
450 (400–510.5)
325 (238–446)
<0.001b
Baseline SpO2 (%)
97 (95–97.5)
95 (93–96)
0.001b
Lowest SpO2 (%)
92 (91–94)
86 (84–88)
<0.001b
Baseline PR (bpm)
74 (69.5–81.5)
77 (70–88)
0.28b
Highest PR (bpm)
108 (98–115.5)
112 (108–120)
0.014b
Baseline modified Borg Scale
0 (0–0)
0 (0–0.5)
0.1b
Highest modified Borg Scale
2 (0–5)
5 (2–5)
0.04b
Diameter of aorta (cm)
3.7 (3.4–3.9)
3.5 (3.3–3.7)
0.2b
Diameter of pulmonary artery (cm)
2.9 (2.7–3.3)
3.7 (3.5–3.9)
0.002b
Notes: Data presented as counts (%) or median (interquartile range). P-values calculated by aPearson’s χ2 test (categorical) and bMann–Whitney U-test (continuous).
Abbreviations: PA, pulmonary artery; A, aorta; PE, pulmonary embolism; SAS, sleep apnoea syndrome; GOLD, Global Initiative for Obstructive Lung Disease;
mMRC, modified Medical Research Council; CAT, COPD Assessment Test; BODE, body mass index, airflow obstruction, dyspnoea and exercise; FEV1, forced
expiratory volume in 1 second; FVC, forced vital capacity; DLCO, diffusion capacity of lung carbon monoxide; RV/TLC, residual volume/total lung capacity; LAA%,
the percentage of the lung field occupied by low attenuation areas; 6MWD, 6-minute walking distance; Baseline SpO2, resting SpO2 before 6MWT; Lowest SpO2,
nadir SpO2 during the 6MWT; Baseline PR, resting pulse rate before 6MWT; highest PR, Highest value of pulse rate during 6MWT; Baseline modified Borg Scale,
resting modified Borg Scale before 6MWT; Highest modified Borg Scale, highest value of modified Borg Scale during 6MWT
9
6MWT as a Screening Test for PAE in COPD
Table 2 Linear relationships between PA:A ratio, lung function, and index of 6MWT
Variable
r
r2
P-valuea
Lowest SpO2 (%)
-0.68
0.46
<0.001
DLCO (% of predicted value)
-0.61
0.37
<0.001
6MWD (m)
-0.43
0.18
<0.001
BODE index
0.41
0.17
<0.001
Baseline SpO2 (%)
-0.36
0.13
0.003
LAA (%)
0.36
0.13
0.004
FVC (% of predicted value)
-0.34
0.12
0.006
FEV1 (% of predicted value)
-0.29
0.08
0.019
Highest PR (bpm)
0.26
0.07
0.035
Notes: aP-value calculated by Spearman’s rank-correlation coefficient.
Abbreviations: PA, pulmonary artery; A, aorta; 6MWT, 6-minute walking test; Lowest SpO2, nadir SpO2 during the 6MWT; DLCO, diffusion capacity of the
lung carbon monoxide; 6MWD, 6-min walking distance; BODE index, body mass index, obstruction (airflow), dyspnoea and exercise; Baseline SpO2, resting SpO2
before 6MWT; LAA, low-attenuation areas; FVC, forced vital capacity; FEV1, forced expiratory volume in 1 s; Highest PR, highest value of pulse rate during 6MWT
Table 3 Cut off points and ROC-curve parameters for the prediction of PA:A ratio > 1
Variable
Lowest SpO2 (%)
Best cutoff
89
AUC (95% CI)
0.94 (0.88–1)
Sensitivity
86.2
Specificity
93.1
DLCO (%)
51
0.87 (0.78–0.96)
79.3
85.7
6MWD (m)
388
0.75 (0.62–0.87)
69
80
BODE index (points)
4
0.74 (0.61–0.87)
58.6
85.7
Abbreviations: ROC, receiver-operating characteristic; PA, pulmonary artery; A, aorta; AUC, area under the curve; Lowest SpO2, nadir SpO2 during the 6MWT;
DLCO, diffusion capacity of lung carbon monoxide; 6MWD, 6-minute walking distance; BODE index, body mass index, obstruction (airflow), dyspnoea and exercise;
CI, confidence interval.
Figure 3 Receiver operator characteristic curve with lowest SpO 2 during 6MWT identifying PA:A ratio > 1
Abbreviations: lowest SpO2, nadir SpO2 during the 6MWT; 6MWT, 6-min walking test; PA, pulmonary artery; A, aorta; AUC, area under the curve.
10
6MWT as a Screening Test for PAE in COPD
Table 4 The performance data of 6MWT and lung function for PA:A ratio > 1
Variable
Sensitivity
(95% CI)
Specificity
(95% CI)
PPV
(95% CI)
NPV
(95% CI)
+LR
(95% CI)
-LR
(95% CI)
SpO2 <90%
93.1 (77.2–99.2)
94.3 (80.8-99.3)
93.1 (77.2-99.2)
94.3 (80.8-99.3)
16.2 (4.2-62.8)
0.07 (0.02-0.28)
SpO2 ≤88%
79.3 (60.3-92)
97.1 (85.1-99.9)
95.8 (78.9–99.9)
85 (70.2–94.3)
27.7(4–193.3)
0.21(0.1–0.44)
ΔSpO2 ≥4%
96.6 (82.0–99.9)
45.7 (28.8–63.4)
59.6 (44.3–73.6)
94.1 (71.3–99.9)
1.8 (1.3–2.4)
0.08 (0.01–0.54)
Baseline SpO2 ≤95%
58.6 (38.9–76.5)
71.4 (53.7–85.4)
63.0 (42.4–80.6)
67.6 (50.2–82.0)
2.1 (1.1–3.8)
0.58 (0.36–0.94)
6MWD <350 m
58.6 (38.9–76.5)
82.9 (66.4–93.4)
73.9 (51.6–89.8)
70.7 (54.5–83.9)
3.4 (1.6–7.5)
0.50 (0.32–0.80)
SpO2 <90% and 6MWD <350m
51.7 (32.5–70.6)
97.1 (85.1–99.9)
93.8 (69.8–99.8)
70.8 (55.9–83.0)
18.1 (2.5–128.9)
0.50 (0.34–0.73)
SpO2 ≤88% and 6MWD <350m
51.7 (32.5–70.6)
100 (85.5–100)
100 (69.8–100)
71.4 (56.7–83.4)
-
0.48 (0.33–0.70)
ΔSpO2 ≥4% and 6MWD <350m
55.2 (35.7–73.6)
91.4 (76.9–98.2)
84.2 (60.4–96.6)
71.1 (55.7–83.6)
6.4 (2.1–19.9)
0.49 (0.32–0.74)
FEV1 <80%
79.3 (60.3–92.0)
31.4 (16.9–49.3)
48.9 (34.1–63.9)
64.7 (38.3–85.8)
1.2 (0.9–1.5)
0.65 (0.28–1.56)
FEV1 <50%
44.8 (26.4–64.3)
85.7 (69.7–95.2)
72.2 (46.5–90.3)
65.2 (49.8–78.6)
3.1 (1.3–7.8)
0.64 (0.45–0.92)
DLCO <50%
75.9 (56.5–89.7)
85.7 (69.7–95.2)
81.5 (61.9–93.7)
81.1 (64.8–92.0)
5.3 (2.3–12.3)
0.28 (0.15–0.54)
Abbreviations: PPV, positive predictive values; NPV, negative predictive values; +LR, positive likelihood; −LR, negative likelihood; 6MWT, 6-min walking test; Baseline
SpO2, resting SpO2 before 6MWT; 6MWD, 6-min walking distance; FEV1, forced expiratory volume in 1 s; DLCO, diffusion capacity of the lung carbon monoxide
Discussion
We were able to reveal three main findings in the present study. First, we found a strong
association between PA:A ratio and lowest SpO2 during 6MWT. For this reason, a consistent
finding in patients with COPD is the close relationship between severity of hypoxemia and PA
pressure or pulmonary vascular resistance, supporting a major role for alveolar hypoxia.30
Alveolar hypoxia causes constriction of the resistance PAs, and sustained alveolar hypoxia
induces pulmonary vascular remodelling.28 Pathological studies of lung specimens from patients
with COPD have shown extensive pulmonary vascular remodelling with prominent intimal
thickening and medial hypertrophy. For this reason, chronic alveolar hypoxia plays an important
role in pulmonary vascular remodelling.28 In a previous study, patients with PA:A >1 showed
lower resting SpO2, higher usage rates of supplemental oxygen, and an indirect association with
EID.15 In the present study, the lowest SpO2 during 6MWT to predict PA:A > 1 was considered
to be a beneficial result based on the ROC curves. Lowest SpO2 < 89% during the 6MWT is
excellent in the detection of PH. These results suggest that the lowest SpO2 during 6MWT is a
11
6MWT as a Screening Test for PAE in COPD
very helpful measure and screening test for PA:A ratio. For example, it might be possible to
easily screen for pulmonary artery expansion by means of the 6MWT in home-care situation,
where it would be difficult to perform CT imaging.
Second, with regard to the relationship between PA:A ratio and lung function, correlations
were observed among FEV1, DLCO, and LAA. One of the factors that may play a role in causing
PH to advance in patients with COPD is the destruction of lung parenchyma, leading to loss of
part of the pulmonary vascular bed,30,31 and the burden of airway remodelling influencing PApressure increase.28 A previous study included patients with airflow-obstruction severity greater
than moderate, and our study included mild airflow obstruction and smokers with normal
spirometry.15 Therefore, regardless of the severity of airflow-obstruction, PA enlargement may be
progressing. Undiagnosed COPD is a problem worldwide.18 GOLD 0 has been reported to be an
exacerbation risk; therefore,18 early detection and not just spirometry evaluation is important
from multiple perspectives.18,32 From the viewpoint of early detection of PA enlargement, a
definition of EID as SpO2 <90% may be a good start.
Third, there are many causes for acute COPD exacerbations. However, these findings may
imply that PA:A >1 is one of the multiple risk factors for acute COPD exacerbations. One reason
for this is that PA:A is associated with PH16 and PH is also a risk factor for acute COPD
exacerbations.33 Furthermore, a previous study reported an association between the PA:A ratio
and acute COPD exacerbation.15 These results suggest that screening for the PA:A ratio without
CT using the 6MWT may indicate the risk for acute COPD exacerbations at an early stage.
12
6MWT as a Screening Test for PAE in COPD
Limitation
This study had some limitations, including small size, single-center experience, and retrospective
design. In addition, this study also included COPD subjects who did not fit the GOLD criteria.
Furthermore, because healthy controls do not have respiratory symptoms and there are no control
data for the measurement items pertaining to such individuals, healthy controls were not included
in the present study. However, it has been reported that the presence of clinical symptoms and
low DLCO in smokers, even with normal spirometry, increases the risk of progression to airflow
obstruction in COPD.17–20 Therefore, the present study’s results during the 6MWT could be
useful to screen for PH at an early COPD stage, even in GOLD 0 patients. Finally, according to a
previous study, left ventricular dysfunction causes PA enlargement. However, echocardiography
was not performed in all subjects, and this information could not be included because it was
unavailable from the medical history, although we observed clinically relevant associations
between CT-measured PA:A ratios and 6MWT results.
Conclusion
The current study’s findings suggest that there is a strong association between PA:A ratio and
lowest SpO2 during 6MWT. 6MWT is a simple, noninvasive, and reproducible measurement tool.
Lowest SpO2 during 6MWT is a very helpful measurement to predict PA:A ratio on CT, and
lowest SpO2 <89% during the 6MWT is excellent to screen for PH in COPD.
13
6MWT as a Screening Test for PAE in COPD
Acknowledgments
The authors would like to thank Kentaro Iwata, Kazuki Takahashi, Shigefumi Murakami, Yu
Watanabe, Yoji Yamada, Yusuke Iwata, Takuya Sawada, Kanji Yamada, Kaoru Hanaie, Ken
Umehara and Kana Michiue of Department of Community Health Sciences, Kobe University
Graduate School of Health Sciences for constructive comments on the manuscript. We also thank
Enago (Tokyo, Japan) for the English-language review.
Author contributions
YO was involved in the conception, hypothesis, outline and design of the study, data acquisition,
analysis, and interpretation, drafting the article, and its revision prior to submission. MK, YF, and
HY were involved in the conception, hypothesis, outline, and design of the study, data
acquisition, and revision of the article prior to submission. AI was involved in the conception,
hypothesis, outline, and design of the study, data acquisition and analysis, drafting the article,
and its revision prior to submission. All authors contributed toward data analysis, drafting and
critically revising the paper, gave final approval of the version to be published, and agree to be
accountable for all aspects of the work.
Disclosure
The authors report no conflicts of interest in this work.
14
6MWT as a Screening Test for PAE in COPD
References
1. Vestbo J, Hurd SS, Agustí AG, et al. Global strategy for the diagnosis, management, and
prevention of chronic obstructive pulmonary disease: GOLD executive summary. Am J
Respir Crit Care Med. 2013;187:347-365.
2. Mannino DM, Buist AS. Global burden of COPD: risk factors, prevalence, and future
trends. Lancet.2007;370:765-773.
3. Hurst JR, Vestbo J, Anzueto A, et al. Susceptibility to exacerbation in chronic obstructive
pulmonary disease. N Engl J Med. 2010;363:1128-1138.
4. Stolz D, Boersma W, Blasi F, et al. Exertional hypoxemia in stable COPD is common
and predicted by circulating proadrenomedullin. Chest. 2014;146:328-338.
5. Andrianopoulos V, Wouters EF, Pinto-Plata VM, et al. Prognostic value of variables
derived from the six-minute walk test in patients with COPD: Results from the ECLIPSE
study. Respir Med. 2015;109:1138-1146.
6. Knower MT, Dunagan DP, Adair NE, et al. Baseline oxygen saturation predicts exercise
desaturation below prescription threshold in patients with chronic obstructive pulmonary
disease. Arch Intern Med. 2001;161:732-736.
7. S. Jenkins, N. Čečins. Six-minute walk test: observed adverse events and oxygen
desaturation in a large cohort of patients with chronic lung disease. Intern Med J.
2011;41:416-422.
8. Andrianopoulos V, Franssen FM, Peeters JP, et al. Exercise-induced oxygen desaturation
in COPD patients without resting hypoxemia. Respir Physiol Neurobiol. 2014;190:40-46.
9. van Gestel AJ, Clarenbach CF, Stöwhas AC, et al. Prevalence and prediction of exerciseinduced oxygen desaturation in patients with chronic obstructive pulmonary disease.
15
6MWT as a Screening Test for PAE in COPD
Respiration. 2012;84:353-359.
10. Kim C, Seo JB, Lee SM, et al. Exertional desaturation as a predictor of rapid lung
function decline in COPD. Respiration. 2013;86:109-116.
11. Kessler R, Faller M, Weitzenblum E, et al. “Natural history” of pulmonary hypertension
in a series of 131 patients with chronic obstructive lung disease. Am J Respir Crit Care
Med. 2001;164:219-224.
12. Chaouat A, Naeije R, Weitzenblum E. Pulmonary hypertension in COPD. Eur Respir J.
2008;32:1371-1385.
13. Barbera JA. Mechanisms of development of chronic obstructive pulmonary diseaseassociated pulmonary hypertension. Pulm Circ. 2013;3:160-164.
14. Wells JM, Dransfield MT. Pathophysiology and clinical implications of pulmonary
arterial enlargement in COPD. Int J Chron Obstruct Pulmon Dis. 2013;8:509-521.
15. Wells JM, Washko GR, Han MK, et al. Pulmonary arterial enlargement and acute
exacerbations of COPD. N Engl J Med. 2012;367:913-921.
16. Iyer AS, Wells JM, Vishin S, et al. CT scan-measured pulmonary artery to aorta ratio and
echocardiography for detecting pulmonary hypertension in severe COPD. Chest.
2014;145:824-832.
17. Paulin LM, Diette GB, Blanc PD, et al. Occupational exposures are associated with
worse morbidity in patients with chronic obstructive pulmonary disease. Am J Respir Crit
Care Med. 2015;191:557-565.
18. Regan EA, Lynch DA, Curran-Everett D, et al. Clinical and radiologic disease in smokers
with normal spirometry. JAMA Intern Med. 2015;175:1539-1549.
16
6MWT as a Screening Test for PAE in COPD
19. Harvey BG, Strulovici-Barel Y, Kaner RJ, et al. Risk of COPD with obstruction in active
smokers with normal spirometry and reduced diffusion capacity. Eur Respir J.
2015;46:1589-1597.
20. Lutchmedial SM, Creed WG, Moore AJ, et al. How common is airflow limitation in
patients with emphysema on CT scan of the chest? Chest. 2015;148:176-184.
21. Pellegrino R, Viegi G, Brusasco V, et al. Interpretative strategies for lung function tests.
Eur Respir J. 2005;26:948-968.
22. ATS Committee on Proficiency Standards for Clinical Pulmonary Function Laboratories.
ATS statement: guidelines for the six-minute walk test. Am J Respir Crit Care Med.
2002;166:111-117.
23. Golpe R, Pérez-de-Llano LA, Méndez-Marote L, et al. Prognostic value of walk distance,
work, oxygen saturation, and dyspnoea during 6-minute walk test in COPD patients.
Respir Care. 2013;58:1329-1334.
24. Casanova C, Cote C, Marin JM, et al. Distance and oxygen desaturation during the 6-min
walk test as predictors of long-term mortality in patients with COPD. Chest.
2008;134:746-752.
25. Stoller JK1, Panos RJ, Krachman S, et al. Oxygen therapy for patients with COPD:
current evidence and the long-term oxygen treatment trial. Chest. 2010;138:179-187.
26. Mahammedi A, Oshmyansky A, Hassoun PM, et al. Pulmonay artery measurements in
pulmonary hypertension: the role of computed tomography. J Thorac Imaging.
2013;28:96-103.
27. Spruit MA, Watkins ML, Edwards LD, et al. Determinants of poor 6-min walking
distance in patients with COPD: the ECLIPSE cohort. Respir Med. 2010;104:849-857.
17
- Xem thêm -