Tài liệu TN Dụng cụ Bán dẫn – Kit Elvis II
____________________________________________________________________________
SEMICONDUCTOR LAB.
Lesson 1: NI ELVIS II Workspace Environment
The NI ELVIS II environment consists of the following components:
Hardware workspace for building circuits and interfacing experiments
NI ELVIS II software (created in NI LabVIEW software), which includes
the following:
• Soft Front Panel (SFP) instruments
• LabVIEW Application Programmatic Interface (API)
• Multisim Application Programmatic Interface (API)
With the APIs, you can achieve custom control of and access to NI ELVIS II workstation
features using LabVIEW programs and simulation programs written within Multisim.
Figure 1-1. NI ELVIS II Workstation
1
Tài liệu TN Dụng cụ Bán dẫn – Kit Elvis II
____________________________________________________________________________
Goal
This lab introduces NI ELVIS II by showing how you can use the workstation to measure
electronic component properties. Then you can build circuits on the protoboard and later analyze
them with the NI ELVIS II suite of SFP instruments.
This lab also introduces the operation of themistor.
Required Soft Front Panels (SFPs)
• Digital Ohmmeter DMM[Ω],
• Digital Capacitance Meter DMM[╫ ]
• Digital Voltmeter DMM[V]
• Variable Power Supply (VPS)
Required Components
• 1.0 kΩ resistor, R1, (brown, black, red)
• 2.2 kΩ resistor, R2, (red, red, red)
• 1.0 MΩ resistor, R3, (brown, black, green)
• 10 kΩ resistor, R1, (red, black, orange)
• 10 kΩ thermistor, RT
• 1 µF capacitor, C
Exercise 1-1 Measuring Component Values
1. Connect the NI ELVIS II workstation to your computer using the supplied USB cable. The
box USB end goes to the NI ELVIS II workstation and the rectangular USB end goes to the
computer. Turn on your computer and power up NI ELVIS II (switch on the back of
workstation). The USB ACTIVE (orange) LED turns ON. In a moment, the ACTIVATE LED
turns OFF and the USB READY (orange) LED turns ON.
2. On your computer screen, click on the NI ELVISmx Instrument Launcher Icon or shortcut. A
strip of NI ELVIS II instruments appears on the screen. You are now ready to make
measurements.
Figure 1-2. NI ELVISmx Instrument Launcher Icon Strip
3. Connect two banana-type leads to the digital multimeter (DMM) inputs [VΩ ] and [COM] on
the left side of the workstation. Connect the other ends to one of the resistors.
2
Tài liệu TN Dụng cụ Bán dẫn – Kit Elvis II
____________________________________________________________________________
4. Click on the DMM icon within the NI ELVISmx Instrument Launcher to select the digital
multimeter.
Figure 1-3. Digital Multimeter, Ohmmeter configuration
You can use the DMM SFP for a variety of operations such as voltage, current, resistance, and
capacitance measurements. Use the notation DMM[X] to signify the X operation.
The proper lead connections for this measurement are shown on the DMM front panel.
5. Click on the Ohm button [Ω] to use the digital ohmmeter function, DMM[Ω]. Click on the
green arrow [Run] box to start the measurement acquisition. Measure the three resistors R1, R2,
and R3.
Fill in the following data:
R1 _______ (1.0 k Ω nominal)
R2 _______ (2.2 k Ω nominal)
R3 _______ (1.0 M Ω nominal)
To stop the acquisition, click on the red square [Stop] box.
Note If you click on the Mode box, you can change the {Auto} ranging to {Specify Range} and
select the most appropriate range by clicking on the Range box.
3
Tài liệu TN Dụng cụ Bán dẫn – Kit Elvis II
____________________________________________________________________________
End of Exercise 1-1
Exercise 1-2 Building a Voltage Divider Circuit on the
NI ELVIS II Protoboard
1. Using the two resistors, R1 and R2, assemble the following circuit on the NI ELVIS II
protoboard.
Figure 1-4. Voltage Divider Circuit
2. Connect the input voltage, Vo, to the [+5 V] pin socket.
3. Connect the common to the [GROUND] pin socket.
4. Connect the external leads to the DMM voltage inputs [VΩ ] and [COM] on the side of the NI
ELVIS workstation and the other ends across the 2.2 kΩ resistor.
5. Check the circuit and then apply power to the protoboard by pushing the prototyping board
power switch to the upper position [–]. The three power indicator LEDs, +15 V, –15 V, and +5
V, should now be lit and green in color.
Figure 1-5. Power LED Indicators on NI ELVIS II protoboard.
4
Tài liệu TN Dụng cụ Bán dẫn – Kit Elvis II
____________________________________________________________________________
Note If any of these LEDS are yellow while the others are green, the resettable fuse for that
power line has flipped off. To reset the fuse, turn off the power to the protoboard. Check your
circuit for a short. Turn the power back on to the protoboard. The LED flipped should now be
green.
6. Connect the DMM[V] test leads to Vo and measure the input voltage using the DMM[V]
function. Press [Run] to acquire the voltage data.
V0 (measured) _______________
According to circuit theory, the output voltage, V2 across R2, is as follows:
V2 = R2/(R1+R2) * Vo.
7. Using the previous measured values for R1, R2 and Vo, calculate V2. Next, use the DMM[V] to
measure the actual voltage V2.
V2 (calculated) ________________
V2 (measured) ________________
8. How well does the measured value match your calculated value?
End of Exercise 1-2
Exercise 1-3 Using the DMM to Measure Current
According to Ohm’s law, the current (I) flowing in the above circuit is equal to V2/R2.
1. Using the measured values of V2 and R2, calculate this current.
2. Perform a direct current measurement by moving the external lead connected to [VΩ] to the
current input socket (A). Connect the other ends to the circuit as shown below
Figure 1-6. Circuit Modification to measure Current
3. Select the function DMM[A] and measure the current.
I (calculated) ________________
I (measured) ________________
4. How well does the measured value match your calculated value?
End of Exercise 1-3
5
Tài liệu TN Dụng cụ Bán dẫn – Kit Elvis II
____________________________________________________________________________
Exercise 1-4 Observing the Voltage Development of an
RC Transient Circuit
Using the DMM[ ] function, measure the 1 µF capacitor.
1. Connect the capacitor leads to the Impedance Analyzer inputs, [DUT+] and [DUT–], found on
the left lower wiring block of a NI ELVIS II protoboard.
2. For capacitance and inductance measurements, the protoboard must be energized to make a
measurement. Switch the protoboard power ON.
3. Click on the capacitor button [ ] to measure the capacitor C with the DMM[ ] function. Press
the Run button to acquire the capacitance value.
C_______(µf)
4. Build the RC transient circuit as shown in the following figure. It uses the voltage divider
circuit where R1 is now replaced with R3 (1 MΩ resistor) and R2 is replaced with the 1 µF
capacitor C. Move your DMM leads to input sockets [V∧ ] and [COM]. The other ends go across
the capacitor.
Figure 1-7. RC Transient Circuit
5. Select DMM[V] and click on RUN.
6. When you power up the circuit, the voltage across the capacitor rises exponentially. Set the
DMM voltage range to {Specify Range} [10 V].
Turn on the protoboard power and watch the voltage change on the digital display and on the
%FS linear scale.
7. It takes about a few seconds to reach the steady-state value of Vo. When you power off the
circuit, the voltage across the capacitor falls exponentially to 0 V. Try it!
Note This demonstrates one of the special features of the NI ELVIS II digital multimeter
it can still be used even if the power to the protoboard is turned off.
End of Exercise 1-4
Study the operation of thermistor RT
6
Tài liệu TN Dụng cụ Bán dẫn – Kit Elvis II
____________________________________________________________________________
Exercise 1-5 Measurement of the Resistor Component
Values
1. Launch NI ELVIS II.
2. Select digital multimeter (DMM) from the SFP strip of instruments.
3. Click on the Ohm button.
4. Connect the test leads to DMM [VΩ ] and [COM] side sockets.
5. Measure the 10 kΩ resistor and then the thermistor.
6. Fill in the following chart:
10 kΩ Resistor _________________ Ohms
Thermistor _________________ Ohms
7. With the thermistor still connected, place the thermistor between your finger tips to heat it up
and watch the resistance change. It is especially interesting to watch the changes on the display
bar scale (%FS).
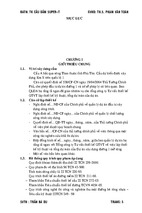
The fact that the resistance decreases with increasing temperature (negative temperature
coefficient) is one of the key characteristics of a thermistor.
Thermistors are manufactured from semiconductor material whose resistivity depends
exponentially on ambient temperature and results in a nonlinear response. Compare the
thermistor response with an RTD (100 Ω platinum resistance temperature device) shown in the
following figure.
Figure 1-8. Resistance-Temperature Curve of a Thermistor and an RTD
End of Exercise 1-5
7
Tài liệu TN Dụng cụ Bán dẫn – Kit Elvis II
____________________________________________________________________________
Exercise 1-6 Operating the Variable Power Supply
Complete the following steps to set a voltage level on one or both of the
variable power supplies.
1. From the strip menu of SFPs, select the [VPS] icon. There are two controllable power supplies
with NI ELVIS II, 0 to –12 V and 0 to +12 V, each with a 500 ma current limit.
Figure 1-9. Virtual SFP for Variable Power Supplies
In the default mode, you can control the VPS with the virtual panel shown above. Set the output
voltage on the virtual knob and click on the [Run] box. The output voltage is shown (blue in
color) in the display area above your chosen power supply. When you click on the stop button,
the output voltage is reset to zero on the protoboard.
Note To sweep the output voltage through a range of voltages, make sure that you have clicked
the [Stop] button. Select the Supply Source (+ or –), Start Voltage, Stop Voltage, Step Size, and
Step Interval, and click on [Sweep].
For manual operation, click on the Manual box and use the knobs on the right side of the NI
ELVIS II workstation to set the output voltages. To view the output voltage in the display area,
click on the white box now appearing next to the LabVIEW label.
2. Connect the leads from the protoboard strip connector sockets labeled Variable Power
Supplies [Supply +] and [Ground] to the DMM voltage inputs.
3. Select DMM[V] and click on RUN. Select VPS front panel and click on RUN.
4. Rotate the virtual VPS control for Supply + and observe the voltage changes on the DMM[V]
display.
Note You can use the [RESET] button to quickly reset the voltage back to zero.
8
Tài liệu TN Dụng cụ Bán dẫn – Kit Elvis II
____________________________________________________________________________
5. Click on the Manual box to activate the real controls on the right side of the workstation. The
virtual controls are grayed out. Observe that the green LED Manual Mode on the NI ELVIS II
workstation is now lit.
6. Rotate the + voltage supply knob and observe the changes on the DMM.
Note VPS– works in a similar fashion except the output voltage is negative.
End of Exercise 1-6
Exercise 1-7 A Thermistor Circuit
Complete the following steps to build and test the thermistor circuit.
1. On the workstation protoboard, build a voltage divider circuit with the 10 kΩ resistor and a
thermistor. The input voltage is wired to [Supply +] and [Ground] sockets. The voltage across
the thermistor goes to the DMM[V] leads.
Figure 1-10. Temperature Measuring circuit using a Thermistor
Figure 1-11. Real Thermistor circuit on NI ELVIS protoboard
2. Make sure the Variable Power Supply voltage levels are set to zero.
9
Tài liệu TN Dụng cụ Bán dẫn – Kit Elvis II
____________________________________________________________________________
Apply power to the protoboard and observe the voltage levels on the DMM display. Increase the
voltage from 0 to +5 V. The measured voltage across the thermistor, VT, should increase to
about 2.5 V.
3. Reduce the power supply voltage to +3 V. This ensures that the self-heating (Joule heating)
inside the thermistor does not affect the reading of the external temperature.
4. Heat the thermistor with your finger tips and watch the voltage decrease.
You can rearrange the voltage divider equation to calculate the thermistor resistance as follows:
RT = R1 * VT /(3 –VT)
At an ambient temperature of 25 °C, the thermistor resistance should be about 10 kΩ.
With this equation, called a scaling function, you can convert the measured voltage into the
thermistor resistance. You can easily measure
VT with the NI ELVIS II DMM or within a LabVIEW program (VI).
10
Tài liệu TN Dụng cụ Bán dẫn – Kit Elvis II
____________________________________________________________________________
Lesson 2: AC Circuit Tools
Figure 2-1. Scope SFP showing two channel capability
Many electronic circuits contain alternating current (AC). Designing good circuits requires tools
to measure components, impedance values, and tools to display circuit properties. With good AC
tools and minimal circuit knowledge, you can modify any circuit to achieve optimal response.
Goal
This lab introduces the NI ELVIS II tools for AC circuits: a digital multimeter, function
generator, oscilloscope, impedance analyzer, and Bode analyzer.
Required Soft Front Panels (SFPs)
• Digital Multimeter using Ohmmeter/Capacitance (DMM[Ω/ ╫])
• Function Generator (FGEN)
• Oscilloscope (Scope)
• Impedance Analyzer (Imped)
• Bode Analyzer (Bode)
Required Components
• 1 kΩ resistor, R, (brown, black, red)
• 1 µF capacitor, C
11
Tài liệu TN Dụng cụ Bán dẫn – Kit Elvis II
____________________________________________________________________________
Exercise 2-1 Measurement of the Circuit Component
Values
Complete the following steps to obtain the values of the circuit components:
1. Launch the NI ELVIS II Instrument Strip.
2. Select Digital Multimeter.
3. Connect test leads to the DMM [VΩ] and [COM].
4. Use DMM[Ω] to measure the resistor, R.
5. Use DMM[╫ ] to measure the capacitor, C.
6. Fill in the following chart:
Resistor R _________________ kΩ (1 kΩ nominal)
Capacitor C _________________ µF (1 µF nominal)
7. Close the DMM.
End of Exercise 2-1
Exercise 2-2 Measurement of Component and Circuit
Impedance Z
For a resistor, the impedance is the same as the DC resistance. You can represent it on a 2D plot
as a line along the x-axis, which is often called the real component. For a capacitor, the
impedance (or more specifically, the reactance), XC is imaginary, depends on frequency, and is
represented as a line along the y-axis of a 2D plot. It is called the imaginary component.
Mathematically, the reactance of a capacitor is represented by:
XC = 1/jωC
where is the angular frequency (measured in radians/sec) and j is a symbol used to represent an
imaginary number. The impedance of an RC circuit in series is the sum of these two components
where R is the resistive (real) component and XC is the reactive (imaginary) component.
Z = R + XC = R + 1/jωC Ω
Impedance can also be represented as a phasor vector on a polar plot with:
Magnitude = (R2 + XC2)
and
Phase θ = tan–1 (XC / R)
A resistor has a phasor along the real (x) axis. A capacitor has a phasor along the negative
imaginary (y) axis. Recall from complex algebra that 1/j = –j.
12
Tài liệu TN Dụng cụ Bán dẫn – Kit Elvis II
____________________________________________________________________________
Complete the following steps to visualize this phasor in real time:
1. Select Impedance Analyzer (Imped) from the NI ELVISmx
Instrument Launcher.
Figure 2-2. Phasor Vector for an RC circuit at 1000 Hz
2. Place your components on the NI ELVIS II protoboard.
3. Connect jumpers from Impedance Analyzer DUT+ and DUT– to the nominal 1 kΩ resistor.
4. Turn on power to the NI ELVIS II protoboard and click on Run.
5. Verify that the resistor phasor is along the real axis and its Phase is zero.
6. Connect the Impedance jumpers to the capacitor.
7. Verify that the capacitor phasor is along the negative imaginary axis and its Phase is 270 or –
90 degrees.
8. The default measurement frequency is 1000 Hz. Adjust the frequency value and observe that
the reactance (length of the phasor) gets smaller when you increase the frequency and larger
when you decrease the frequency. Recall |Xc| = 1/ωC.
9. Connect the Impedance jumpers across the capacitor and resistor in series. The phasor has
now both a real and imaginary component.
10. Change the measurement frequency from 100, to 500, to 1000, to 1500Hz and watch the
phasor move.
11. Adjust the frequency until the magnitude of the reactance |Xc| equals the magnitude of the
resistor, R. At this special frequency, the phasor phase reads 315 or –45 degrees.
12. What is the magnitude of the phasor ____________?
13. Answer: |R| 2
14. Close the Impedance Analyzer window.
13
Tài liệu TN Dụng cụ Bán dẫn – Kit Elvis II
____________________________________________________________________________
End of Exercise 2-2
Exercise 2-3 Testing an RC Circuit with the Function
Generator and Oscilloscope
Complete the following steps to build and test the RC circuit.
1. On the workstation protoboard, build a voltage divider circuit, using a 1 µF capacitor and
a 1.0 kΩ resistor.
2. Connect the RC circuit inputs to function generator [FGEN] and [Ground] pin sockets on
the protoboard.
Figure 3-3. Real RC components connected to the FGEN
The power supply for an AC circuit is often a function generator. Use it to test your RC circuit.
3. From the NI ELVISmx Instrument Launcher, select FGEN icon.
14
Tài liệu TN Dụng cụ Bán dẫn – Kit Elvis II
____________________________________________________________________________
Figure 3-4. FGEN front panel
The FGEN SFP has controls, which can do the following:
• select the waveform type (sine, triangle, or square)
• set the frequency by rotating the Frequency dial or entering the frequency into a text box [Hz]
• select the waveform amplitude and any offset using the Amplitude and DC Offset controls
Function Generator real controls (Frequency) and (Amplitude) are also available on the right side
of the NI ELVIS II workstation. As with the variable power supply, you can enable manual
control by clicking on the Manual Mode box [ ]. A green LED on the right side of the
workstation comes on to indicate manual control. The Frequency and Amplitude knobs are now
active and the virtual controls are grayed out on the NI ELVISmx Function Generator window.
Note The Function Generator also provides some special operations such as signal modulation
(AM or FM) or frequency sweeping. You will use these features in a later lab.
4. Set the Function Generator to Sine wave, 2000 Hz, 2 Vpk–pk. Click on Run.
You can use the Scope SFP to visualize and analyze the voltage signals of the RC circuit.
5. From the NI ELVISmx Instrument Launcher, select the Scope icon.
15
Tài liệu TN Dụng cụ Bán dẫn – Kit Elvis II
____________________________________________________________________________
Figure 3-5. Sine wave displayed on the Scope front panel
The scope instrument SFP is similar to most oscilloscopes, but the NI ELVIS II oscilloscope can
automatically connect inputs to a variety of sources, features built-in AC measurements and
waveform cursors, and can easily log a waveform pattern.
6. Connect test leads from the CH0 BNC connector on the left side of the NI ELVIS II
workstation across the 1 kΩ resistor in your RC circuit. Apply power to the protoboard and click
on the oscilloscope [Run] button.
7. You see a sine wave on the oscilloscope. Set the controls as follows:
• Scale CH0 500 mV/div
• Coupling CH0 AC
• Time base 500 µs/div
• Trigger (Edge), Source (Chan 0 Source), Level (V) (0.1)
Check out the Channel 0 measurements RMS, Freq, and Vpk–pk at the bottom of the waveform
screen. You can activate cursors to measure time-related parameters such as period, duty cycle,
and time intervals.
8. Play with the FGEN controls (virtual or real) and observe the changes on the oscilloscope
window.
9. Connect another set of test leads from Scope CH1 to the Function Generator SYNC pin socket
and GROUND on the protoboard. SYNC is a TTL 5 V signal often used for triggering.
10. Click the Scope CH1 enable box [ ]. You see a new signal (blue in color) and at TTL levels.
For reference, see the oscilloscope picture at the start of this lab, Figure 3-1.
16
Tài liệu TN Dụng cụ Bán dẫn – Kit Elvis II
____________________________________________________________________________
11. The RC circuit is a passive highpass filter with a low-frequency cutoff point near 160 Hz.
You can visualize the filter parameters using the FGEN Sweep Frequency feature. Set the
oscilloscope at the above settings. Set the FGEN controls to the following:
– Start Frequency 5 Hz
– Stop Frequency 5 kHz
– Step 50 Hz
Click on the Function Generator [Stop] button and then click on the [Sweep] button.
12. Observe how the filtered signal CH 0 changes with respect to the SYNC CH 1 signal in both
amplitude and phase as the frequency is swept.
At low frequencies, the signal CH 0 is smaller in amplitude and not in phase with the SYNC
signal. At higher frequencies, the amplitude is close to the function generator amplitude and the
two signals are in phase.
13. Close the Function Generator and Oscilloscope windows.
End of Exercise 2-3
Exercise 2-4 The Gain/Phase Bode Plot of the RC
Circuit
A Bode plot defines in a very real graphical format the frequency characteristics of an AC
circuit. Amplitude response is plotted as the circuit gain measured in decibels as a function of log
frequency. Phase response is plotted as the phase difference between the input and output signals
on a linear scale as a function of log frequency.
Complete the following steps to build an RC circuit and measure the gain and phase Bode plots
of the circuit.
1. From the NI ELVISmx Instrument Launcher, select Bode icon. With the Bode Analyzer, you
can scan over a range of frequencies – from a start frequency to a stop frequency in steps of ∆f.
You can also set the amplitude of the test sine wave. The Bode Analyzer uses the function
generator SFP to generate the test waveform. You must connect FGEN output sockets to your
test circuit and to [AI 1+] and Ground [AI 1–]. The output of the circuit under test goes to [AI
0+] and Ground.
You can find more information by clicking the HELP button on the lower right corner of the
Bode Analyzer window.
2. Rebuild the RC circuit on the NI ELVIS II protoboard, similar to the following circuit and
make the connections as described above.
17
Tài liệu TN Dụng cụ Bán dẫn – Kit Elvis II
____________________________________________________________________________
Figure 3-6. RC components connections for Bode Measurements
3. Verify that your circuit is connected as above. Turn on the protoboard power and click on the
[Run] button.
Figure 3-7. Bode Analyzer front panel measurements of an RC circuit
18
Tài liệu TN Dụng cụ Bán dẫn – Kit Elvis II
____________________________________________________________________________
4. Click on the [ ] Cursors On box. You can step through your measured data points and view the
magnitude and phase at each frequency measured.
5. Note the frequency where the signal amplitude has fallen to –3 dB. The phase at this point
should read approximately 45 degrees. This frequency is called the lowpass cutoff point.
6. Both the oscilloscope and the Bode analyzer SFPs have a Log button. When activated, the data
presented on the graphs is written to a spreadsheet file on your hard drive. You can now read this
data for further analysis with Excel, LabVIEW, NI DIAdem, or some other analysis or plotting
program.
7. Click on the [Log] button and save your data set.
View an example data set like the one below when you click the Log button
after a frequency scan.
End of Exercise 2-4
19
Tài liệu TN Dụng cụ Bán dẫn – Kit Elvis II
____________________________________________________________________________
Lesson 3: Op Amp Filters
Figure 3-1. Frequency Characteristics of a BandPass Filter
Adding a few capacitors and resistors to the basic operational amplifier (op amp) circuit can
yield many interesting analog circuits such as active filters, integrators, and differentiators.
Filters are used to pass specific frequency bands, integrators are used in proportional control, and
differentiators are used in noise suppression and waveform generation circuits.
Goal
This lab uses the NI ELVIS II suite of instruments to measure the characteristics of lowpass,
highpass, and bandpass filters. Simulate these filters using Multisim with the measured
component values. In the lab challenge at the end of this chapter, Multisim is used to design a
second order active filter
Required Soft Front Panels (SFPs)
• Digital multimeter (DMM[Ω, ╫])
• Function generator (FGEN)
• Oscilloscope (Scope)
• Impedance analyzer (Imped)
• Bode analyzer (Bode)
20
- Xem thêm -