Nâng cao năng lực cạnh tranh cụm ngành du lịch ở Tỉnh An Giang
i
CERTIFICATION
I certify that the research has not been submitted for any degrees. I certify that, to the best of
my knowledge, I have acknowledged all sources of information and support. The study does
not necessarily reflect the views of the University of Economics Ho Chi Minh City or the
Fulbright Economics Teaching Program.
Author
Hoang Tu Uyen
ii
ACKNOWLEDGEMENT
My deep gratitude to Dr. Jonathan R.Pincus for his thoughtful and patient supervision and
encouragement.
My special thanks to Dr. Vu Thanh Tu Anh, Phan Chanh Duong and the teachers at the
Fulbright Economics Teaching Program for their inspiration.
Love to family and friends.
iii
ABSTRACT
This thesis studies the competitiveness of the tourism sector in An Giang province, using the
cluster approach. The thesis applies an adjusted Michael E.Porter model to evaluate the
competitiveness of the tourism cluster in An Giang and finds that even though An Giang
province attracts a large number of tourists every year, revenue from the tourism sector is
relatively small compared to its competitors, and the activities in the cluster target the low-end
market segment. Moreover, spiritual tourism in An Giang province does not demonstrate
much growth potential. The tourism sector in An Giang province is duplicating the offerings
of other destinations and does not have clear competitive advantages. Therefore, the thesis
recommends that the government should not invest heavily in promoting spiritual tourism but
should improve the business environment by enhanced infrastructure, education and
promotional campaigns. The thesis also suggests that the province should shift its focus from
spiritual tourism to heritage tourism.
Key words: tourism sector, cluster, spiritual, heritage
iv
CONTENTS
CERTIFICATION.................................................................................................................................... i
ACKNOWLEDGEMENT ...................................................................................................................... ii
ABSTRACT ........................................................................................................................................... iii
ABBREVIATIONS................................................................................................................................ vi
LIST OF TABLES ................................................................................................................................ vii
LIST OF CHARTS .............................................................................................................................. viii
LIST OF FIGURES................................................................................................................................ ix
1.
INTRODUCTION............................................................................................................................1
1.1.
2.
3.
1.1.1.
Clusters & the competitiveness of clusters .......................................................................1
1.1.2.
The Tourism cluster in An Giang .....................................................................................7
1.2.
Research Objectives .................................................................................................................8
1.3.
Research Questions ..................................................................................................................8
1.4.
Organization of the Research ...................................................................................................9
METHODOLOGY .........................................................................................................................10
2.1.
Research methods...................................................................................................................10
2.2.
Research models.....................................................................................................................10
FINDINGS .....................................................................................................................................11
3.1.
An Giang as a gateway to the Mekong Delta .........................................................................11
3.2.
The performance of the current tourism cluster .....................................................................14
3.3.
Determinants of regional competitiveness in tourism ............................................................21
3.3.1.
Given local nature endowment .......................................................................................22
3.3.2.
Competitiveness at the regional level.............................................................................25
3.3.3.
Competitiveness at the firms level ..................................................................................32
3.4.
4.
Background of the problem ......................................................................................................1
The diamond model of competitiveness ..................................................................................35
3.4.1.
Factor conditions (input conditions) ..............................................................................36
3.4.2.
Demand conditions .........................................................................................................38
3.4.3.
Related and supporting industries..................................................................................40
3.4.4.
Context for firm strategy and rivalry .............................................................................41
DISCUSSION, CONCLUSIONS, RECOMMENDATIONS ........................................................43
4.1.
Discussion ..............................................................................................................................43
4.1.1.
Summary of the current situation ...................................................................................43
4.1.2.
Opportunities..................................................................................................................44
v
4.1.3.
4.2.
Challenges ......................................................................................................................44
Recommendations...................................................................................................................45
4.2.1.
The choice of mutual development .................................................................................45
4.2.2.
Investment in infrastructure ...........................................................................................46
4.2.3.
Consideration of the proposed An Giang airport ..........................................................46
4.2.4.
Investment in education ..................................................................................................47
4.2.5.
Creation of tourism business associations .....................................................................47
4.2.6.
Creation of heritage tours ..............................................................................................48
4.2.7.
Less investment on spiritual tourism projects ................................................................48
4.2.8.
Promotional campaigns .................................................................................................48
4.3.
Conclusions ............................................................................................................................50
REFERENCES.......................................................................................................................................51
APPENDICES........................................................................................................................................56
vi
ABBREVIATIONS
2009 Census
2009 Population and Housing Census
AGPC
People Committee of An Giang province
AGU
An Giang University
An Giang
An Giang province
ATIPC
An Giang Trade and Investment Promotion Center
FDI
Foreign Direct Investment
GSO
General Statistics Office
HCMC
Ho Chi Minh City
ICAO
International Civil Aviation Organization
MDTA
Mekong Delta Tourism Association
PCI
Provincial Competitiveness Index
SME
Small and medium size enterprise
vii
LIST OF TABLES
Table 1.1: South Carolina industries’ dependence on tourism .................................................................6
Table 3.1: Tourism destinations in An Giang (listed by district) ...........................................................16
Table 3.2: Airports in the Mekong Delta ...............................................................................................30
Table 3.3: Structure of An Giang’s enterprises (2004 – 2009) ..............................................................33
Table 3.4: Structure of An Giang’s enterprises (divided by size of capital and number of employees)
(2004 – 2009) .........................................................................................................................................34
viii
LIST OF CHARTS
Chart 3.1: An Giang’s demographic structure in 2010 ..........................................................................12
Chart 3.2: Total retail sales of goods and services – current prices (1995 – 2010)................................12
Chart 3.3: Composition of An Giang’s economy from 2000 to 2010 ....................................................13
Chart 3.4: Number of tourists served by the hotels in An Giang (2001 – 2010)....................................18
Chart 3.5: Structure of domestic tourism in 2009 ..................................................................................18
Chart 3.6: Average expenditures per day of domestic tourists in 2009..................................................19
Chart 3.7: Tourists’ average daily expenditures in An Giang from 2000 to 2010 .................................19
Chart 3.8: Number of tourists served by the accommodation units and length of stay ..........................20
Chart 3.9: Revenue from tourism activities (2009 – 2011) ....................................................................20
Chart 3.10: Revenue per tourist in 2011.................................................................................................21
Chart 3.11: GDP per capita (constant prices) of An Giang, Can Tho, Kien Giang, Tien Giang and Tay
Ninh from 2000 - 2010 ...........................................................................................................................24
Chart 3.12: Volume of passengers in An Giang, Can Tho and Tay Ninh (2001 – 2010) ......................25
Chart 3.13: Percentage of drop – out students from 5 to 18 years old in 2009 ......................................26
Chart 3.14: Proportion of development investment expenditure of An Giang from 2000 – 2010 .........28
Chart 3.15: PCI of An Giang province in 2010 and 2011 ......................................................................33
Chart 3.16: Revenue of the enterprises in tourism sector in An Giang (2001 – 2010) .........................37
Chart 3.17: Increase of foreign tourists from 1996 – 2011 ....................................................................39
ix
LIST OF FIGURES
Figure 1.1: Determinants of regional competitiveness.............................................................................3
Figure 1.2: Diamond model of competitiveness ......................................................................................4
Figure 1.3: Cluster development ladder ..................................................................................................6
Figure 3.2: Map of the transport network from An Giang to larger Mekong Delta ...............................13
Figure 3.3: An Giang tourism’s cluster map ..........................................................................................15
Figure 3.4: Determinants of regional competitiveness in tourism in An Giang .....................................22
Figure 3.5: Distances from An Giang and Tay Ninh to HCMC and Phnom Penh.................................22
Figure 3.6: Percentage of high school graduates....................................................................................26
Figure 3.7: Locations of An Giang, Can Tho, Ca Mau, Rach Gia and Phu Quoc airports ...................29
Figure 3.8:Location of industrial zones and tourist sites in An Giang province ....................................32
Figure 3.9: Diamond model of competitiveness in An Giang ................................................................36
Figure 4.1: Promotional campaigns targeting at tourists........................................................................49
1
1. INTRODUCTION
1.1. Background of the problem
1.1.1. Clusters & the competitiveness of clusters
Clusters as a new economic concept
“Cluster” is an emerging term in today’s economics. Michael E. Porter (1998) claims that
clusters have a prominent role in maintaining the competitiveness of nations. He defines a
cluster as a “geographic concentration of interconnected companies and institutions in a
particular field,” which includes suppliers of specific inputs, providers of specialized
infrastructure, manufacturers of complementary products and companies in related industries
(Porter 1998, 199). He also states that when the companies and institutions get together in
clusters, their whole value is greater than the sum of each separate part, and “clusters, broader
than industries, capture important linkages, complementarities, and spillovers of technology,
skills, information, marketing, and customer needs that cut across firms and industries”
(Porter 1998, 205).
Clusters promote both competition and cooperation (Porter 1998). Clusters will affect
productivity growth, with “productivity” defined as “the value created per day of work and
unit of capital or physical resources employed” (Porter 1998, 209). Porter states that clusters
are of foremost importance since they provide better access to employees, suppliers,
specialized information, complementarities, institutions and public goods. Clusters also
encourage improved measurement and motivation. Besides, clusters also help drive the
direction and pace of innovation as well as stimulate the formation of new businesses (Porter
1998). Ferreira and Estevão (2009) believe that clusters generate static externalities (cheaper
access to product factors) and dynamic externalities (enhanced learning and motivation).
The tourism cluster
Tourism has recently been considered an “economic growth engine with particular focus at
the regional level” (Ferreira and Estevão 2009, 1). Botti et al. (2008) prove that the industry is
a prodigious source of value creation and employment, especially in places with no other
alternative economic advantages.
2
Ferreira and Estevão (2009, 5) define the tourism cluster as a “geographic concentration of
companies and institutions interconnected in tourism activities”. Generally, tourism clusters
are associated with tourism products and destinations.
Tourism achieves positive economic outcomes through clustering (Roberts 2000). The
industry is extremely suitable to the application of the cluster concept because the satisfaction
of the customers (tourists) comes from both the attraction of the destination and the quality of
related businesses such as hotels, restaurants, shopping centers and transportation (Ferreira
and Estevão 2009). Nordin (2003) observes that the experience of tourists is based on the
overall impression of the destination visited, and every single factor needs systematic
development.
In general, destinations like clusters are formed naturally. However, to achieve their full
potential, they need support (Nordin 2003). Braun (2005) says that tourism clusters’ growth
needs a critical mass of firms and also the important elements of strategic infrastructure such
as hard, financial and human resource infrastructure.
The competitiveness of tourism clusters
Dominguez (2001, as cited in Ferreira and Estevão 2009, 9) states that the competitiveness of
a tourism cluster depends on the tourism businesses’ capacity to attract visitors who “offset
the costs of business development, and reward the capital invested, in an equal or above
manner of the opportunity cost.” Some elements of tourism cluster competitiveness are
invisible and immeasurable (Dwyer and Kim 2003). Objectively measured elements of the
competitiveness of a tourism destination (tourism cluster) are visitor numbers, market share,
tourist expenditure, employment and value added by the tourism industry, and the
subjectively measured ones are “richness of culture and heritage” and “quality of tourism
experience” (Dwyer and Kim 2003, 375). There are models that can be applied to measure
the competitiveness of a destination and a specific cluster.
Determinants of regional competitiveness
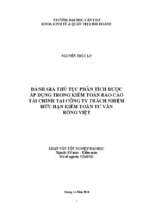
Adjusting Porter’s framework to a regional scale to analyze national competitiveness, Vu
Thanh Tu Anh et al. (2011) mention three factors that affect the productivity of a region,
namely: (i) regional natural endowments; (ii) competitiveness at the regional level; and, (iii)
competitiveness at the firm level.
3
Figure 1.1: Determinants of regional competitiveness
Competitiveness at the firm level
Business
environment &
infrastructure
Cluster
development
Business’s practice
& strategies
Competitiveness at the regional level
Cultural, social,
medical & education
infrastructure
Fiscal, credit
policies &
Economic structure
Given local natural endowments
Natural resources
Geographic
position
Scale of regional
economy
Source: Porter, E. (1990), adjusted by Vu Thanh Tu Anh et al. (2011)
Natural endowments refer to the factors naturally owned by the regions such as natural
resources, geographic position and scale of the local economy. It is not always true that
favorable natural endowments will lead to a high degree of competitiveness of a region and
vice versa (Vu Thanh Tu Anh et al. 2011). Facing pressure from unfavorable conditions, such
as lacking natural resources or having an adverse climate, necessary strategies and innovation
will be generated, thus enhancing competitiveness. For example, Japan and Korea have
proved that countries can create and maintain high competitiveness without the support of
natural resources, while many countries blessed by nature such as Nigeria and many other
African countries seem to suffer from the “curse of natural resources” (Sach and Warener
1995).
Competitiveness at the regional level includes the infrastructure of culture, society, health and
education, which is usually called “soft infrastructure,” together with fiscal and credit policies
and the economic structure of the region. The last determinant of regional competitiveness
refers to competitiveness at the firm level. This determinant includes the business
environment and infrastructure, the capacity of the clusters and the strategies and business
practices in the region.
4
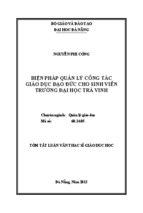
Diamond model of competitiveness
Porter (1990) believes that the success of every company that competes in the market comes
from the economic environment, institutions and government’s policies. He also emphasizes
that the main indicator of competitiveness is productivity. He proposes a framework of
competitive performance, depicted as a “diamond model”, consisting of (i) factor conditions;
(ii) firm strategy, structure and rivalry; (iii) demand conditions; and (iv) related and
supporting industries. Porter later adds (v) government and (vi) change/chance as “events out
of control of the company”.
Figure 1.2: Diamond model of competitiveness
A local context that encourages
investment and sustained upgrading,
e.g. intellectual property protection
Open vigorous competition among
local based rival
Government
Film Strategy
Structure &
Rivalry
Factor
conditions
Demand
conditions
High quality, specialized inputs
available to firms:
•
•
•
•
•
•
Human resource
Capital resources
Physical infrastructure
Information infrastructure
Scientific & technological
infrastructure
Natural resources
Source: Porter, E. (1990)
A core of sophisticated and
demanding local customer(s)
Related &
Supporting
Industries
Availability of capable,
locally based suppliers and
firms in related industry
Presence of clusters instead
of isolated industry
Unusual local demand in
specialized segments that can
be served nationally or
globally
Customer needs that
anticipate those elsewhere
5
The first facet of the model is about factor conditions, which Porter and many other authors
place much emphasis on. Factor conditions are also called “input conditions” – or raw
materials. In tourism, factor conditions play such an important role that Nordin (2003) even
claims that without these conditions, there would be no tourism activity. Factor conditions are
usually classified as “basic production factors” such as land, labor, capital, natural and
cultural resources and “specialized factors” (Nordin 2003, 21). Among these, specialized
factors – things that are not inherited but created – are vital to competitiveness. The
specialized factors of the tourism industry include human resources trained in tourism,
infrastructure to access natural resources, capital markets to finance long-term tourism
projects and wide coverage of public services (Inman 2002 – as cited in Nordin 2003).
Demand conditions refer to the needs and wants of consumers. Local demand is very
important since the proximity of companies to their customers increases their responsiveness
and shortens communication channels (Nordin, 2003). Nordin (2003) also states that both
domestic and foreign visitors contribute to local demand of tourism. Porter (1998) believes
that the sophistication of consumers is crucial. Smeral (1998) says that sophisticated tourists’
needs require recognizing new trends and new production possibilities early on. Therefore,
anticipating consumers’ wants are vital to developing tourism activities.
Porter (1990) insists that in an intensively competitive environment among local companies,
the pressure to innovate and constantly improve is created. Therefore, long-term competition
should be considered as a driver of innovation. In the tourism industry, destinations compete
in terms of services, prestige and market share (Nordin, 2003), and it is not surprising that the
high degree of rivalry may lead to improved standards and new products.
Nordin (2003) concludes that the competitiveness of a destination is defined by “the degree of
specialization, by its diversity, the quality of suppliers and operating network” (Nordin 2003,
23). The term “related and supporting industry” is related to the development of all factors in
a cluster. There is no general agreement about the dependence of each single related industry
depends on tourism, but Flowers and Easterling (2005) propose a grid, ranking industries by
their dependence on tourism for the tourism cluster in South Carolina. The grid can be more
or less applied to other tourism clusters.
6
Table 1.1: South Carolina industries’ dependence on tourism
�
�
�
�
�
�
Tier 1
Tier 2
Tier 3
�
�
�
�
�
�
�
Tier 4
Tier 5
Hotels
Airports
Amusement/recreation
Restaurant
Auto services
Manufacturing (e.g., transportation
equipment)
Retail trade
Wholesale trade
Advertising
FIR (Finance/Insurance/Real Estate)
Utilities
Communications
Agriculture/ Construction
50 – 75%
30 – 50%
15 – 30%
10 – 15%
5 – 10%
Source: Flowers and Easterling (2005)
In the grid, Flowers and Eastering (2005) conclude that tourism has the strongest effect on the
hotel industry. Some other industries such as restaurants, recreation and auto services also
significantly depend on tourism. Their dependence is about 50 percent. In addition, tourism
also affects other economic activities to a smaller extent.
Cluster development ladder
McRae – William (2002) explains that clusters progress through a ladder in which the later
stages achieve better performance than earlier ones, and working clusters are the ones with the
highest competitiveness. They have the critical mass, geographic concentration and active
clustering processes.
Figure 1.3: Cluster development ladder
Wannabe
Policy driven
Potential
Working
Latent
Source: McRae – William (2004)
In her paper, McRae – William (2002) describes a “wannabe” cluster as a so-called cluster
that “lacks too many vital economic attributes to benefit from being a cluster” (McRae William 2002, 240), while a “working” cluster shows many favorable characteristics of
clustering and high level of interconnection. In the middle, “latent” and “potential” clusters
have critical mass and geographic concentration but without active clustering processes.
7
Dwyer and Kim (2003) provide a list of groups of determinants and indicators of a
destination’s competitiveness. The model provides a more detailed description of the factors
affecting the competitiveness of a tourism destination. Therefore, the ideas of Dwyer and Kim
have been employed as a useful benchmark for evaluating the competitiveness of the tourism
cluster in An Giang.
1.1.2. The Tourism cluster in An Giang
An Giang welcomes a large number of visitors every year. According to official records, the
total number of visitors was more than 5.5 million in 2011, and eighty-seven percent of
tourists who visited An Giang in 2010 were Vietnamese (Mekong Delta Tourism Association
- MTDA 2012). Tourism activities in An Giang basically depend on spiritual tourism, with
the center as Ba Chua Xu festival, lasting for four months, from the first to the fifth month of
the lunar year. Each year, the festival hosts more than three million visitors, accounting for
about 70 percent of the total number of tourists to An Giang every year, according to Huynh
Thi Nhu Lam, chair of Tourism, An Giang’s Department of Culture, Sports and Tourism.
The seasonal peak of tourism activities in An Giang is between the first and the fifth month of
the lunar new year because of the density of the religious festivals during this period of time.
During the peak season, about 70 to 80 percent of tourists visit the province.
Typically, the tourism cluster in An Giang attracts the following types of visitors:
•
Pilgrims who visit the destination every year to worship during the Ba Chua Xu
festival and some other religious festivals such as the ceremony at Thoai Ngoc Hau
tomb. They may also be involved in other activities such as shopping in the duty free
zone and shopping centers nearby or visiting pagodas and other religious places. These
visitors typically stay for a short while and do not use many tourism services. The
majority of this type of tourist is from the nearby provinces, but there is an increasing
trend of pilgrims from the northern provinces.
•
Heritage tourists are mostly foreign tourists, but there are also domestic heritage
tourists. They visit the cultural sites such as the Cham and Khmer villages, Oc Eo
relic, ox-racing festivals and boat house villages. These tourists usually use more
tourism services than the pilgrims. The number of this type of tourists is quite limited.
8
•
Sightseeing tourists consist of both domestic and foreign tourists. Domestic
sightseeing tourists mostly come from nearby provinces and they only have picnics.
Some of the well-known tourism sites are Tra Su Cajuput Forest, Ton Duc Thang
Monument, Cam Mountain Entertainment Park, Sap Mountain Entertainment Park and
some other theme parks.
The provincial government has shown an interest in developing tourism as one of the core
economic activities besides manufacturing and processing. Decision 803/QĐ-BVHTTDL of
the Ministry of Culture, Sports and Tourism in 2010 also claims An Giang, Kien Giang and
Ca Mau as the central group to develop tourism activities in the Mekong Delta. In reality,
revenue from hotels and restaurants (the main proportion of revenue from tourism) accounted
for about 10 percent of budget revenue (VND 1,628 billion in constant prices) in 2010, an
increase from 2000 of five percent (VND 345 billion in constant prices). Local government
also wants to improve the performance of tourism and make the province the tourism hub in
the region. However, the results thus far have fallen short of expectations. In 2011, even
though the number of tourists to An Giang made up 32 percent of the total number in the
Mekong Delta, revenue from the tourism sector in An Giang accounted for only seven percent
of the Delta’s total revenue from tourism (MDTA 2012). Also, spending and the average
length of stay among domestic and international tourists are quite limited. It seems like all of
the efforts to turn tourism into a flagship of An Giang’s economy have not achieved their
goals, thus raising questions about this region’s tourism competitiveness and potential for
further development.
1.2. Research Objectives
The research evaluates the role of tourism in An Giang’s social and economic development.
By applying an adjusted Porter model, the author evaluates the competitiveness of the tourism
cluster and introduces the necessary actions to be taken to enhance the cluster’s performance.
1.3. Research Questions
The research will answer the following questions:
-
How is the competitiveness of An Giang’s tourism sector?
-
What are the strengths and weaknesses of An Giang’s tourism cluster?
9
-
What policy changes are needed to enhance the competitiveness of the tourism cluster
in An Giang?
1.4. Organization of the Research
The research consists of four chapters. The first chapter provides the foundations for the
research, including the background, literature review, research objectives and research
questions. The second chapter sets out the methodology of the research, including the process
of gathering and analyzing data. The third chapter discusses the findings of the research.
Tables and charts are used to support the main conclusions. In the last chapter, the author
discusses the findings from the previous chapters, answers the research questions and
provides recommendations to enhance the competitiveness of the tourism cluster in An Giang
10
2. METHODOLOGY
2.1. Research methods
The author has employed qualitative research methods in this research. First, the secondary
data are collected. The author analysed the collected data to figure out the main problems and
built an interview list to dicuss with the experts. After the discussions, the author conducted
in-depth analyses and generate the main findings of the thesis. A list of the interviews can be
found in the appendices.
Secondary data were collected from the Statistical Year Books of the General Statistics Office
(GSO), An Giang province’s People Committee (AGPC), the Mekong Delta Tourism
Association (MDTA) and other research. Also, another important source of data was from the
research of Vu Thanh Tu Anh et al. (2011) of the Fulbright Economics Teaching Program
about the competitiveness of the provinces in the Mekong Delta. This information will be
organized using the method proposed by Michael E.Porter.
All data were processed in excel files and presented in the form of tables, charts and graphs.
2.2. Research models
The research is conducted mostly based on the ideas about the determinants of national
competitiveness from Professor Michael E. Porter, adapted by Vu Thanh Tu Anh et al. (2011)
to a regional scale. The model mentions three groups of factors affecting the competitiveness
of a region, including (i) regional natural endowments – geographical features, climate
conditions and scale of local economy; (ii) competitiveness at the regional level refers to the
so called “macro” economic conditions in a region, such as infrastructure, culture, society
value, health, education and local government policies; and, (iii) competitiveness at the firm
level, relating to the business environment, technical infrastructure (soft infrastructure), and
the development of clusters and firms’ strategies.
Also, the author will introduce the competitiveness of the tourism cluster in An Giang through
the diamond model (Porter, 1990), which mentions four facets of an industry’s
competitiveness: (i) factor conditions; (ii) demand conditions; (iii) firm strategy, structure and
rivalry; and, (iv) related and supporting industries.
11
3. FINDINGS
The findings are based on the information from data collected and interviews, and are
presented in narrative form and in tables, charts and pictures to reveal the competitiveness of
tourism sector in An Giang by a cluster approach. The main benchmarks are tourism sectors
in other provinces that share many things in common with the tourism sector in An Giang,
including Tay Ninh province, Can Tho city and some other provinces in the Mekong Delta.
Also, the development of the tourism cluster in An Giang over different periods of time is also
taken into consideration. A detailed list of determinants and indicators of the competitiveness
of tourism destination as suggested by Dwyer and Kim (2003) is also considered.
3.1. An Giang as a gateway to the Mekong Delta
Demographic features
An Giang is located in the upper reaches of the Mekong Delta, southern Vietnam. It shares a
100 - km border with Cambodia. Also, An Giang borders Dong Thap, Kien Giang provinces
and Can Tho City. Similar to other regions in the delta, An Giang has a fairly flat topography
with a criss – crossed river system. Besides the midland area, the province also has a low
mountain system, called Bay Nui – That Son (Seven Mountains) which is located in Tinh
Bien and Tri Ton districts. The province is home to many ethnic groups. Additionally, it has a
large number of pagodas, temples and other religious places. The province is divided into one
city, two towns and 8 districts.
With a population of around 2.2 million people (2010) living in 3,536 square kilometers, An
Giang is among the most crowded provinces in Vietnam, and 30 percent of its population
lives in urban areas (2009 Census). The population of the province comprised 12 percent of
the total population of the Mekong Delta in 2009 (2009 Census), and the population density is
about 608 people per square kilometer, which is much higher than the average population
density of the Mekong Delta (246 people per square kilometer) (Statistical Year Book of
Vietnam 2010). Educational attainment in the province is relatively low, compared to national
standards. In 2010, the number of high school graduates was 43/1,000 people.
- Xem thêm -