Mô tả:
Do luong dien
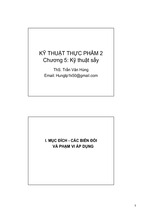
TMR7 Experimental methods in Marine Hydrodynamics – week 35
Instrumentation (ch. 4 in Lecture notes)
•
•
•
•
•
Measurement systems – short introduction
Measurement using strain gauges
Calibration
Data acquisition
Different types of transducers
100
Instrumentation
and data
acquisition
Resistance [N]
90
80
70
60
50
40
30
20
10
0
0.5
1
1.5
2
Speed [m/s]
1
Physical process
Measurement result
(numbers)
2.5
The old resistance measurement system
x kg
Towing Carriage
Ship model
Transducer = weights, wheels and string
Data acquisition = writing down total weight
2
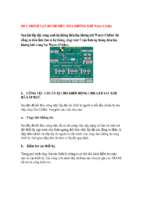
The new resistance measurement system
Data acquisition and signal conditioning system
A/D
Filter
Amplifier
Towing Carriage
Ship model
Transducer
based on strain
gauges
3
Measurement systems
Analog signals
Digital signals
+- 10V DC
Amplifier
Filter
A/D
+- 10 mV
Transducers
4
Strain gauges
5
Wheatstone bridge
B
DR
R-
R
B
R
DR is change of resistance due
to elongation of the strain gauge
Strain
1
2
• gauges
R is known, variable resistances
in the amplifier
A
• Vin is excitation – a known,
constant voltage source
• Vg is signal
•
R+
DR
Force K
C
Side view
6
Front view
Vin
Supply of constant voltage
G Vg
• Constant voltage (can also be
current) is supplied between A
and C
• The measured voltage (or
current) between B and G
depends on the difference
between the resistances R1-R4
• One or more of the resistances
R1-R4 are strain gauges
• If all resistances are strain
gauges, it is a full bridge circuit
• If only one resistance is a strain
gauge it is a quarter bridge
circuit
7
Output voltage measurement
Wheatstone bridge
Supply of constant voltage
Force transducer with two strain gauges, using
a Wheatstone half bridge
B
2
R
-D
R
Strain
1
gauges
R
+D
R
Force K
A
R
R
B
C
8
Side view
Front view
Vin
G Vg
Calibration
• How to relate an output Voltage from the amplifier to the
physical quantity of interest
Adjust calibration
factor
Known load
Analog signals
Known measurement value
Digital signals
+- 10V DC
Amplifier
Filter
A/D
+- 10 mV
Transducers
In a measurement:
Measurement value = transducer output amplification calibration factor
In a calibration:
Calibration factor = Known load / (transducer output amplification )
9
What is the calibration factor dependent
on?
•
•
•
•
Type of strain gauges used (sensitivity)
Shape of sensor and placement of strain gauges
Excitation voltage
Amplifier
settings
Amplification factor (gain)
Sensor
dependence
dependence
This means that one shall preferably calibrate the sensor
with the same amplifier and same settings as will be used in
the experiment
10
Zero level measurement
• The measurement is made relative to a known reference
level
– Typically, the signal from the unloaded transducer is set as zero
reference
• Two options:
– Balancing the measurement bridge by adjusting the variable
resistances in the amplifier
• Tare/Zero adjust function in the amplifier
– First making a measurement of the transducer in the reference
condition (typically unloaded), and then subtract this measured
value from all subsequent measurements
• This is usually taken care of by the measurement software (Catman)
11
• In hydrodynamic model tests, we usually use both options
in each experiment
Amplifiers
• Many different types:
–
–
–
–
DC
AC
Charge amplifier (for piezo-electric sensors)
Conductive wave probe amplifier
• Provides the sensor with driving current (Vin)
• Amplifies the sensor output from mV to (usually) 10V
DC
• Tare/zero adjust function (bridge balancing)
B
DR
R-
R+
DR
eK
– Adjusting the resistances R1, R2, R3, R4 in the Wheatstone bridge
to get zero VG in unloaded condition
A
Front view
G Vg
C
Transducers
Vin
Digital signals
+- 10V DC
Amplifier
Filter
A/D
R
R
12
Analog signals
B
A/D converters
Conversion of analog 10V DC signal to digital
Typically 12 to 20 bits resolution
Typically 8 to several hundred channels
Each brand and model requires a designated driver in the
computer, and often a custom data acquisition software
• Labview works with National Instruments (NI) A/D
converters, but also other brands provides drivers for
Labview
• Catman is designed to work only with HBM amplifiers
•
•
•
•
Analog signals
Digital signals
+- 10V DC
Amplifier
Filter
A/D
13
Transducers
A/D conversion – sampling of data
• The continuous analog signal is sampled at regular intervals - the
sampling interval h [s]
– The analog value at a certain instant is sensed and recorded
• The analog signal is thus represented by a number of discrete – digital
– values (numbers)
• The quality of the digital representation of the signal depends on:
– The sampling frequency f=1/h [Hz]
– The accuracy of the number representing the analog value
• The accuracy means the number of bits representing the number
• 8 bit means only 28=256 different values are possible for the number
representing the analog value => poor accuracy
• 20 bit means 220=1048576 different values => good accuracy
– The measurement range vs. the range of values in the experiment
– High sampling frequency and high accuracy both means large amounts of
data being recorded => large data files!
14
• The reason not to use high sampling frequency is mainly to reduce file size
Sampling frequency
Nyquist frequency fc
1
fc
2h
15
Means:
•You need at least two samples
per wave period to properly
represent the wave in in the
digitized data
•You should have more
samples per period to have
good representation …
•Less than two samples per
wave period will give “false
signals” (downfolding)
Effect of folding
Response spectrum
S
– Make sure fc is high enough
• To avoid folding:
that all frequencies are
correctly recorded
or
– Apply analogue low-pass
filtering of the signal,
removing all signal
components at frequency
above fc before the signal is
sampled
16
fc
frequency
Filters – to remove parts of the signal
Amplitude
Ideal characteristic
Real characteristic
Low pass filter
Removes high
frequency part of
signal (noise)
High pass filter
Removes low
frequency part of
signal (mean value)
Band pass filter
Retains only
signals in a certain
frequency band
Frequency
Analog signals
Digital signals
+- 10V DC
Amplifier
Filter
A/D
17
Transducers
Filtering – low pass filter
Asymmetric filtering (used in real-time)
2. 5
2
1. 5
1
0. 5
Averaging window
0
0
10
20
30
40
50
60
70
80
90
100
90
100
-0. 5
-1
-1. 5
-2
-2. 5
Symmetric filtering (can only be used after the test)
2. 5
2
1. 5
1
0. 5
Averaging window
0
0
10
20
30
40
50
60
70
80
-0. 5
-1
-1. 5
-2
-2. 5
Now!
Real time filters always introduce a phase shift – a delay
18
Data acquisition without filtering
• It is OK to do data acquisition without filtering as long as there is
virtually no signal above half the sampling frequency
– so there is no noise that is folded down into the frequency range of interest
• Requires high sampling frequency
– (>100 Hz, depending on noise sources)
• Requires knowledge of noise in unfiltered signal
– Spectral analysis, use of oscilloscope
• Unfiltered data acquisition eliminates the filter as error source, and
eliminates the problem of phase shift due to filtering
– Drawbacks:
• Must have good control of high-frequency noise
• Large sampling frequency means large data files
19
Selection of filter and sampling
frequency
• The problem with high sampling frequency is that result
files become large
– Double the sampling frequency means double the file size
– This is less of a problem for measurement of low-frequency
phenomena (ship motions etc.)
• Low-pass filter should be set just high enough to let the
most high-frequency signal of interest to pass unmodified
• Sampling frequency should then be set to at least twice the
low-pass filter cut-off frequency, preferably 5-10 times this
value
– 20 Hz Low-Pass filter
20
minimum:
40 Hz sampling
recommended: 200 Hz sampling
- Xem thêm -