UNIVERSITY OF ECONOMICS HO CHI MINH CITY
International School of Business
------------------------------
Duong Xuan Phuong
INEFFECTIVE ACCOUNTS
RECEIVABLE MANAGEMENT AT
VIETNAM AIRPORT GROUND
SERVICE COMPANY LIMITED
MASTER OF BUSINESS ADMINISTRATION
Ho Chi Minh City – Year 2020
UNIVERSITY OF ECONOMICS HO CHI MINH CITY
International School of Business
------------------------------
Duong Xuan Phuong
INEFFECTIVE ACCOUNTS
RECEIVABLE MANAGEMENT AT
VIETNAM AIRPORT GROUND
SERVICE COMPANY LIMITED
MASTER OF BUSINESS ADMINISTRATION
SUPERVISOR: DR. TRAN PHUONG THAO
Ho Chi Minh City – Year 2020
TABLE OF CONTENT
LIST OF FIGURES ............................................................................................................ 1
LIST OF TABLES .............................................................................................................. 1
EXECUTIVE SUMMARY ................................................................................................. 2
1.
PROBLEM CONTEXT .............................................................................................. 3
1.1 Company overview...................................................................................................... 3
1.2 Problem context........................................................................................................... 5
2.
PROBLEM IDENTIFICATION ................................................................................ 7
2.1 Possible problems ........................................................................................................ 7
2.1.1 Poor account receivable management.................................................................. 10
2.1.2 Poor account payable negotiation ........................................................................ 11
2.1.3 Overinvestment in equipment ............................................................................. 11
2.2 Main problem validation............................................................................................ 13
2.3 Main problem definition and its consequences ........................................................... 16
2.3.1 Main problem definition ..................................................................................... 16
2.3.2 Consequences .................................................................................................... 17
3. CAUSE VALIDATIONS .............................................................................................. 18
3.1 Possible causes .......................................................................................................... 18
3.1.1 Poor credit policy................................................................................................ 18
3.1.2 Weak credit assessment ability............................................................................ 19
3.1.3 Poor communication with customers on receivables............................................ 20
3.2 Cause validation ........................................................................................................ 21
3.2.1 Real causes ......................................................................................................... 21
3.2.2 Main cause ......................................................................................................... 23
4. SUGGESTED SOLUTIONS ......................................................................................... 24
4.1 Alternative solutions .................................................................................................. 24
4.1.1 Credit standard issuance..................................................................................... 24
4.1.2 Apply discount to payment of customers............................................................. 26
4.1.3 Using bank guarantees to secure the debt collection process ............................... 27
4.2 Solution justification ................................................................................................. 29
4.3 Action plan for the organization ................................................................................ 29
5. SUPPORTING INFORMATION ................................................................................. 32
5.1 Summary of research methods in the study ................................................................ 32
5.3 Interview transcripts .................................................................................................. 33
References.......................................................................................................................... 40
APPENDIX 1 ..................................................................................................................... 43
APPENDIX 2 ..................................................................................................................... 44
APPENDIX 3 ..................................................................................................................... 45
LIST OF FIGURES
Figure 1. Organization structure of VIAGS in December 2019
Figure 2. Fluctuations in DSO, DIO and DPO of VIAGS and SAGS over the years
Figure 3. The initial cause-effect map
Figure 4. Fluctuations in short-term trade receivables of customer groups over the years
Figure 5. The cause and effect map
LIST OF TABLES
Table 1. Categories of service provided by VIAGS
Table 2. Net revenue and net profit after tax of VIAGS
Table 3. Cash flow from operations of VIAGS
Table 4. Net working capital of VIAGS
Table 5. Net working capital of SAGS
Table 6. Cash conversion cycle of VIAGS
Table 7. Cash conversion cycle of SAGS
Table 8. Fixed assets of VIAGS
Table 9. The account receivables aging of VIAGS
Table 10. Short-term trade receivables structure by customer groups
1
EXECUTIVE SUMMARY
The study has approached the problem of Vietnam Airport Ground Services Co., Ltd. starting
with a situation where the company has experienced a decrease in working capital in the last
3 years. This greatly affects the cash flow and performance of company because of the
negative impact it has. Through secondary data provided by the company, interviews with
relevant people in the company and searching for related theories, the author realized that
there were a number of factors leading to this situation, of which the main problem is
identified as the inefficiency in receivables management. The receivables of company mainly
comes from credit sales. However, customers' payment periods for credits tend to be
extended. Going further to find out the causes of the problem, the three most prominent ones
are the ineffective credit policy, weak credit assessment ability and poor communication with
customer. After analysis, the main cause was determined by the company's lack of effective
credit policies to control credit issuance and monitor customer payments. To address this
cause, the best solution is to issue a strict set of credit standards. With this solution, the
company hopes to tighten the conditions to apply credit to customers, thereby reducing the
working capital needed to finance accounts receivable, reduce costs to maintain accounts
receivable, and especially reducing the risk of bad debt. The global economy has many
fluctuations, especially in the coming years, after the Coronavirus pandemic occurred in the
early months of 2020 and showed no signs of stopping until now. Airlines - customers of
VIAGS - suffered heavy losses unprecedented in history. Within the last 2 months, many
airlines in the world have fallen into financial exhaustion and even went bankrupt. And so,
for VIAGS, the risk of bad debt from customers is likely to increase and be unpredictable in
the near future. Faced with these difficulties, tightening credit standards is expected to help
the company maintain safety and stability.
2
1. PROBLEM CONTEXT
1.1 Company overview
Vietnam Airport Ground Services Company (VIAGS) is a subsidiary of Vietnam Airlines,
which was established on January 1, 2016, on the basis of merging 3 ground service
enterprises in Hanoi, Da Nang and Ho Chi Minh City including: NIAGS, DIAGS, and
TIAGS. VIAGS provide synchronous and international standard ground services to nearly 70
airline customers at 04 international airports from North to South of Vietnam. After more
than 25 years of development of enterprises and 4 years of establishment of VIAGS, the
company currently has more than 4,500 skillful staff who are professionally-trained from
basic to advanced levels along with modern equipment system which is operated according to
the highest safety and quality standards, meeting ISO 9001: 2015 and ISAGO standards.
The head office of company is located at Tan Son Nhat airport, HCM city. Currently, the
company has 3 branches including VIAGS Noi Bai, VIAGS Da Nang, VIAGS Tan Son Nhat,
and one affiliated company, which is Aviation Ground Services Co. Ltd, (AGS) with a 25%
stake.
The company's vision is to be the top of Vietnam in the field of airport ground services in the
short-term, then become the leading ranking organization providing consistent and accordant
solutions in South East Asia in 2022 and in Asia in 2027. After ten years, VIAGS will be the
leading organization for providing innovative solution in the field of ground transportation
services and business development.
The mission of the company is to provide quality aviation services in accordance with
international standards meeting the ever-increasing needs of our clients through an effective
corporate governance system and advanced resources. In addition, as a comprehensive
community, VIAGS provides innovative solutions in the aviation service industry to bring a
differentiated experience to organizations, customers, communities and society.
The organization structure is presented as following:
3
BOARD OF MANAGEMENT
CHIEF EXECUTIVE OFFICER
DEPUTY GENERAL DIRECTOR
Accounting
& Fina nce
De pa rtm e nt
Huma n
Re s ource s
De pa rtm e nt
DEPUTY GENERAL DIRECTOR
S a le s
& Ma rke ting
De pa rtm e nt
S a fe ty & Qua lity
As s ura nce
De pa rtm e nt
Tra ining
Ce nte r
S e rvice s
S ta nda rd
De pa rtm e nt
P la nning
& Inve s tm e nt
De pa rtm e nt
VIAGS NOI BAI
(VIAGS - NBA)
BRANCH
VIAGS DA NANG
(VIAGS - DAD)
BRANCH
Pa rty Orga nis a tion
& Union Office
Adm inis tra tion
De pa rtm e nt
VIAGS TAN S ON NHAT
(VIAGS - TS N)
BRANC H
Figure 1. Organization structure of VIAGS in December 2019 (Source: company
documents)
Services are offered by the company as follows:
Category of services
Core services
Supplementary services
Details
-
Passenger and baggage handling services
-
Ramp services
-
Load control and flight operation services
-
Station management services
-
Cargo and mail warehouse services
-
Executive aviation services
-
Training services
-
Repair and maintenance services
-
Baggage delivery services
-
Office and warehouse renting
-
Crew transportation
-
Personal Transceiver renting
…
Table 1. Categories of service provided by VIAGS
4
VIAGS has two types of services provided to customers. The first type is core services,
which are ground services that directly serve customer flights. Core services create the main
revenue source for the company. The second type is additional services, which are related
services and support for customer.
1.2 Problem context
Although the company has only been established for only 4 years, since 2016, on the basis of
merging 3 enterprises which are currently the branches, these branches have operated
independently for 23 years. The company's financial statements show that the net revenue
and net profit after tax grow over the years from 2016 to 2019. The figures are shown in the
following table:
Unit: million VND
2019
2018
2017
2016
Net revenue
2,204,771
2,038,983
1,851,474
1,633,127
Growth rate
108%
110%
113%
-
159,850
148,913
132,109
105,331
107%
113%
125%
-
Net profit after tax
Growth rate
(Income statement of VIAGS)
Table 2. Net revenue and net profit after tax of VIAGS
However, the growth rate of them has shown a negative sign as it decreases over the years. In
details, the revenue increased from 1,633,127 million VND in 2016 to 2,204,771 million
VND in 2019. During this period, the growth rate of revenue decreased gradually from 113%
to 108%. Similarly for profit after tax, although the value increased from 105,331 million
VND to 159,850 million VND, the growth rate has decreased sharply from 125% to 107%.
Assessing the cash flow from operating activities of the company, in general, cash flow has
grown in the last 3 years thanks to the growth of profit before tax. However, the fluctuations
of cash flow from receivables shows the bad signs that the company needs to assess. Unlike
cash flow from inventory and accounts payable, inventory cash flow has continuously
decreased over the years, reflecting that customers are tying up more capital from the
company and so the company owned less cash.
5
Unit: million VND
2019/
2018/
2018
2017
2019
2018
2017
Profit before tax
198,368
187,733
167,417
6%
12%
Decrease in trade receivables
(48,074)
(41,609)
(29,153)
16%
43%
2,231
5,883
4,174
-62%
41%
Decrease in trade payables
(35,521)
75,136
(13,504)
-147%
656%
Cash generated from operations
177,753
141,491
98,651
26%
43%
Decrease in inventories
(Cash flow statement of VIAGS)
Table 3. Cash flow from operations of VIAGS
Changes in the working capital of company over the years have shown signs that need to be
concerned which is illustrated at below table:
Unit: million VND
VIAGS
Net working capital
(million VND)
2019
2018
2017
45,187
83,598
107,618
-46%
-22%
68%
Growth rate
Table 4. Net working capital of VIAGS
After the first year the company was officially put into operation, the working capital
decreased rapidly. The working capital of 2018 has decreased by 22% compared to that of
2019. In 2019, working capital has decreased by 46% compared to 2018. Compared to
Saigon Ground Service JSC (SAGS), VIAGS's main competitor, the working capital SAGS
are larger than VIAGS and tend to increase over the years from 2016. The figures are shown
in the following table:
Unit: million VND
SAGS
Net working capital
(million VND)
Growth rate
2019
2018
2017
536,834
390,644
191,482
37%
104%
37%
Table 5. Net working capital of SAGS
The negative trend of VIAGS's working capital for 3 consecutive years has indicated the bad
symptoms that the company needs to be considered in managing it. According to the
6
literature, net working capital is defined as the difference between current assets and current
liabilities [1]. Another definition of net working capital is part of a company's long-term
capital financing current assets [1]. Positive working capital exists in a situation when the
current assets are higher than current liabilities. Overall, the operational security of a
company is ensured by positive net working capital. Management of working capital is very
important because it impacts directly on profitability of a firm [1]. Working capital
management is defined as financing current assets and managing current assets and current
liabilities of firm [2]. Working capital management is a company's short-term financial
requirement. In general, if working capital is insufficient, it leads to liquidity problems and
then it can disrupt the production process and ultimately reduce profits [3]. But on the other
hand, holding excess working capital result reduces profit because idle funds that do not
generate any return for the firm [3]. As such, effective working capital management is the
company's goal as it helps the company maintain appropriate working capital and pay off
obligations promptly. On the contrary, the inefficiency in working capital management will
bring some undesirable consequences for the company such as liquidity risk, lack of
attraction to investors, difficulty in expanding the business and risk of financial tightening
from suppliers or banks [4]. In summary, company needs to maintain an optimal level of the
components of its working capital to maximize its financial health. To gain a deeper
understanding of the cause of symptom, a working capital analysis will be conducted.
2. PROBLEM IDENTIFICATION
2.1 Possible problems
According to the working capital management definition mentioned, it involves management
decisions about important components of financial management for a firm including cash,
inventory, account receivables and payables. According to Raheman and Nasr (2007), the
cash conversion cycle (CCC) is a popular measurement of working capital management [5].
CCC is defined as the time lag between purchase of raw materials to collection of cash from
sale of good or service rendered [1]. Cash Conversion Cycle is a useful technique by which
firm can easily and quickly assess its liquidity [6]. Compared to the evaluation of liquidity
through liquidity ratios such as current ratio and quick ratio in the traditional way, CCC is a
dynamic measure of continuous liquidity management, which comprises both balance sheet
and income statement data with time dimension [6]. A longer CCC will result in greater
investment in working capital and vice versa [7]. Thus, a positive cash conversion cycle
7
indicates that the time the company is borrowing is less than the waiting time for payment
from customers [7]. In other words, the smaller cash conversion cycle is expected because it
indicates the organization has quickly recovered cash from the sale of its products. The more
cash in hand, the more liquidity the company has [6]. In contrast, negative CCC implies the
time the company receives cash from sales before they have to pay its suppliers [8]. It means
a high cash conversion cycle indicates that the company takes more time to collect cash. And
so a high cash conversion cycle is undesirable because it points to liquidity issues. In
summary, the relationship of CCC with profitability is a significant negative correlation [9].
The lower CCC is, the better for the company. In other words, the goal of firm is to minimize
its CCC, because the shorter the CCC indicates the more effective the company is in
managing its cash flow [6].
CCC has three components including days sales outstanding (DSO), days inventory
outstanding (DIO) and days payable outstanding (DPO). Cash Conversion Cycle is calculated
by deducting the payable deferral period from adding inventory conversion period and
receivable collection period [6]. So, the formula is: CCC = DIO + DSO - DPO.
The analysis results of company’s CCC and its components are shown in the following table:
Unit: days
VIAGS
2019
2018
2017
2019/2018
2018/2017
Days sales outstanding (DSO)
50
44
41
114%
106%
Days inventory outstanding (DIO)
8
11
12
73%
85%
Days payable outstanding (DPO)
24
31
34
77%
92%
Cash conversion cycle
(CCC = DSO + DIO - DPO)
34
24
20
143%
117%
Table 6. Cash conversion cycle of VIAGS
Figures show that CCC has increased significantly in the last 3 years. In 2017, the average
time for money conversion was 20 days, but by 2019, the time was 34 days, an increase of
70% compared to 2017. Thus, the time for the company to recover money has increased
sharply year by year. That shows a bad sign in the company's working capital management.
To explore further, CCC components, including DIO, DSO and DPO, will be analyzed. The
figures shows that all three components have all changed that significantly leading to the
increase of CCC. In particular, based on the correlation between CCC and its components as
8
well as the fluctuations of these components, it can be seen that the fluctuations of DIO has a
positive impact on CCC while the fluctuations of DSO and DPO have a negative impact.
The efficiency ratios of the company's main competitors and graphs comparing these
indicators between the two companies over the years are shown in the following:
Unit: days
SAGS
2019
2018
2017
2019/2018
2018/2017
Days sales outstanding (DSO)
56
53
58
106%
91%
Days inventory outstanding (DIO)
3
3
3
100%
100%
Days payable outstanding (DPO)
21
26
26
81%
100%
Cash conversion cycle
(CCC = DSO + DIO - DPO)
38
30
35
127%
86%
Table 7. Cash conversion cycle of SAGS
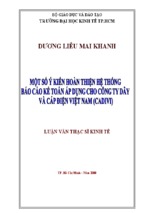
Figure 2. Fluctuations in DSO, DIO and DPO of VIAGS and SAGS over the years
The figures and graph indicate that the fluctuations of competitors' days sales outstanding,
days inventory outstanding and days payable outstanding are quite stable, most of which are
lower than that of VIAGS in each year. Accordingly, DIO is defined as the time taken to
convert inventory held into sales [1]. Cost of inventory tends to increase if inventory period
(DIO) increases [10]. Therefore, the purpose of inventory management is to minimize these
costs without causing disruption in the production [1]. The DIO of VIAGS has been steadily
declining for the past 3 years, from 12 days in 2017 to 9 days in 2019. This is a good signal in
9
inventory management. However, the proportion as well as the fluctuations of DIO for CCC
is relatively small compared to the other two components. Therefore, although having a
positive impact on CCC, DIO cannot compensate for the negative impact from these two
indicators.
2.1.1 Poor account receivable management
Receivables management is defined as the actions of sellers to balance the attraction of new
customers by loosening trade credit policies and limiting the risk of allowing late payments
from unreliable buyers [11]. The management decisions of the seller shape the level and
quality of receivables [11]. The accounts receivable management must be based on three
main factors including the trade credit term which is the maximum delay possible in the
payment of customers; time of payment by cash discount of customers; and the cash discount
rate. In particular, the maximum time to delay payment for customers is also the maximum
period of the account receivable cycle for the company. The management of accounts
receivable directly affects firm performance. When accounts receivable are kept at a level
that offers an advantage over a drawbacks, the company's performance will increase.
Receivables management requires a careful consideration. In the event that the seller has too
much money bound in accounts receivable due to an extreme free trade credit policy, it will
cause a burden on the company due to higher costs of accounts receivable service It is the
additional cost generated by bad debts from risky customers. [11]. However, the benefit it
brings is increased capital inflows from cash revenue. In contrast, more restrictive policies
have lower costs due to smaller operating costs for managing receivables, but they carry a
higher operational risk.
In term of the DSO, which is defined as the average number of days from the moment that
firm issues the sales invoice until receiving of the payment [9]. Dhar, Saptarshi. (2018) stated
that increase in DSO generally reflects poor collection efforts [1]. In other words, a negative
association between the account receivables and profitability of the firm indicates that a
higher level of accounts receivables lead to an increase of the cash gap, and then reduce the
working capital [15]. Therefore, it’s favorable for the companies to minimize the level of the
receivables collection period to maximize the shareholder’s wealth [15]. The days sales
outstanding in 2017 was 51 days, this number has increased sharply to 71 days in 2019.
Within 3 years, the average time to collect payment from customers after sales of the
company has increased to 39%. Thus, the company's fluctuations in DSO have shown
inefficiencies in account receivable management.
10
2.1.2 Poor account payable negotiation
Payable accounts represent a company's obligation to pay a short-term debt to its creditors or
suppliers [12]. Thus, the account payable is a payment of short-term debt that the company
needs to pay to avoid default. In fact, accounts payable is often seen as a secondary action
when businesses seek to develop or build a competitive advantage. That is, it is not a central
issue, but instead, it is only ranked behind in management's competing priorities of the
company [13]. However, when optimizing working capital, increasing payables should be
considered as a core strategy [13]. Many businesses tend to extend the maturity of their
accounts as long as possible because this has the obvious benefit for businesses that
maximize the free cash flow. However, this approach is not always effective. The reason for
this is that delaying payments may reduce supplier goodwill, leading to supplier troubles such
as tight payment terms, longer delivery times and the longer respond to the requirements
[13]. On the contrary, early payment can bring significant benefits such as a discount applied
by the supplier for early payment.
The third component of CCC is DPO, which is defined as the time lag between arrival of
stock to the company and payment of cash to suppliers for the materials [1]. A higher value
of DPO implies that the company takes longer to pay its bills, so it can retain the available
funds for a longer duration, meaning the company can hold more working capital [16].
However, if payment period is too high, it may cause suppliers dissatisfaction, leading to loss
of good suppliers. In addition, the company may lose trade incentives applied when the
company pays early. Therefore, the management of reasonable payment times is the goal of
companies to balance between fulfilling payment responsibilities to suppliers and optimizing
working capital. In the case of VIAGS, DPO has gradually decreased over the years: 34 days
in 2017 and 24 days in 2019. Within 3 years, the average time to take payment to suppliers
has decreased by 29%. One of the main reasons for this decline is that in 2019, the company
terminated a high-value contract with the supplier. The value of the contract accounts for
about 11% of the total short-term trade accounts payable. The decline of the short-term trade
accounts payable has led to a decline in DPO.
2.1.3 Overinvestment in equipment
An organization that wants to make a profit needs investment. Investment is presented
through the purchase of an asset or an item for the purpose of generating income. Investing is
not about trading goods or services today, but about making a profit in the future. Thus,
11
investment is defined as spending money to buy an asset or to work to start a project, and put
them into operation with the goal of generating income and increasing value over time [14].
Forms of investment include assets, credit, real estate and financial markets. The investment
is aimed at future income, so it also carries risks. Specifically, the risk comes from the
investment not pan out or falls short.
With more than 25 years of existence and development, along with long-term vision and
goals, after being incorporated and officially put into operation in 2016 the company has
focused on investing in equipment that directly serves its business to increase productivity
and competitiveness. In 2019, the company's net working capital was negative, indicating
that the company used working capital to invest in long-term assets. In particular, equipment
procurement accounted for the largest proportion. Within 3 years, the value of equipment has
increased by 149%. The residual value of the equipment at the end of the years from 2016 to
2019 is shown in the table below:
Unit: million VND
2019
2018
2017
2016
Fixed Assets
393,540
272,023
239,075
191,798
Equipment
218,526
104,182
87,643
39,506
Table 8. Fixed assets of VIAGS
From the above analysis, it can be seen that there are three possible problems leading to a
decline in working capital that the company is facing. They are ineffective management of
account receivables, non-optimization of paying suppliers, and unsuitable investment in
equipment.
12
Trade credit
policy
Liquidity risk
Bad debts
Ability to assess
bad debt of
employees.
Poor accounts
receivable
management
Lack of
attraction to
investors
Decreasing in
working capital
Communication
with customers
Poor account payable
negotiation
Ending a big
supplier contract
Overinvestment in
equipment
Taking early
settlement
discounts
Difficulty in
expanding
business
The risk of
financial
tightening from
suppliers / banks.
Figure 3. The initial cause-effect map
2.2 Main problem validation
Overinvestment in equipment
At VIAGS, strong investment in equipment over the past 3 years has adversely affected the
company's working capital. To find out the reason for this investment, an in-depth interview
with the Mr. Hung – the General Manager of Planning and Investment department - was
conducted. He said the establishment of the company has restructured the operation model of
the three enterprises before. Thereby also changing the relationship between the parent
company - Vietnam Airlines and VIAGS. Including the provision of equipment for business
operation. Specifically, in the past, the parent company was in charge of procurement and
then handed over the equipment to factories for use. Therefore, this cost belongs to the parent
company. After VIAGS was established, the parent company did not purchase equipment for
VIAGS anymore, instead the company had to make the purchase by itself. That explains the
significant investment in equipment in recent years. In order to ensure service provision,
long-term development and increase competitiveness, this investment is considered
mandatory and prerequisite. Therefore, overinvestment is not considered as one of the
problems causing the decrease in working capital.
13
Poor account payable negotiation
As mentioned, the company's days payable outstanding decreased over the years. In 2018
compared to 2017, the average payment time for suppliers decreased by 8%. In 2019, the
decrease was 23% compared to 2018. The main reasons for this decline is that in 2019, the
company terminated a high-value contract with the supplier. The value of the contract
accounts for about 11% of the total short-term trade accounts payable. The decline of the
short-term trade accounts payable has led to a decline in payable accounts, and thereby
reducing the days payable outstanding. In addition, the fluctuation of days payable
outstanding within 24 - 34 days is consistent with the payment time agreed in all contracts
with suppliers, usually from 20-30 days. The decrease in days payable outstanding also
shows the efforts of company in fulfilling payment obligations to suppliers. Therefore, the
decline of days payable outstanding, although affecting cash conversion cycle, is not
considered as a problem of the company.
Poor accounts receivable management
Currently, in the company's customer structure, there are two main customer groups. The first
group consists of the parent company – Vietnam Airlines and the companies that are
subsidiaries or afiliates of VNA. The second group is the foreign airlines that VIAGS is
providing ground services for.
Assessing the age of account receivables of each group at December 31, 2019, the figures are
shown in the table below:
Unit: million VND
1 to 30 days
31 to 60 days
61 to 90 days
90 days to
6 months
Over 6
months
Total
Group 1
92,355
130,677
5,675
-
-
228,707
% / Total
40%
57%
2%
0%
0%
Group 2
40,260
73,641
6,825
2,424
-
% / Total
33%
60%
6%
2%
0%
123,150
Table 9. The account receivables aging of VIAGS
The figures indicated that the company is having difficulty in controlling the time to collect
money from account receivables of both customer groups. The age of accounts receivables of
the two groups is most concentrated at 31 to 60 days level: 57% of group 1 and 60% of group
14
2. The second largest age group is 1 to 30 days level. In this, group 1 has 40% accounts and
group 2 has 33%. Age from 61 to 90 days has 2% of group 1 and 6% of group 2. In addition,
while group 1 has no account receivables from 90 days to 6 months level, group 2 has 2% at
this. In summary, receivables from customers in group 2 are older than group 1.
The accounts receivable structure of the two groups of customers over the year is shown in
the following table:
Unit: million VND
Short-term trade
2019
% / Total
2018
% / Total
2017
% / Total
Group 1
228,707
65%
178,720
71%
176,410
74%
Group 2
123,150
35%
74,366
29%
61,679
26%
Total
351,857
100%
253,085
100%
238,089
100%
receivables
Table 10. Short-term trade receivables structure by customer groups
Figure 4. Fluctuations in short-term trade receivables of customer groups over the years
Figures and graphs show that the proportion of group 2's account receivables to total shortterm trade receivables has increased over the year (26%, 29%, 35%). In contrast, the
proportion of group 2 has decreased (74%, 71%, 65%). Thus, along with the increase in
short-term trade receivables, it can be seen that the account receivables of group 2 had a
higher growth rate than group 1 so it has increased faster than group 1. Moreover, the
15
increased value after 3 years of group 2 is also greater than that of group 1 (61,471 vs 52,297
million VND).
In summary, the company is having difficulty in managing and controlling the amount of
accounts receivable and the time to recover money from customers, especially the customer
group is foreign airlines. This is the main problem that causes inefficiencies in working
capital management.
2.3 Main problem definition and its consequences
2.3.1 Main problem definition
Accounts receivable is the amount owed to a company as selling its goods or services to
customers on credit [17]. Typically companies sell goods and services to customers in both
cash and credit. In particular, cash is always preferred because when paying cash means
customers have fulfilled their obligations to the company. In contrast, when selling with trade
credit, the company will not receive money from the customer immediately unless and until
the account is collected. However, competitive pressure forces the companies to provide
credit to attract customers. In other words, although handling receivables need to cost more, it
also brings an important benefit that is increasing sales [17]. The application of trade credit
requires the establishment of receivables. Receivables represent credit sales that the company
has not yet collected from customers. Only when customers complete these payments, the
company can settle this account, if customers do not pay, a bad debt will occur.
Thus, when a receivables is created, there will be both good and bad points. The good point is
the company has more sales and customers. The bad point is that the company cannot collect
the money immediately and there is a risk that it cannot be collected. That requires the
company to have a system to manage the accounts receivable. The objective of receivables
management is to maximize the company's profitability by achieving a balance between
liquidity and risk [18]. Cash flow is very important for the company because it is the engine
that drives the business to operate and grow, but overdue accounts can act as the brakes that
stop the engine [18]. Therefore, it requires accounts receivable should be managed efficiently
so that the business of the company would not be constrained. Effective receivables
management and the ability to collect credits are a prerequisite for a company to sell on credit
without compromising its liquidity.
16
- Xem thêm -