VNU UNIVERSITY OF SCIENCE
TECHNISCHE UNIVERSITÄT DRESDEN
EAM SAM UN
HOUSEHOLD ORIENTED APPROACH FOR THE OPTIMIZATION
OF RESOURCES MANAGEMENT AT THE FLOATING VILLAGE
IN TONLE SAP LAKE REGION, CAMBODIA
MASTER THESIS
Hanoi - 2011
VNU UNIVERSITY OF SCIENCE
TECHNISCHE UNIVERSITÄT DRESDEN
EAM SAM UN
HOUSEHOLD ORIENTED APPROACH FOR THE OPTIMIZATION
OF RESOURCES MANAGEMENT AT THE FLOATING VILLAGE
IN TONLE SAP LAKE REGION, CAMBODIA
Major: Waste Management and Contaminated Site Treatment
Code:
MASTER THESIS
SUPERVISOR: DR. ING. CATALIN STEFAN
RESP. PROFFESOR: PROF. DR. RER. NAT DR. H. PETER WERNER
Hanoi - 2011
ACKNOWLEDGEMENTS
My highly appreciation wishes to acknowledge to Dr. Ing. Catalin Stefan, Institute for Waste
Management and Contaminated Site Treatment at the TU Dresden, provided me a great support
for making this paper possible and I also contribute of my thanks to alls as following in the
accomplishment of this paper existing;
•
To Prof. Dr. –Ing. Habil. Dr. h. c. Bilitewski and Prof. Dr. Nguyen Thi Diem Trang, who
established the cooperation Master program on “Waste Management and Contaminated
Site Treatment”
•
To DAAD Hanoi provided me full support for both living allowance and tuition fee for
duration 2 years of study.
•
To Prof. Dr. Le Thanh Son, Vice Dean at the Faculty of Chemistry, at the Hanoi
University of Science always provided me a support.
•
To all professors, lecturers, and colleagues at the Hanoi University of Science and the
Institute for Waste Management and Contaminated Site Treatment, at the TU Dresden for
all the important assistances.
•
To Dr. Carly Starr who kindly revised this paper with grammar and structures.
•
To very supportive lovely parents, brothers, and sister, for encouragement and
inspiration.
i
TABLE OF CONTENTS
ACKNOWLEDGEMENT ………………………………………………………………………...i
TABLE OF CONTENTS……………………………………………………………………….. .ii
ABBREVIATIONS……………………………………………………………………………….v
LIST OF FIGURES………………………………………………………………………………ix
LIST OF TABLES ………………………………………………………………………………xi
LIST OF ANNEXES…………………………………………………………………………….xii
ABSTRACT………………………………………………………………………………….....xiii
Chapter I
Chapter II
INTRODUCTION ………………………………………………………………..1
I.1
Tonle Sap Lake Region……………………………………………………1
I.2
Poverty in Tonle Sap Lake Region………………………………………..2
I.3
Objectives of Study ……………………………………………………….4
ASSESSMENT OF HUMAN AND ENVIRONEMNAT RELAVANT
FACTORS ………………………………………………………………………..5
II.1
Data Mining and Collections……………………………………………...5
II.2
Socio-Economic Factors……………………………………………….….5
II.2.1 Occupation and Income……………………………………….…..5
II.2.2 Education………………………………………………………….7
II.2.3 Sources of Energy for Consumption………………………………7
II.2.4 Human Health …………………………………………………….9
II.2.5 Environmental Pollution…………………………………………10
II.2.6 Land Use Classification………………………………………….10
II.3
Drinking Water Supply and Quality……………………………………..12
II.3.1 Sources of Drinking Water Supply………………………………12
ii
II.3.2 Water Quality in the Tonle Sap Lake …………………………...13
II.4
Household Water Treatment Systems (HWTS), Effectiveness and Cost
Analysis…………………………………………………………………..15
II.4.1 Solar Disinfection (SODIS)……………………………………...16
II.4.2 Boiling Water……………………………………………………17
II.4.3 Flocculation………………………………………………………18
II.4.4 Simple Sand Filter (SSF)………………………………………...19
II.4.5 Chlorination……………………………………………………...20
II.4.6 Sedimentation……………………………………………………21
II.4.7 Ceramic Filter …………………………………………………...21
II.4.8 Bio-sand Filter …………………………………………………..23
II.4.9 Effectiveness of HWTS………………………………………….26
II.4.10 Cost Analysis of HWTS…………………………………………28
Chapter III
II.5
Domestic Waste Generation …………………………………………….29
II.6
Sanitation Facilities……………………………………………………...33
DEVELOPMENT OF A CONCEPT FOR THE OPTIMIZATION OF
RESOURCES MANAGEMENT ……………………………………………….35
III.1
Optimization of Resources Management………………………………..35
III.2
Development of a Technical Concept for Safe Drinking Water Supply and
Sanitation for Household-scale…………………………………………..35
III.2.1 Simple Sand Filter (SSF) and Solar Disinfection (SODIS)……...35
III.2.2 Sanitation ………………………………………………………..38
III.3
Development of Waste Management Concepts and Resource
Recovery………………………………………………………………....40
III.3.1 3Rs Approach for Organic Waste Management and Agriculture
Waste……………………………………………………………..40
III.3.2 Composting………………………………………………………41
iii
III.3.3 Biogas Production……………………………………………….42
III.3.4 Char Briquette Production……………………………………….43
III.4
Development of Socio-Economic………………………………………..46
III.5
Quantification of the Environmental Impact of Technical and SocioEconomic Developments………………………………………………...50
III.5.1 Composting………………………………………………… …...50
III.5.2 Biogas Production………………………………………………...53
III.5.3 Char Briquette…………………………………………………….56
Chapter IV
CONCLUSIONS………………………………………………………………...58
IV.1 Socio-Economic Development……………………………………………..58
IV.1.1 Household’s Income……………………………………………...58
IV.1.2 Household Cost Expenditure…………………………………….59
IV.1.3 Household’s Time Expending…………………………………....60
IV.2 Household’s GHG Emission …………………………………………….…61
REFERENCES ………………………………………………………………………………….62
ANNEXES……………………………………………………………………………………….65
iv
ABBREVIATIONS
Acronyms
3Rs
: Reuse, Recycle, and Reduce
ADB
: Asia Development Bank
AUNP
: Asian EU-University Network Program
AWWA
: American Water Works Association
BSF
: Bio-sand Filter
Ca+2
: Calcium ion
CAWST
: Center for Affordable Water and Sanitation Technology
CDC
: Center for Disease Control and Prevention
CFSP
: Cambodian Fuelwood Saving Project
CH4
: Methane
CHLs
: Chlordances
Cl-
: Chloride
CO
: Carbon monoxide
CO2
: Carbon dioxide
COD
: Chemical Oxygen Demand
CWP
: Ceramic Water Purifier
DDT
: Dichlorodiphenyltrichloroethane
DNA
: Deoxyribonucleic acid
DO
: Dissolved Oxygen
EAWAG
: Swiss Federal Institute of Aquatic Science
EJF
: Environmental Justice Foundation
v
Fe+3
: Iron ion
GHG
: Green House Gas
H2
: Hydrogen
H2O
: Water
HCB
: Hexachlorobenzene
HCHs
: Hexachorinated hydrocarbons
HWTS
: Household Water Treatment System
IDE
: International Development Enterprise
IGES
: Institute for Global Environmental Strategies
IPCC
: Intergovernmental Panel on Climate Change
JICA
: Japan International Cooperation Agency
K+
: Potassium ion
LPG
: Liquefied Petroleum Gas
Mg+2
: Magnesium ion
Na+
: Sodium ion
NaOCl
: Sodium hypochlorite
NBP
: National Biogas Program
NIS
: National Institute for Statistic
NOx
: Nitrogen Oxide
O2
: Oxygen
OCs
: Organo-chlorines
PAHO
: Pan American Health Organization
PCBs
: Polychlorinated bi-phenyls
PCE
: Parliamentary Commissioner for the Environment
PET
: Poly Ethylene Terephthalate
vi
POPs
: Persistent Organic Pollutants
POU
: Point of Use
RACHA
: Reproductive and Child Health Allience
RO
: Reversed Osmosis
SANDEC
: Department of Water and Sanitation in Developing Countries
SO4-2
: Sulfate ion
SODIS
: Solar Disinfection
SSF
: Simple Sand Filter
TCPMe
: Tri 4-chlorophenyl methane
TN
: Total Nitrogen
TP
: Total Phosphorus
TSS
: Total Suspended Solid
UNDP
: United Nations Development Program
UNEP
: United Nations Environment Protection
UNICEF
: United Nations for Children’s Fund
USAID
: United States Agency for International Development
UV
: Ultra violate
Vol
: Volume
WaterSHED
: Water Sanitation Health Environment Development
WHO
: World Health Organization
vii
Dimensions
µg/L
: Microgram per litter
asl
: Above sea level
g/m3
: Gram per cubic meter
gCH4/kg waste
: Gram methane per kilogram waste
ha
: Hectare
Kg/hh/yr
: Kilogram per household per year
Kg/p/d
: Kilogram per capital per day
Km2
: Square kilometer
L/d
: Litter per day
L/hh/d
: Litter per household per day
L/min
: Litter per minute
M
: Metter
mg/L
: Milligram per litter
mm/yr
: Millimeter per year
ng/g
: Nanogram per gram
pH
: Percentage of hydrogen
t TN/yr
: Ton Total Nitrogen per year
t TP/yr
: Ton total phosphorous per year
t/yr
: Ton per year
TCO2E
: Ton carbon dioxide equivalent
US$/ha
: US Dollar per hectare
US$/hh/yr
: US Dollar per household per year
viii
LIST OF FIGURES
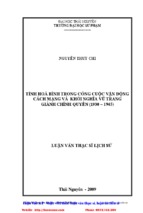
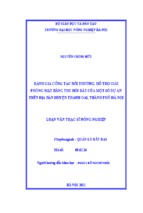
Figure 1: Tonle Sap Lake Region with five zones classification……………………………..…2
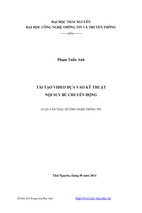
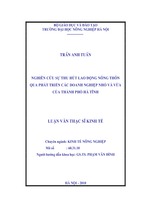
Figure 2: Scheme of cycle of poverty and sanitation……………………………………………3
Figure 3: Occupation among population in the Tonle Sap Lake Region by percentage………...6
Figure 4: Income from sectors in the Tonle Sap Lake Region by percentage…………………..6
Figure 5:
Education Level in the Tonle Sap Lake Region…………………………………………..7
Figure 6: Sources of energy for cooking……………………………………………………...…8
Figure 7: Sources of energy for lightening…………………………………...…………………9
Figure 8:
Sources of drinking water…………………………………...…………………………12
Figure 9:
Solar Disinfection …………………………………...………………………………...16
Figure 10: Simple Sand Filter.………………………...………………………………………...19
Figure 11: Ceramic Water Purifier (CWP) …………………...………………………………...22
Figure 12: Bio-sand filter design components…………………………………………………..24
Figure 13: Comparative cost production of HWTS per household per year. …………………...29
Figure 14: Characterization of domestic waste in Siem Reap Province…………………………30
Figure 15: Toilet Facility in Tonle Sap LakeRegion…………………………………...…..……34
Figure 16: Comparison of time spending between baseline–boiling water and optimizedSODIS/SSF…………………………………...…………………………………...…36
Figure17: Comparison of cost production between baseline-boiling water and optimizedSSF/SODIS……………………...…………………………………...………………37
Figure 18: GHG Emission from baseline-boiling water and optimized-SODIS/SSF ……..……37
Figure19: Complete single pit…………………………………...……………………………….39
Figure 20: Nutrient recovery from human waste…………………………………...……………39
Figure 21: Schematic of composting equation………………………………...……………….…….41
ix
Figure 22: Conversion of organic material without oxygen………………………………..…...42
Figure 23: Influence factors on biogas and methane yield……………………………….…...…43
Figure 24: Kiln for powder making with burning process……………………………….…...…44
Figure25: Powder compressor for briquette making…………………………………...…..……44
Figure 26: Paper brick maker from paper waste …………………………………...……………44
Figure 27: Material balance of mushroom growthsectors………………………………..…...…47
Figure 28: Comparison of income between baseline- farming, baseline-fishing, baseline-service,
baseline-trade and optimized-mushroom………………………...……………..……49
Figure 29: Comparison of mass reduction within baseline- before and optimized-after mushroom
Growth…………………………………...………………………………….....……50
Figure 30: Cost benefit of compost per ton…………………………………...…………………51
Figure 31: Default value of GHG emission from composting gCH4/kg waste …………………51
Figure 32: Comparison of rice yield between baseline scenario and optimized scenario ………53
Figure 33: Capital cost of biogas systems in Cambodia …………………………………...……54
Figure 34: Comparison cost analysis between firewood and biogas………………………….…54
Figure 35: Comparison time spending for cooking and firewood consumption baseline scenario
and optimized scenario of biogas system……………………..……………………...55
Figure 36: GHG Emission from baseline-firewood and optimized biogas for cooking…………56
Figure 37: Comparison of expense for baseline-firewood and optimized-char briquette…….…57
Figure 38: Comparison of GHG emission between baseline-firewood and optimized- char
briquette…………………………………...…………………………………...….…57
Figure 39: Income generation between baseline and optimized scenario………………………..58
Figure 40: Cost expenditure from household indicators…………………………………………59
Figure 41: Household’s time spending for fuel cooking and water supply between baseline and
optimized scenario………………………………………………………………...…60
Figure 42: GHG emission from each household……………………………………………….61
x
LIST OF TABLES
Table1: Land use classification …………………………………...………………………….....11
Table 1: Water quality parameters in the Tonle Sap Lake………………………………...…….14
Table 3: Summary of potential effective by HWTS…………………………………...………...28
Table 4: The volume and nutrient loading of water consumption in household (g/m3) ………..31
Table 5: Human waste flow…………………………………...…………………………………32
Table 6: Agricultural waste generation from Zone 1, Zone 2, Zone 3, and Zone 4 ………….…33
Table 7: Characteristics of biogas composition…………………………………...……………..42
Table 8: Fuel Characteristics…………………………………...………………………………..45
Table 9: Economic characteristic of mushroom production during 6 moths………………...…..48
xi
LIST OF ANNEXES
Annex1-Socio-economic indicators…………………………………………………………….. 65
Annex1-1 Components of Service Occupation in the region……………………………65
Annex 1.2 Income from fishing………………………………………………………….65
Annex 1.3 Income from farming………………………………………………………65
Annex1.4: Income from trade…………………………………………………………66
Annex15: Income from services…………………………………………………………66
Annex 1.6: Income generation from total zones…………………………………………67
Annex 1.7: Income generation from total zones by percentages………………………...67
Annex2: Sources of energy consumption………………………………………………………..68
Annex2.1: Energy for cooking…………………………………………………………..69
Annex2.2: Energy for lightening………………………………………………………...69
Annex3: Drinking Water Supply –cost estimation ……………………………………………..70
Annex4: Fuel consumption and emission factors by household (Calculation by Shipbuilding
GHG Emission Inventory Tool)…………………………………………………………70
Annex5: Agricultural and household waste materials …………………………………………..71
Annex6: Drinking Water Quality Index ………………………………………………………...73
Annex 7: Household water treatment system (HWTS) for drinking water……………………...74
Annex 8: Sanitation facility……………………………………………………………………...74
xii
ABSTRACT
Tonle Sap Lake is known as a rich in natural resources where it engages the high population
contribution throughout the floodplain up to 1.2 million and approximately 4.2 million in total of
the region, and makes up the distribution density in average 58 persons per square kilometer.
Due to the high proportion of population depend on existing resources; fishing and farming are
majority of region up to 70%, and has resulted 42.8% living in the poverty in the area. A large
number of floating villages in floodplain live in low income generation from farming and
fishing; likewise, inadequate to access safe water supply, lack sanitation system, and poor
understanding of environmental impacts, the Tonle Sap Lake basin is alarming to call for the
sustainable management in terms of human health, socio-economic, and environmental issues.
Thus, the purpose of this paper is analysis of human and environmental relevant factors includes
socio-economic, drinking water, sanitation system, and domestic waste. Based on this relevant
factor analysis, the key tasks are to develop a concept for optimization of household oriented
resources and compile the oriented guideline for local community use. As a result, it is indicated
that mushroom is feasible option for socio-economic development up to 10,210 US$/hh/yr
compare to baseline scenario comprised only 2,732.75US$/hh/yr or 5 times increasing. The
optimization scenario for the drinking water supply is SODIS and SSF, sanitation is dry toilet
with single pit or bucket, and waste management is compost, biogas, and char briquette. Those
methods are recommended to use in the basin due to their not only low cost production, but also
flexible, less time spending, and environmental- friendly. In average of cost expenditure from
each household is estimated that 107.5US$/hh/yr and it is reduced to 71.96US$/hh/yr
respectively. Time spending is also significantly reduced regarding to the optimization scenario
up to 935.5hrs/hh/yr if compare to the baseline scenario 1498.5hrs/hh/yr. GHG emission from
household oriented are 6.42TCO2E/yr, whilst, the application of the optimized scenario is
reduced to 0.59 TCO2E/hh/yr.
xiii
Chapter I INTRODUCTION
I.1
Tonle Sap Lake Region
Tonle Sap Lake is known as a largest lake in Southeast Asia. It lies on the central plain of
Cambodia where it covers 85 620km2 of land (Figure 1). The lake connects to the Mekong River
by the Tonle Sap River which is 120km long (Sokhem, P., & Sunada, K., 2006). As a complexity
of flowing and inter-linkage, the lake changes in size and volume depending on the season.
During the wet season, the depth of the lake can rise from 1m up to 10 m. Meanwhile, the
surface area enlarges from 2500km2 up to 15 000km2, extending the lake over the floodplain
consisting of flooded forests, shrubs, and rice field (Keskinen, M, 2006). The variation of water
volume in the lake is influenced by the increasing water level from the Mekong River where it
causes reversed flow of the Tonle Sap River during the wet season. During the dry season, the
Tonle Sap Lake is reversed again and starts to empty into Mekong River.
The extraordinary water regime of the Tonle Sap Lake and Tonle Sap River has provided
occasionally to biodiversity and highly productive aquatic food chain. The migration of various
fish species and aquatic animals between the Tonle Sap Lake and the Mekong River is highly
remarkable due to the suitable conditions for feeding food, breeding and nursing in the flooded
forest or shrubs. The adult fish or aquatic animals might be moved to the Mekong River or
habitant in the lake throughout the year (Lamberts, 2006). More than 1.2 million people live in
the floodplain by deeply depending on the fishery and other existed resources. Furthermore, it is
estimated that an approximately half of total country’s population is direct or indirectly
beneficially from the lake’s resources. Though, the rich of fisheries, forestry and water sources
that encourages the high opportunity for floating rice, seasonal rice cultivation and aquaculture, a
large number of population still live in a poverty.
1
Figure 1: Tonle Sap Lake Region with five zones classification ( Joha, S. and J. Koponen, 2003)
I.2
Poverty in the Tonle Sap Lake Region
Despite of the abundant natural resources, livelihoods in the Tonle Sap Lake region is known as
the poorest part of the country due to the strong dependences on the existing resources in the
area, and more than 70% of labor force employs in agriculture. Rich in resources, it is engaged
higher proportion of population in floodplain more than 1.2 million and more than 4.2 million in
the Tonle Sap Lake region. However, the high dependence on natural resources for daily
livelihoods has resulted in 42.8% of the population live in poverty in the basin (Malin. M, 2009).
The high poverty rate in this area is partially from unequal access to natural resources,
insufficient rights for land usage, and less opportunity to increase productivity (Keskinen, M,
2006). Living with a low income generation, the population lack food security and clean water;
however, it is high aspect of poor awareness to pollute water and surrounding environment from
the population. The most significantly, in the floating community in the floodplain of Tonle Sap
Lake region is appeared strongly closed to water resources for domestic consumption and
dumping site for their household waste including excreta. The high pollution is alarming, with
2
increased incidents of diarrhea, up to 22.4% in Tonle Sap Lake region (NIS, 2004), 54.1% in
children under 5 years old in case study among 123 samples in the Chong Khnea District, Siem
Reap Province (USAID and RACHA, 2009), and is the known as cause death of children under 5
in 7% of cases (WHO, 2011). 81% of households in the floating villages in the Tonle Sap basin
currently have no sanitation system (NIS, 1998), and there is a low awareness of hygiene in this
area. The high incident of diarrhea among these populations requires both water and sanitation
intervention to reduce human health risks that endangers the lives of adults and children. As
shown in Figure 2 there is a strong link between poverty and poor sanitation. The improved
sanitation may help to break the cycle by stopping human excreta entering the environment in a
way that influences human health. Overcrowded, bad drainage, polluted water, unreliable and
insufficient water supplies and poor sanitation all contribute to poor health (Rebecca. S, 2003).
Figure 2: Scheme of cycle of poverty and sanitation (Rebecca. S., 2003)
3
Given characterization of Tonle Sap Lake region, livelihoods is significantly dependent on
fisheries, forestry, water sources and rice cultivation; however, it is still high proportion living in
poverty that encourages the high rate of human health risks. Likewise, it is partially from lack of
cleaned water supply, low sanitation and hygienic promotion program, and lack domestic waste
management from household. Thus, it is an essential for this master thesis aims to address the
local resources management in terms of human health, environmental impact, and socioeconomic welfare for floating villages in Tonle Sap Lake region by analyzing of human and
environmental relevant factors including socio-economic, water supply, sanitation, and domestic
waste management. Based on these factors, it is essential to develop a concept for the
optimization of resources management. The compilation of household oriented guidelines is also
implanted for local community practices.
I.3
Objectives of Study
The terms of human health, environmental impact and socio-economic aspects, this mainly
study’s purposes are concluded into three tasks;
Task I: Analyze of human and environmental relevant sectors by focusing on socio-economic,
water supply, sanitation, and domestic waste management for household level.
Task II: The study is to develop the concepts for optimization of resources management in region
by focusing on four main indicators description in Task I and;
Task III: Compiled the oriented guidelines for best practices in local community at the Tonle Sap
Lake region.
4
Chapter II
ASSESSMENT OF HUMAN AND ENVIRONMENTAL
RELEVENT SECTORS
II.1 Data Collection
The methods of study are assessments of both human and environmental databases, focusing on
relevant factors included socio-economic, water supply, sanitation, and waste management in the
region. Database analysis based on the reports from local organizations, government, and
international organizations will be assessed. Each sector is defined by the baseline scenarios and
optimized scenarios based on indicators. In particular, time, cost, green house gas emission,
nutrient recovery, and water quality are determined for the optimization of resources.
II.2
Socio-Economic Factors
II.2.1 Occupation and Income
According to NIS (1998), employment in the Tonle Sap Lake Region is classified into
agriculture, small trade, fishing and services. Agriculture is related to rice farming, floating rice,
dry and wet rice farming and crops in which it plays the major roles in the total region (63.4%).
The trade makes up 12%, fishing 5.7% and service 5.9% (Figure 3). Small trade is the activities
of small businesses in the region and includes shops, selling fish, and other trade. Service
occupation is mentioned on the providing service sectors such as; motor taxi, boat service,
restaurants, guest house, battery charging shop, rice milling sectors, workers and other service.
The occupation varied from zone 1 to zone 5. In the zone 1, fishing activities raise up to 55%
which is higher than other zones. For zone 2, zone3, and zone 4 has found that agriculture is
significant jobs in these zones (average 80%). However, in zone 5 is the urban area, among
population preferred the provided service (30%) and trade (30%).
5
- Xem thêm -