Chapter I
OVERVIEW
1
1. REASON SELECTED THEMES:
Customer satisfaction with the product - service is a matter of survival of every
business. In today's context, the progress in terms of technology, mobile
telecommunication services are now becoming popular and indispensable for people in
everyday life. The fact that Vietnam has recently enrolled on the world map and
telecommunications global 3G map. Thereby showing the growth of the
telecommunications industry in Vietnam. Especially when there are many competitors
is the study of quality of service provided to customers of every business is essential to
retain customers as well as attract potential customers .
On 19/08/2009 , the Ministry of Information and Communications granted official
permits network settings and provides mobile telecommunications services for
Telecommunications Corporation Telecom Indochina ( Indochina Telecom ) . With this
license , Indochina Telecom became the 8th mobile network in Vietnam are allowed to
establish provider networks and mobile communications . But up to now , Vietnam's
mobile market is in the " real military war " with 4 service provider is Mobiphone ,
VinaPhone, Viettel , EVN Telecom. The battle between the mobile networks are
becoming increasingly fierce , fierce as " market share pie " was shredded and not " pie
" as before . According to the Ministry of Information and Communications, through
2012 there were 130 million mobile subscribers of all types, including mobile phone
subscribers is estimated at 110 million - more than the population (now 86
millionpeople).
However, the booming market of subscribers would create the risk of a decline in
quality, but also imply that there is a great opportunity, mobile network towering above
the quality, keep safety and stability of the network will most probably break up.
Looking at the 2013 plan of the three "big", the only new development is set in half
compared with 2012 figures. This shows that they agree well with predictions by
economists that in 2013 the mobile telecommunications market will gradually go into
saturation. The ability to increase subscriber is not high, so keep the policy will be the
mainstream of the network.
2
Being a member of Post and Telecommunications Group, Vinaphone and Mobifone
two pioneering companies in the field of mobile communications in Vietnam . An
obvious reality, though, is to go ahead, but now the market share of the mobile market
surpassed VinaPhone Viettel. Besides the emergence of new mobile networks to form
the fierce competition VinaPhone can not sit still anymore . Before such a situation,
VinaPhone to do to maintain its market share and develop in the future? With forecasts
like this, there must be action VinaPhone redirect attract subscribers by increasing the
quality of services that enhance customer satisfaction. But how to know what was the
thing that interested customers? And what factors affect satisfaction that ?
That's why I chose Research Proposal:
“Evaluation of customer satisfaction using VinaPhone”.
2. STUDY OBJECTIVES:
2.1. The overall objective:
Discover the factors affecting customer satisfaction VinaPhone use. The study
results will indicate the level of customer satisfaction for each factor and affects
satisfaction is how so that there are suggestions to improve the quality of service and
also improve high competitiveness of the company.
2.2. Specific Objectives:
- Gather the theoretical basis of customer satisfaction with general services and
mobile communication services in particular.
- To build the model, evaluation criteria and evaluation methodology of customer
satisfaction.
- Evaluate customer satisfaction about network services VinaPhone.
3. SUBJECT AND SCOPE OF THE STUDY:
- Research Subjects: Customers using the service VinaPhone.
- Scope of the Study: Ho Chi Minh City
4. METHODOLOGY:
4.1. Research Process:
Process research is designed as follows:
3
Theoretical Foundations
- Quality of service
- Satisfaction
- Gronroos model
- Model of Parasuraman
- Quality of service model
for mobile field
Official Research
Testing scale
- Assessment of Cronbach's
alpha
- Factor Analysis
Models and Scale
- Preliminary Study
- Poll
- Guide of teachers
Official Scale
Calibrate model
- Type variables correlated variables small total
- Check coefficient alpha
- Type of variable weights < 0.5
- Test the fit of the model
- Testing the hypothesis
Testing theoretical models
Testing hypotheses about differences based
on analysis of variance ANOVA
Practices
Figure 1. RESEARCH PROCESS
4.2. Research Methodology:
This research was carried out through two main steps: a preliminary study using
qualitative methods and formal research using quantitative methods .
- Qualitative research: interviewing experts to identify the factors that affect
customer satisfaction. Preliminary studies were carried out using this method to
reappraise the questions in the interview questionnaire through pilot interviews. The
purpose of this study is used to adjust the scale and additional quality mobile
communication services based on SERVPERF scale.
- Quantitative research: Research is the official research with quantitative data
collection technique is interview -based questionnaire close views, opinions of
customers about service quality mobile communication action. Complete response data
will be processed with the aid of SPSS 16.0 software .
4
Information collected will be processed by SPSS 16.0 software. Scale after being
assessed by the method reliability coefficient Cronbach 's Alpha and factor analysis
EFA discovery, regression analysis and correlation analysis of variance was used to test
the research model .
5. STRUCTURE OF TOPICS:
Part I. Overview of research
Part II. Content
The study is divided into five chapters with the following specific content:
Chapter 1: Overview of research topics.
Chapter 2: Presenting the theoretical basis of service quality and customer
satisfaction, the relationship between service quality and satisfaction, the research
model of service quality and satisfaction customers. The team hypothesize factors
affecting customer satisfaction in the field of mobile communication and provide a
research model.
Chapter 3: Presenting research methods to evaluate and test scale models of research
topics.
Chapter 4: Presentation of the results of the analysis of information, research results
are mainly based on results through the use of SPSS 16.0 software. Assessment results
collected and analyzed have been. Giving confirmed the validity of the research process
is appropriate and useful. Comment quality mobile communication services VinaPhone.
Chapter 5: Recommendations and proposed a number of policy recommendations to
increase customer satisfaction for VinaPhone.
Part III. Conclusion
Summary results of the study have been clearly stated and the limitations of the
research and studies suggest the next step.
5
Chapter II
BASE MODEL THEORY
AND RESEARCH
6
1. SERVICES:
1.1. Definition:
The service sector is seen as bringing parts intangible value to the economy.
Researchers modern marketing Kotler and Armstrong define the following service:
"Service is any act or benefit one party can offer to another party that is basically
invisible and bring ownership at all. "
1.2. Characteristics:
Service is a special product, there are many other characteristics with other
commodities. It is these characteristics make services becomes difficult to quantify and
can not be identified with the naked eye. Services include the following properties:
- Intangibility: A pure service can not be evaluated using any body senses before it is
purchased. Therefore, to reduce uncertainty, buyers will look for evidence of the quality
of service from their subjects exposed equipment ... that they see .
- Inseparability: Characterized by the service is produced and consumed
simultaneously at the same time. If someone is leasing services , the service provider
will be part of the service, whether the service provider is real people or machines.
Because customers will also be present at the services provided to the interactions
between service providers and customers is a special feature of services marketing .
- Variability: Shown in the quality of service characteristics depend on the service
provider , depending on the time, place and manner of service provided .
- Perishability: other services with normal good in that it can not be stored . In other
words, service sensitive than other conventional cargo before the change and the
diversity of needs. When needs change, companies often have difficulty service so the
service companies always find a way to match supply and demand together, such as
restaurants hire more part-time staff to served in the peak hours .
In addition to the above properties, the service can be described with the other attributes
as follows :
- Lack of transport properties can be : Services must be consumed in place of "
manufacturing " services .
- Lack of uniformity: Services are often modified to fit each client or each new
situation ( as customer request ) . The mass production is difficult for service. Both the
input and output of the process consists in the provision of services is very easy to
7
change, as well as the relationship between these processes, can make it difficult to
maintain a consistent quality .
- Need more Human Services include significant human activity, rather than on the
process correctly. Therefore, management of human resources is very important .
Human factor is often the key factor bringing success in the service industry .
- Fluctuations needs: It is difficult to predict demand. Demand can vary by season ,
time of day, the business cycle ...
- Must be present to purchase the service: Most of the service providers are required
to have a high level of interaction between customers and service providers .
2. QUALITY SERVICE:
Service quality is a concept made headlines and controversy, researchers have
difficulties in defining and measuring service quality without any consistency (
Wisniewski , 2001) .
Quality of service is defined in many different ways depending on the object of
study and research environment :
Quality of service must be judged on two aspects : ( 1 ) the process of providing
services , ( 2 ) the results of the service ( Lehtinen & Lehtinen , 1982 ) .
Grönroos ( 1984 ) also proposed two components of quality service are: ( 1 ) technical
quality, what customers get, ( 2 ) functional quality , interpretation services are
provided as How .
Quality of service is a service level that meets the needs and expectations of
customers ( Lewis & Mitchell , 1990 ; Asubonteng & CTG , 1996 ; Wisniewski &
Donnelly , 1996 ) .
Edvardsson, Thomsson & Ovretveit (1994 ) said that : quality services to meet
the service expectations of our customers and satisfy their needs .
But when it comes to quality services we can not fail to mention the huge
contribution of Parasuraman et al ( 1988.1991 ). Parasuraman & CTG ( 1988 , page 17 )
defines "Quality of service is the level difference between the expectations of the
consumers of services and their perceptions of the outcome of the service ."
Understanding quality of service is the basis for the implementation of measures
to improve the quality of service of mobile communication network. So it is not only
important in establishing development goals but also orient VinaPhone promote its
8
strengths in the best way. Service quality can be understood through its characteristics.
Considering the overall quality of services includes the following characteristics :
2.1. Superiority:
For customers, quality service is a service that demonstrates superior
"Vietnamese" your product than other similar services. And this superiority makes
Vietnam service quality to become competitive strengths of the supplier. The
superiority evaluation of service quality is influenced greatly by the comments from
people who use services. This relationship has important implications for the
assessment of service quality from customers in marketing activities and research of
customer satisfaction.
2.2. Specificity of the product:
Quality of service is the sum of surface and core essence crystallized in creating
products and services of the characteristics of products and services. Therefore, services
or products are high quality will contain many " outstanding features " than the lowlevel services. This distinction pertains to identify dominant attributes tangible product
or intangible service. It is because of these characteristics that clients can identify the
service quality of other VinaPhone with competitors . However, in practice very
difficult to identify the core characteristics of services fully and accurately. Therefore,
this characteristic does not have absolute value relative only help to identify the quality
of services in specific cases only easier .
2.3. As supply:
Quality of service associated with the process of implementation, service
delivery to customers. Therefore, the deployment of services, serving style and how
service providers will determine the quality of service is good or bad. This is the
internal factor is dependent on the expression of the service provider. Therefore, to
improve service quality, service providers first need to know to improve internal factors
to create a long-term strengths of his own in the provision of services to customers.
2.4. As satisfying:
Services are designed to meet customer needs. Therefore, the quality of service
necessary to satisfy customer needs and requirements of customers taking as a basis to
improve service quality. If customers feel that the service does not meet their needs,
they will not be satisfied with the quality of service they receive. In the modern
9
business environment, the characteristics become more and more important than ever
because the service provider must always pay attention to customer needs and try our
best to meet those needs. It would be useless and no point providing quality services
that customers are not assessed value.
In terms of customer service, "features satisfying" and includes the meaning of
"computer supply". The reason is because the quality of services starting from the
mobile network information capture needs of customers when deploying services. But
in the process of implementing the provision of services that customers will feel
satisfied or not and then feel the quality is good or bad service. If supply carries
intrinsic factor is calculated to satisfy the demand driven by external impact more.
2.5. Calculate the value creation:
Obviously, the quality of service associated with the value created to serve
customers. Services not produce all the values are not considered quality. For example,
mobile communication networks and creating customer value is the object that receives
the value. So, considering the quality of service or more specifically, the value of
giving customers depend on assessment of the client, not the network. Typically,
customers are welcome to bring value and service to compare them with what they
expect to receive.
In other words, calculate the value of quality of service also much affected by
external factors (customers) rather than internal (home network). Quality of service is a
service to create value not only meet customer needs but also to beyond the desires of
customers and make VinaPhone become more prominent competitors. Therefore, the
calculated value creation is the basic feature and is the foundation for the construction
and development of VinaPhone quality services..
3. STANDARD 68-186:2006:
STANDARD 68-186:2006 "Telephone service on mobile telecom network
ground - Quality Standards" was built on the basis of the review, additional
STANDARD 68-186: 2003 "Telephone service on mobile networks Public Land Quality Standards" issued by Decision 161/2003/QĐ-BBCVT date 30/9/2003 Minister
of Posts and Telecommunications defined as follows: "Quality of service is the result of
the aggregate indicators of the level of user satisfaction with the service for that
service."
10
Under this standard, the quality of service targets this sector is divided into two
parts as follows:
3.1. Technical quality criteria:
3.1.1. The percentage of calls are successfully established: the ratio of the number of
calls is set on the total number of successful calls ( 92%).
3.1.2. The rate of dropped calls: is the ratio between the number of dropped calls on
the total number of calls are successfully established. ( 5%).
3.1.3. Voice quality: an indicator of quality integrated voice transmission over voice
channels are determined by averaging the MOS scale from 1 to 5 according to
recommendation P.800 Telecommunication Union ITU world. ( 3,0 point).
3.1.4. Accuracy rates recorded:
a) The rate of false calls charges were recorded: the ratio of the number of calls
recorded on total freight false calls. ( 0,1%).
Calls are recorded false charges include: freight call record but no real, actual
call charges but not recorded, record calls wrong number caller or the called number,
the call charges are recorded length greater than 1 seconds in absolute value compared
to the actual length of call conversation; recorded call charges start time wrong than 9
seconds in absolute value compared to the time taken in accordance with the national
standard clock.
b) The rate of talktime charges were recorded wrong: is the ratio between the total
value of the absolute wrong time record of the call recording false charges on the total
duration of calls ( 0,1%).
3.1.5. Call rate charges, billing errors: the call rates are charged or invoiced on the
total number of false calls ( 0,01%).
Business service providers to store data within the original charging at least 180
days, including day, month, year make calls, start time, end time (or length of calls) ,
computers are called (international calls: country code, area code, number of
subscribers domestic call: zip code, number of subscribers), the cost of each call.
3.2. Quality of service targets:
11
3.2.1. Availability of services: the percentage of time that the network is willing to
provide services to clients. ( 99,5%).
3.2.2. Complaints about the quality of customer service: the dissatisfaction of clients
for business services provided by the complaint (not to exceed 0.25 complaints per 100
customers in 3 months) .
3.2.3. Feedback Customer complaints: the text of the enterprise service provider notify
customers complaint about receiving and reviewing complaints resolved (within 48
hours for 100% customer complaints complaints from the time of receiving the
complaint).
3.2.4. Customer support services: service inquiries, manuals, providing relevant
information and notify customers headquarters, telephone number, fax customer
support service (24 hours a day ).
4. RELATIONSHIP BETWEEN SERVICE QUALITY AND CUSTOMER
SATISFACTION:
4.1. The concept of customer satisfaction:
According to the concept of psychology: " Customer satisfaction is a psychological
state arising stimulate the customer has received the product or service along with its
information ."
There are many different perspectives on evaluation of customer satisfaction. Customer
satisfaction is their reaction to the perceived difference between experience and know
the expectations ( Parasuraman & CTG , 1988 ; Spreng & CTG , 1996; Terry , 2002) .
That is, the experience of the client know when to use a service and results after
services are provided. Satisfaction according to Parasuraman (1994 ) is the aggregate
result of service quality, product quality and price.
Bachelet ( 1995 ) suggested that customer satisfaction as an emotional response nature
of customer response to their experience with a product or a service.
Customer satisfaction is the key factor to sustain long-term success in business and
consistent business strategy to attract and maintain customers ( Zeithaml & CTG , 1996
).
The response is satisfactory and the evaluation of the status of customer satisfaction ,
which means that the customer satisfaction is seen as a comparison between
expectations before and after the purchase of a product or service ( Oliver , 1997).
12
According to Kotler & Keller ( 2006 ) , the satisfaction level of the status of a person
feeling comparisons derived from awareness of a product compared to his expectations.
Accordingly, satisfying the following three levels :
- If you are aware of smaller customers, customers expect to feel dissatisfied .
- If you are aware of expectations, the customer feel satisfied .
- If perception is greater than expected , the customer is satisfied or feel excited .
Motto of the company is to satisfy the business needs of the customer because the
customer revenue and profitability of the company. When customer satisfaction with
goods or services of the company, their ability to purchase goods continued very high.
Moreover, when they are satisfied they tend to speak well of the company's services to
other customers . The consumer satisfaction with services is emotional for company
business services based on each contact or dealings with that company ( Bitner &
Hubbert , 1994).
4.2. Relationship:
The relationship between service quality and customer satisfaction are the
subject of the researchers' ongoing discussed in the past decade. Many studies of
customer satisfaction in the services sector have been implemented. Some authors
suggest that between service quality and customer satisfaction coincide so these two
concepts can be used interchangeably.
However, many studies show that service quality and customer satisfaction
are two distinguished concepts . Parasuraman & CTG (1993 ), said that between service
quality and customer satisfaction are some differences exist, but the basic difference is
the issue of "cause and effect ". And Zeithalm & Bitner (2000) said that customer
satisfaction is affected by many factors such as product quality, service quality, pricing,
situational factors , personal factors.
Service quality and satisfaction , though the two concepts are different but
closely related to each other in the study of services ( Parasuraman & CTG , 1988 ) .
The previous studies have shown that quality of service is the cause of satisfaction (
Cronin & Taylor , 1992; Spreng & Taylor , 1996). The reason is that the quality of
services related to the provision of services, and satisfaction were assessed only after
using the service .
13
Customer satisfaction as a result, the quality of service as the cause, nature
satisfied forecasts, expectations, service quality is an ideal standard. Customer
satisfaction is a general concept, expressed their satisfaction at a service consumer.
While the quality of services focused on specific components of the service ( Zeithaml
& Bitner , 2000 ). But between service quality and satisfaction have been linked to each
other but little research has focused on testing the explanatory power of the components
of service quality satisfaction, especially for each industry -specific services ( Lassar et
al , 2000). Cronin and Taylor has tested this relationship and concluded perceived
service quality leads to customer satisfaction. The study concluded that service quality
is the antecedent of satisfaction ( Cronin and Taylor , 1992 ; Spereng , 1996 ) and is the
main factor affecting satisfaction ( Ruyter , Bloemer , 1997 ) .
In a nutshell , the service quality factors greatly affect customer satisfaction . If
service providers provide customers with quality products that satisfy the needs of the
network that they have started to make the customer happy. Therefore, to improve
customer satisfaction, the service providers to improve service quality. In other words,
service quality and customer satisfaction have a close relationship with each other, in
which quality of service is what sets before and decide to customer satisfaction . Causal
relationship between these two factors is the key issue in most of the research on
customer satisfaction . If quality is improved but not based on the needs of the customer
is never satisfied with customer service. Therefore, when using the service, if customers
feel the high quality services they will satisfy with the service. Conversely, if customers
perceive lower service quality is job dissatisfaction will appear.
14
5. Theoretical model:
5.1. Gronroos model:
Service
expectations
Perception of
service quality
- Traditional
factor
- Marketing
activities
- Impact
internally by
practice,
thought and
word of mouth
Image
Technical
quality
(What?)
Perceived
service
Quality
function
(What?)
Figure 2. MODEL OF GRONROOS
Gronroos (1984) model introduced service quality model to study customer
perception based on three essential points :
- First, distinguish functional quality and technical quality. The quality is
functional interactive process between customers and service providers, ie how services
are shown and supply. Quality engineering is the consequence of the operation of the
service activities, ie what the customer receives.
- Secondly, the image is of utmost importance for all providers of services
because customers can see the image and its resources during transactions.
- Third, the whole feeling of quality is a function of the perceived evaluation
of customer service and the difference between these assessments with the expectations
of their service.
5.2. SERVQUAL scale and model 5 components of service quality Parasuraman &
CTG:
Inspired by the theoretical model of Gronroos (1984), Parasuraman & CTG
(1985) developed a mixed measurement tool, called SERVQUAL, used to measure
perceived service quality. SERVQUAL scale measure service quality based on the
15
perception by customers using the service. Parasuraman & CTG (1985) said that any
services, quality of service perceived by customers can model into 10 components,
which are:
1) Reliability : say the ability to perform services on time and fit right the first time
2) Responsiveness: to speak the desire and willingness of staff to provide services
to customers
3) Competence speaks qualified to perform the service. The ability to serve
expression as staff contact with clients, direct service delivery, research
capabilities to capture relevant information needed to serve customers.
4) Access: involves facilitates ease of access to services such as shortening waiting
time, service sites and opening hours convenient for customers.
5) Courtesy speaks serve affable personality, respected, customer -friendly staff.
6) Communication: related to communication, communicated to the customer in a
language that customers easy understanding and listening on issues related to
their service as explained, costs, complaints resolved questions.
7) Credibility: the ability to talk up confidence for customers, making customers
rely on the company. This ability is reflected by its name and reputation of the
company, the personality of the service personnel to communicate directly with
customers.
8) Security related to the ability to ensure customer safety, the safety represented
by material, financial, and information security.
9) Understanding customer expressed understanding and the ability to capture
customer needs through understanding of customer requirements, interested
individuals and recognize their customers frequently.
10) Tangibles expressed through looks, outfits of the service personnel, equipment
and support services.
This model has the advantage of covering almost every aspect of the service,
however the scale showed the complexity of the measurement difficulties in the
assessment and analysis. In 1988, Parasuraman & CTG corrected and formed new
models include 5 components as follows:
1) Reliability: represents the ability to make appropriate service and on time the
first time.
16
2) Responsiveness: represents the willingness of staff to provide timely service to
customers.
3) Assurance represents professional qualifications and offering a polite, affable
with customers.
4) Empathy: showing care to each individual customer.
5) Tangibles expressed through looks, outfits of the service personnel, equipped to
serve.
The author has initiated and used qualitative research, quantitative expertise to
build and scale components of service quality. Parasuraman & CTG (1991 ) asserts that
the SERVQUAL scale complete service quality, achieve value and reliability, and can
be applied to all different types of services. However, each service industries may have
their own characteristics. Many other researchers have also tested this scale with many
types of services as well as in many other countries. The results showed that the
components of service quality is not consistent with each other in each sector and each
service different markets ( Bojanic , 1991 ; Cronin & Taylor , 1992; Dabholkar & CTG
, 1996; Lassar & CTG , 2000 , Mehta & CTG , 2000 ; Nguyen & CTG , 2003) .
Specifically Mehta & CTG (2000 ), in a study in Singapore, concluded that service
quality supermarkets include only two ingredients: organic means formation and
service personnel. Nguyen & CTG ( 2003 ) tested the SERVQUAL scale to the market
as outdoor recreation in Ho Chi Minh City showed that service quality consists of four
components : reliability, service capabilities of staff , empathy and tangible media. Due
to the nature of each type of service, so we need to adjust the SERVQUAL scale to suit
each particular study .
The basic approach is to apply the SERVQUAL factor analysis is a statistical
analysis method allows multivariate data collapse to form the primary factor in
assessing the quality of customer service. Ministry of scale consists of two parts, each
part has 22 speech. The first part aims to identify the customer's expectations for
service type of business in general . That is not interested in a particular business ,
people interviewed said their desired level of service. The second part determines
customer comments for the implementation of enterprise services survey. That is based
on the specific services of enterprises surveyed to assess. The research results in order
to realize the perceived gap between the quality of customer service by implementing
17
and enterprise customers' expectations with quality service. According to the
SERVQUAL model of service quality is defined as follows :
Quality of service = Perceived degree – The expected value
Parasuraman and confirmed SERVQUAL is an instrument measuring service
quality and reliability accurately ( Parasuraman & CTG , 1988 , 1991 , 1993). Satisfied
customers are the customer's evaluation of a product or service has met the needs and
expectations of the 5 components SERVQUAL model has been widely used (
Asubonteng et al . , 1996; Buttle , 1996; Robinson , 1999). Seems little doubt that
SERVQUAL is a commonly used tool for assessing service quality, has not been
accepted by the researchers, but it can also be used to measure service quality in many
field is probably much different than any method other quality assessment. It is used in
many fields, sectors, many organizations in many different countries : USA, UK,
Singapore, Korea, Malaysia, Kuwait ...
However, the use of quality models and distance as the basis for the evaluation
of service quality is also much debate (Carmen, 1990; Babakus & BOLLER, 1992;
Cronin & Taylor, 1992). Cronin & Taylor (1992) SERVPERF model, to the extent that
customer feel for the implementation of business services reflect the best quality of
service. Under the SERVPERF model:
Quality of service = Perceived degree
This conclusion has been agreed by other authors such as Lee & CTG (2000),
Brady & CTG (2002). Ministry of scale also uses 22 statements similar item asked
about the comments section of customers in the SERVQUAL model, skip the question
about expectations.
5.3. Component model quality services in the field of mobile communication:
Prices viewed as consumer awareness about the abandonment or sacrifice
something in order to own a product or a service ( Zeithaml , 1988 ). One of the
methods of communication ( advertising ) services outside of the price of the service (
Zeithaml and Bitner , 2000). While the impact of price on customer satisfaction at
getting the attention of researchers , rather than other factors ( Spreng , Dixon, and
Olshavsky , 1993 , Voss et al . , 1998; Bolton and Lemon , 1999; Varki and Colgate ,
2001). Zeithaml and Bitner (2000) suggested that the price of services can be a great
influence on the perception of service quality, satisfaction and value. By taking
18
products and services should be invisible is often difficult to evaluate before
purchasing, pricing is often seen as alternative tools that impact on satisfaction with
services that consumers use. Some researchers have found that there is significant
relationship between price and customer satisfaction ( Varki and Colgate , 2001; Hong
and Goo , 2003).
Therefore, the price factor mentioned when considering customer satisfaction in
terms of quality mobile communication services in the research.
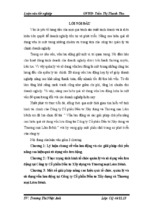
6. RESEARCH MODEL AND SCALES:
6.1. Research Model:
From the industry standard 68-186 STANDARD: 2006 "telephone service over
mobile telecommunications network ground - Quality Standards" and as the theoretical
basis, we build a model of customer satisfaction for mobile communication network
according VinaPhone SERVPERV scale consists of 5 components: Quality calls, value
Added Services, convenience, customer service and price structure. This relationship is
illustrated more clearly by the following model:
+
The call quality
+
Value Added Services
Convenience
Customer Service
+
SATISFACTION
+
Price structure
+
Figure 3. PROPOSED RESEARCH MODEL
Several hypotheses for the research model as follows:
19
H1: Composition quality customer calls are rated higher customer satisfaction with
service quality as possible and vice versa. In other words, the call quality ingredients
and customer satisfaction is related in the same direction .
H2: Ingredients added services by customers higher rates of customer satisfaction with
service quality as possible and vice versa. In other words, components and services
increase customer satisfaction relationship in the same direction.
H3: Composition customer convenience is higher evaluation of customer satisfaction
with service quality as well and vice versa. In other words, components convenient and
customer satisfaction is related in the same direction.
H4: Customer Service Composition customers rated higher customer satisfaction with
service quality as possible and vice versa. In other words, the composition customer
service and satisfaction of customer relations in the same direction.
H5: Composition customer pricing structure is higher evaluation of customer
satisfaction with service quality as well and vice versa. In other words, structural
components, price and customer satisfaction is related in the same direction.
6.2. The scale:
The study used 5 point Likert scale with 1 being totally disagree and 5 is
strongly agree. Characteristics of this scale is quantified scale. Research based on the
criteria of evaluation to conduct the statistical analysis. All scale studies concepts in
scale models are multivariate. The scale uses 5 point Likert format with:
1 point: Completely disagree
2 points: Disagree
3 points: Normal
4 points: Agree
5 points: Totally agree
20
- Xem thêm -