E1FTOC
09/15/2010
11:10:55
Page 10
E1FFIRS
09/09/2010
14:58:33
Page 1
Theory and Design for
Mechanical Measurements
Fifth Edition
Richard S. Figliola
Clemson University
Donald E. Beasley
Clemson University
John Wiley & Sons, Inc.
E1FFIRS
09/09/2010
14:58:34
Page 2
ACQUISITIONS EDITOR
PRODUCTION EDITOR
PRODUCTION SERVICES MANAGER
SENIOR MEDIA EDITOR
SENIOR MARKETING MANAGER
SENIOR DESIGNER
Linda Ratts
Anna Melhorn
Dorothy Sinclair
Tom Kulesa
Christopher Ruel
Wendy Lai
This book was set in 10/12 Times Roman by Thomson Digital and printed and bound by RR Donnelley,
The cover was printed by RR Donnelley.
1
This book is printed on acid free paper. �
Founded in 1807, John Wiley & Sons, Inc. has been a valued source of knowledge and understanding for more than 200 years, helping
people around the world meet their needs and fulfill their aspirations. Our company is built on a foundation of principles that include
responsibility to the communities we serve and where we live and work. In 2008, we launched a Corporate Citizenship Initiative, a global
effort to address the environmental, social, economic, and ethical challenges we face in our business. Among the issues we are addressing
are carbon impact, paper specifications and procurement, ethical conduct within our business and among our vendors, and community
and charitable support. For more information, please visit our website: www.wiley.com/go/citizenship.
Copyright # 2011 John Wiley & Sons, Inc. All rights reserved.
No part of this publication may be reproduced, stored in a retrieval system or transmitted in any form or by any means,
electronic, mechanical, photocopying, recording, scanning, or otherwise, except as permitted under Sections 107 or 108 of the
1976 United States Copyright Act, without either the prior written permission of the Publisher, or authorization through
payment of the appropriate per-copy fee to the Copyright Clearance Center, Inc., 222 Rosewood Drive, Danvers, MA 01923,
(978)750-8400, fax (978)750-4470 or on the web at www.copyright.com. Requests to the Publisher for permission should be
addressed to the Permissions Department, John Wiley & Sons, Inc., 111 River Street, Hoboken, NJ 07030-5774, (201)748-6011,
fax (201)748-6008, or online at http://www.wiley.com/go/permissions.
Evaluation copies are provided to qualified academics and professionals for review purposes only, for use in their courses during the next
academic year. These copies are licensed and may not be sold or transferred to a third party. Upon completion of the review period,
please return the evaluation copy to Wiley. Return instructions and a free of charge return shipping label are available at www.wiley.com/
go/returnlabel. Outside of the United States, please contact your local representative.
Printed in the United States of America
10 9 8 7 6 5 4 3 2 1
E1FPREF
09/14/2010
12:7:8
Page 3
Preface
We are pleased to offer this 5th edition of Theory and Design for Mechanical Measurements. This text provides
a well-founded background in the theory of engineering measurements. Integrated throughout are the necessary
elements for the design of measurement systems and measurement test plans, with an emphasis on the role of
statistics and uncertainty analyses in design. The measurements field is very broad, but through careful
selection of the topical coverage we establish the physical principles and practical techniques for many
engineering applications while keeping page count and text cost manageable. Our aim is not to offer a manual
for instrument construction and assembly. Instead, we develop the conceptual design framework for selecting
and specifying equipment and test procedures and for interpreting test results, which we feel are necessary and
common bases for the practice of test engineering. The text is appropriate for undergraduate and graduate level
study in engineering, but is also suitably advanced and oriented to serve as a reference source for professional
practitioners. The pedagogical approach invites independent study or use in related fields requiring an
understanding of instrumentation and measurements.
The organization of the text develops from our view that certain aspects of measurements can be
generalized, such as test plan design, signal analysis and reconstruction, and measurement system response.
Topics such as statistics and uncertainty analysis require a basic development of principles but are then best
illustrated by integrating these topics throughout the text material. Other aspects are better treated in the context
of the measurement of a specific physical quantity, such as strain or temperature.
PEDAGOGICAL TOOLS TO AID LEARNING
In this textbook:
�
�
�
�
�
Each chapter begins by defining a set of learning outcomes.
The text develops an intuitive understanding of measurement concepts with its focus on test system
modeling, test plan design, and uncertainty analysis.
Each chapter includes carefully constructed example problems that illustrate new material and
problems that build on prior material.
Each example makes use of a KNOWN, FIND, SOLVE approach as an organizational aid to a
problem’s solution. This methodology for problem solutions helps new users to link words and concepts
with symbols and equations. Many problems contain COMMENTS that expand on the solution,
provide a proper context for application of the principle, or offer design application insight.
End-of-Chapter practice problems are included for each chapter to exercise new concepts.
�
�
Practice problems range from those focused on concept development, to building of advanced skills,
to open-ended design applications.
� With each chapter, we have added new practice problems but have substantially ‘‘refreshed’’ many
problems from previous editions.
� We provide a detailed Instructors Manual for instructors who have adopted the book. We have
carefully reviewed the solutions in this edition to minimize typographical and arithmetical errors. The
manual is available on-line at the Wiley Instructor’s website.
� Answers to selected problems will be posted on the Wiley website.
Use of the software in problem solving allows in-depth exploration of key concepts that would be
prohibitively time consuming otherwise. The text includes on-line access to interactive software of
iii
E1FPREF
09/14/2010
iv
12:7:8
Page 4
Preface
focused examples based on software using National Instruments Labview1 for exploring some of the
text concepts, while retaining our previous efforts using Matlab1. The Labview programs are available
as executables so they can be run directly without a Labview license. The software is available on both
the Wiley Student and Instructor’s websites.
NEW TO THIS 5TH EDITION
With this 5th edition, we have new or expanded material on a number of topics. As highlights:
�
�
We introduce Monte Carlo simulation methods in Chapter 4 and tie their use with uncertainty estimations in Chapter 5.
Treatment of uncertainty analysis in Chapter 5 has been updated to include changes in test standards
methodology relative to ASME PTC 19.1 Test Uncertainty and the International Standards Organization
(ISO) Guide to Uncertainty in Measurements. These changes have been carried into the other chapters
both in language and in example problems. Where we deviate from the methodology of the Standards,
we do so for pedagogical reasons.
�
Discussion has been added on using rectangular (uniform) distributions in uncertainty estimation.
The treatment of non-symmetric uncertainty intervals and methods for treating correlated errors in
Chapter 5 has been expanded and revisited in other chapters.
� We have updated our symbol usage for closer consistency with the standards.
We have added a section presenting image acquisition and processing using digital techniques in
Chapter 7.
We have changed our presentation of pressure transmission line effects to make better use of the lumped
parameter methods of Chapter 3 that engineering students are familiar with, including discussion of the
ideal elements of inertance, resistance, and compliance.
We have revised our treatment of Butterworth filters, including added coverage, in Chapter 6.
WehaveaddedanintroductiontotheanalysisofstraingaugedatatocomputeprincipalstressesinChapter11.
�
�
�
�
�
SUGGESTED COURSE COVERAGE
To aid in course preparation, Chapters 1 through 5 provide an introduction to measurement theory with statistics
and uncertainty analysis, Chapters 6 and 7 provide a broad treatment of analog and digital sampling methods,
and Chapters 8 through 12 are instrumentation focused.
Many users report to us that they use different course structures, so many that it makes a preferred order of
topical presentation difficult to anticipate. To accommodate this, we have written the text in a manner that allows
any instructor to customize the order of material presentation. While the material of Chapters 4 and 5 are integrated
throughout the text and should be taught in sequence, the other chapters tend to stand on their own. The text is
flexible and can be used in a variety of course structures at both the undergraduate and graduate levels.
For a complete measurements course, we recommend the study of Chapters 1 through 7 with use of the
remaining chapters as appropriate. For a lab-course sequence, we recommend using chapters as they best
illustrate the course exercises while building complete coverage over the several lab courses normally within a
curriculum. The manner of the text allows it to be a resource for a lab-only course with minimal lecture. Over
the years, we have used it in several forums, as well as professional development courses, and simply rearrange
material and emphasis to suit the audience and objective.
We express our sincerest appreciation to the students, teachers, and engineers who have used our earlier
editions. We are indebted to the many who have written us with their constructive comments and encouragement.
Richard S. Figliola
Donald E. Beasley
Clemson, South Carolina
E1FTOC
09/15/2010
11:10:55
Page 5
Contents
1
Basic Concepts of Measurement Methods
1.1
Introduction
1
1.2
General Measurement System
1.3
Experimental Test Plan
6
1.4
Calibration
15
1.5
Standards
23
1.6
Presenting Data
30
1.7
Summary
31
References
31
Nomenclature
32
Problems
32
2
1
2
Static and Dynamic Characteristics of Signals
41
2.1
Introduction
41
2.2
Input/Output Signal Concepts
41
2.3
Signal Analysis
46
2.4
Signal Amplitude And Frequency
49
2.5
Fourier Transform and The Frequency Spectrum
2.6
Summary
71
References
71
Suggested Reading
71
Nomenclature
72
Problems
72
3
Measurement System Behavior
63
79
3.1
Introduction
79
3.2
General Model for a Measurement System
3.3
Special Cases of the General System Model
3.4
Transfer Functions
104
3.5
Phase Linearity
106
3.6
Multiple-Function Inputs
107
3.7
Coupled Systems
109
3.8
Summary
111
References
111
Nomenclature
111
Problems
112
79
83
v
E1FTOC
09/15/2010
vi
11:10:55
Page 6
Contents
4
Probability and Statistics
118
4.1
Introduction
118
4.2
Statistical Measurement Theory
119
4.3
Describing the Behavior of a Population
125
4.4
Statistics of Finite-Sized Data Sets
129
4.5
Chi-Squared Distribution
135
4.6
Regression Analysis
139
4.7
Data Outlier Detection
147
4.8
Number of Measurements Required
148
4.9
Monte Carlo Simulations
150
4.10 Summary
152
References
152
Nomenclature
153
Problems
153
5
Uncertainty Analysis
161
5.1
Introduction
161
5.2
Measurement Errors
162
5.3
Design-Stage Uncertainty Analysis
164
5.4
Identifying Error Sources
168
5.5
Systematic and Random Errors
170
5.6
Uncertainty Analysis: Error Propagation
172
5.7
Advanced-Stage Uncertainty Analysis
176
5.8
Multiple-Measurement Uncertainty Analysis
182
5.9
Correction for Correlated Errors
195
5.10 Nonsymmetrical Systematic Uncertainty Interval
197
5.11 Summary
198
References
199
Nomenclature
199
Problems
200
6
Analog Electrical Devices and Measurements
209
6.1
Introduction
209
6.2
Analog Devices: Current Measurements
210
6.3
Analog Devices: Voltage Measurements
214
6.4
Analog Devices: Resistance Measurements
219
6.5
Loading Errors and Impedance Matching
226
6.6
Analog Signal Conditioning: Amplifiers
230
6.7
Analog Signal Conditioning: Special-Purpose Circuits
6.8
Analog Signal Conditioning: Filters
239
6.9
Grounds, Shielding, and Connecting Wires
250
6.10 Summary
252
References
253
Nomenclature
253
Problems
254
234
E1FTOC
09/15/2010
11:10:55
Page 7
Contents
7
Sampling, Digital Devices, and Data Acquisition
260
7.1
Introduction
260
7.2
Sampling Concepts
261
7.3
Digital Devices: Bits and Words
269
7.4
Transmitting Digital Numbers: High and Low Signals
7.5
Voltage Measurements
271
7.6
Data-Acquisition Systems
283
7.7
Data-Acquisition System Components
284
7.8
Analog Input-Output Communication
288
7.9
Digital Input-Output Communication
293
7.10 Digital Image Acquisition and Processing
299
7.11 Summary
303
References
303
Suggested Reading
304
Nomenclature
304
Problems
305
8
Temperature Measurements
309
8.1
Introduction
309
8.2
Temperature Standards and Definition
310
8.3
Thermometry Based on Thermal Expansion
313
8.4
Electrical Resistance Thermometry
315
8.5
Thermoelectric Temperature Measurement
330
8.6
Radiative Temperature Measurements
351
8.7
Physical Errors in Temperature Measurement
356
8.8
Summary
365
References
365
Nomenclature
366
Problems
367
9
Pressure and Velocity Measurements
375
9.1
Introduction
375
9.2
Pressure Concepts
375
9.3
Pressure Reference Instruments
378
9.4
Pressure Transducers
386
9.5
Pressure Transducer Calibration
392
9.6
Pressure Measurements in Moving Fluids
396
9.7
Modeling Pressure and Fluid Systems
400
9.8
Design and Installation: Transmission Effects
401
9.9
Fluid Velocity Measuring Systems
405
9.10 Summary
415
References
416
Nomenclature
417
Problems
417
271
vii
E1FTOC
09/15/2010
viii
11:10:55
Page 8
Contents
10 Flow Measurements
423
10.1
Introduction
423
10.2
Historical Background
423
10.3
Flow Rate Concepts
424
10.4
Volume Flow Rate Through Velocity Determination
10.5
Pressure Differential Meters
427
10.6
Insertion Volume Flow Meters
446
10.7
Mass Flow Meters
454
10.8
Flow Meter Calibration and Standards
459
10.9
Estimating Standard Flow Rate
460
10.10 Summary
461
References
461
Nomenclature
462
Problems
462
11 Strain Measurement
425
466
11.1
Introduction
466
11.2
Stress and Strain
466
11.3
Resistance Strain Gauges
469
11.4
Strain Gauge Electrical Circuits
476
11.5
Practical Considerations for Strain Measurement
11.6
Apparent Strain and Temperature Compensation
11.7
Optical Strain Measuring Techniques
492
11.8
Summary
497
References
498
Nomenclature
498
Problems
499
12 Mechatronics: Sensors, Actuators, and Controls
12.1
Introduction
504
12.2
Sensors
504
12.3
Actuators
534
12.4
Controls
540
12.5
Summary
557
Nomenclature
558
References
558
Problems
559
504
479
482
E1FTOC
09/15/2010
11:10:55
Page 9
Contents
Appendix A
A Guide for Technical Writing
A Guide For Technical Writing
References
568
563
563
Appendix B
Property Data and Conversion Factors
Appendix C
Laplace Transform Basics
C.1
Final Value Theorem
577
C.2
Laplace Transform Pairs
577
References
577
Glossary
Index
578
585
576
569
ix
E1FTOC
09/15/2010
11:10:55
Page 10
E1C01
09/14/2010
15:40:34
Chapter
Page 1
1
Basic Concepts of Measurement
Methods
1.1 INTRODUCTION
We make measurements every day. Consider the common measurements illustrated in Figure 1.1.
We routinely read the temperature of an outdoor thermometer to choose appropriate clothing for
the day. We expect to have exactly 10 gallons or liters of fuel added to our tank when that volume
is indicated on a fuel pump. And we expect measuring cups to yield correct quantities of
ingredients in cooking. We put little thought into the selection of instruments for these routine
measurements. After all, the direct use of the data is clear to us, the type of instruments and
techniques are familiar to us, and the outcome of these measurements is not important enough to
merit much attention to features like improved accuracy or alternative methods. But when the
stakes become greater, the selection of measurement equipment and techniques and the interpretation of the measured data can demand considerable attention. Just contemplate how you might
verify that a new engine is built as designed and meets the power and emissions performance
specifications required.
But first things first. The objective in any measurement is to answer a question. So we take
measurements to establish the value or the tendency of some variable, the results of which are
specifically targeted to answer our question. The information acquired is based on the output of the
measurement device or system. There are important issues to be addressed to ensure that the output
of the measurement device is a reliable indication of the true value of the measured variable. In
addition, we must address the following important questions:
1. How can a measurement or test plan be devised so that the measurement provides the
unambiguous information we seek?
2. How can a measurement system be used so that the engineer can easily interpret the
measured data and be confident in their meaning?
There are procedures that address these measurement questions.
At the onset, we want to stress that the subject of this text is real-life oriented. Specifying a
measurement system and measurement procedures represents an open-ended design problem whose
outcome will not have one particular solution. That means there may be several approaches to
solving a measurement problem, and some will be better than others. This text emphasizes accepted
procedures for analyzing a measurement problem to assist in the selection of equipment,
1
E1C01
09/14/2010
2
15:40:34
Chapter 1
Page 2
Basic Concepts of Measurement Methods
Figure 1.1 Common devices that
involve measurements.
methodology, and data analysis to meet the design objectives. Perhaps more than in any other
technical field, the approach taken in measurement design and the outcome achieved will often
depend on the attention and experience of the designer.
Upon completion of this chapter, the reader will be able to
�
�
identify the major components of a general measurement system, and state the function of
each,
develop an experimental test plan,
�
distinguish between random and systematic errors,
�
�
describe and define the various error types,
define a standard and distinguish among primary, secondary, and transfer standards, and
�
clearly delineate defined and derived dimensions in various unit systems.
1.2 GENERAL MEASUREMENT SYSTEM
A measurement1 is an act of assigning a specific value to a physical variable. That physical variable
is the measured variable. A measurement system is a tool used for quantifying the measured
variable. As such, a measurement system is used to extend the abilities of the human senses that,
while they can detect and recognize different degrees of roughness, length, sound, color, and smell,
are limited and relative; they are not very adept at assigning specific values to sensed variables.
A system is composed of components that work together to accomplish a specific objective. We
begin by describing the components that make up a measurement system, using specific examples.
Then we will generalize to a model of the generic measurement system.
1
There are many new engineering measurement terms introduced. A glossary of the italicized terms is located in the back of
the text for your reference.
E1C01
09/14/2010
15:40:34
Page 3
1.2
General Measurement System
3
Cantilever and tip
Sample surface
Figure 1.2 Sensor stage of an atomic-force
microscope.
Sensor and Transducer
An increasingly important area of scientific inquiry is the characteristics of matter at the nanoscale.
Suppose we want to measure the profile of a surface at a nanometer scale. We discover that a small
(very small) cantilever beam placed near the surface is deflected by atomic forces. Let’s assume for
now that they are repulsive forces. If this cantilever is translated over the surface, the cantilever will
deflect, indicating the height of the surface. This concept is illustrated in Figure 1.2; the device is
called an atomic force microscope. The cantilever beam is a sensor, a physical element that employs
some natural phenomenon, in this case deflection under the action of a force, to sense the variable
being measured, in this case the height of the surface.
So, we have a sensor to measure at the nanometer scale. But we have no means of getting an output
from the sensor that we can record. Suppose that the upper surface of the cantilever is reflective, and we
shine a laser onto the upper surface, as shown in Figure 1.3. The movement of the cantilever will deflect
the laser. Employing a number of light sensors, also shown in Figure 1.3, the deflection of the laser can
be sensed and that deflection corresponds to the height of the surface. Together the laser and the light
sensors (photodiodes) form the transducer component of the measurement system. A transducer
converts the sensed information into a detectable signal. The signal might be mechanical, electrical,
optical, or may take any other form that can be meaningfully recorded.
We should note that sensor selection, placement, and installation are particularly important to
ensure that the sensor output accurately reflects the measurement objective. The familiar phrase
Detector and
feedback
electronics
Laser
Photodiodes
Cantilever and tip
Sample surface
Figure 1.3 Atomic-force microscope with
sensor and transducer stages.
09/14/2010
4
15:40:34
Chapter 1
Page 4
Basic Concepts of Measurement Methods
associated with hot days, ‘‘100� F in the shade’’ implies a specific sensor placement. Accordingly,
the interpretation of all information passed through and indicated by the system depends on what is
actually sensed by the sensor. For example, the interpretation of the output of a medical thermometer
depends on where its sensor is placed.
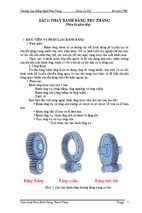
Output Stage
60
70
The goal of a measurement system is to convert the sensed information into a form that can be
easily quantified. Consider a familiar example, the liquid-in-glass bulb thermometer. The liquid
contained within the bulb on the common bulb thermometer of Figure 1.4 exchanges energy with
its surroundings until the two are in thermal equilibrium. At that point they are at the same
temperature. This energy exchange is the input signal to this measurement system. The phenomenon of thermal expansion of the liquid results in its movement up and down the stem, forming an
output signal from which we determine temperature. The liquid in the bulb acts as the sensor.
By forcing the expanding liquid into a narrow capillary, this measurement system transforms
thermal information into a mechanical displacement. Hence, the bulb’s internal capillary design
acts as a transducer.
The output stage indicates or records the value measured. This might be a simple readout
display, a marked scale, or even a recording device such as a computer disk drive. The readout scale
of the bulb thermometer in Figure 1.4 serves as the output stage of that measurement system.
It is worth noting that the term ‘‘transducer’’ is also often used in reference to a packaged
device, which may contain a sensor, transducer, and even some signal conditioning elements. While
such terminology is not true to our presentation, the context in which the term is used prevents
ambiguity.
Display scale
30
40
50
Output stage
Stem
20
E1C01
Bulb
Sensor–transducer stage
Sensor
Figure 1.4 Components of bulb thermometer
equivalent to sensor, transducer, and output
stages.
E1C01
09/14/2010
15:40:34
Page 5
1.2
General Measurement System
5
General Template for a Measurement System
A general template for a measurement system is illustrated in Figure 1.5. Basically such a system
consists of part or all of four general stages: (1) sensor–transducer stage, (2) signal-conditioning
stage, (3) output stage, and (4) feedback-control stage. These stages form the bridge between the
input to the measurement system and the system output, a quantity that is used to infer the value of
the physical variable measured. We discuss later how the relationship between the input information, as acquired by the sensor, and the system output is established by a calibration. We have already
discussed the sensor–transducer stage, so let’s move on to the signal-conditioning stage.
The signal-conditioning stage takes the transducer signal and modifies it to a desired
magnitude. This optional intermediate stage might be used to perform tasks such as increasing
the magnitude of the signal by amplification, removing portions of the signal through some filtering
technique, or providing mechanical or optical linkage between the transducer and the output stage.
For example, the translational displacement of a mechanic’s caliper (sensor) is often converted into a
rotational displacement of a pointer. This stage can consist of one or more devices, which are often
connected in series. For example, the diameter of the thermometer capillary relative to the bulb
volume (see Fig. 1.4) determines how far up the stem the liquid moves with increasing temperature.
It ‘‘conditions’’ the signal by amplifying the liquid displacement.
In those measurement systems involved in process control, a fourth stage, the feedback-control
stage, contains a controller that interprets the measured signal and makes a decision regarding the
control of the process. This decision results in a signal that changes the process parameter that
affects the magnitude of the sensed variable. In simple controllers, this decision is based on the
magnitude of the signal of the sensed variable, usually whether it exceeds some high or low set point,
a value set by the system operator. For example, a simple measurement system with control stage is a
household furnace thermostat. The operator fixes the set point for temperature on the thermostat
display, and the furnace is activated as the local temperature at the thermostat, as determined by the
Calibration
Signal conditioning stage
Sensor stage
Signal
path
Output
stage
Transducer
stage
Process
Control signal
Figure 1.5 Components of a general measurement system.
Control
stage
E1C01
09/14/2010
6
15:40:34
Chapter 1
Page 6
Basic Concepts of Measurement Methods
sensor within the device, rises or falls above or below the set point. In a more sophisticated
controller, a signal from a measurement system can be used as an input to an ‘‘expert system’’
controller that, through an artificial intelligence algorithm, determines the optimum set conditions
for the process. Mechatronics deals with the interfacing of mechanical and electrical components
with microprocessors, controllers, and measurements. We will discuss some features of mechatronic
systems in detail in Chapter 12.
1.3 EXPERIMENTAL TEST PLAN
An experimental test serves to answer a question, so the test should be designed and executed to
answer that question and that question alone. This is not so easy to do. Let’s consider an example.
Suppose you want to design a test to answer the question, ‘‘What is the fuel use of my new car?’’
What might be your test plan? In a test plan, you identify the variables that you will measure, but you
also need to look closely at other variables that will influence the result. Two important variables to
measure would be distance and fuel volume consumption. Obviously, the accuracy of the odometer
will affect the distance measurement, and the way you fill your tank will affect your estimate of the
fuel volume. But what other variables might influence your results? If your intended question is to
estimate the average fuel usage to expect over the course of ownership, then the driving route you
choose would play a big role in the results and is a variable. Only highway driving will impose a
different trend on the results than only city driving, so if you do both you might want to randomize
your route by using various types of driving conditions. If more than one driver uses the car, then the
driver becomes a variable because each individual drives somewhat differently. Certainly weather
and road conditions influence the results, and you might want to consider this in your plan. So we see
that the utility of the measured data is very much impacted by variables beyond the primary ones
measured. In developing your test, the question you propose to answer will be a factor in developing
your test plan, and you should be careful in defining that question so as to meet your objective.
Imagine how your test conduct would need to be different if you were interested instead in
providing values used to advertise the expected average fuel use of a model of car. Also, you need to
consider just how good an answer you need. Is 2 liters per 100 kilometers or 1 mile per gallon close
enough? If not, then the test might require much tighter controls. Lastly, as a concomitant check, you
might compare your answer with information provided by the manufacturer or independent agency
to make sure your answer seems reasonable. Interestingly, this one example contains all the same
elements of any sophisticated test. If you can conceptualize the factors influencing this test and how
you will plan around them, then you are on track to handle almost any test. Before we move into the
details of measurements, we focus here on some important concepts germane to all measurements
and tests.
Experimental design involves itself with developing a measurement test plan. A test plan draws
from the following three steps:2
1. Parameter design plan. Determine the test objective and identify the process variables and
parameters and a means for their control. Ask: ‘‘What question am I trying to answer? What
needs to be measured?’’ ‘‘What variables and parameters will affect my results?’’
2
These three strategies are similar to the bases for certain design methods used in engineering system design (1).
E1C01
09/14/2010
15:40:34
Page 7
1.3
Experimental Test Plan
7
2. System and tolerance design plan. Select a measurement technique, equipment, and
test procedure based on some preconceived tolerance limits for error.3 Ask: ‘‘In what
ways can I do the measurement and how good do the results need to be to answer my
question?’’
3. Data reduction design plan. Plan how to analyze, present, and use the anticipated data.
Ask: ‘‘How will I interpret the resulting data? How will I use the data to answer my question?
How good is my answer? Does my answer make sense?’’
Going through all three steps in the test plan before any measurements are taken is a useful
habit for a successful engineer. Often, step 3 will force you to reconsider steps 1 and 2! In this
section, we focus on the concepts related to step 1 but will discuss and stress all three throughout
the text.
Variables
Once we define the question that we want the test to answer, the next step is to identify the relevant
process parameters and variables. Variables are entities that influence the test. In addition to the
targeted measured variable, there may be other variables pertinent to the measured process that will
affect the outcome. All known process variables should be evaluated for any possible cause-andeffect relationships. If a change in one variable will not affect the value of some other variable, the
two are considered independent of each other. A variable that can be changed independently of other
variables is known as an independent variable. A variable that is affected by changes in one or more
other variables is known as a dependent variable. Normally, the variable that we measure depends on
the value of the variables that control the process. A variable may be continuous, in that its value is
able to change in a continuous manner, such as stress under a changing load or temperature in a
room, or it may be discrete in that it takes on discrete values or can be quantified in a discrete way,
such as the value of the role of dice or a test run by a single operator.
The control of variables is important. A variable is controlled if it can be held at a constant value
or at some prescribed condition during a measurement. Complete control of a variable would imply
that it can be held to an exact prescribed value. Such complete control of a variable is not usually
possible. We use the adjective ‘‘controlled’’ to refer to a variable that can be held as prescribed, at
least in a nominal sense. The cause-and-effect relationship between the independent variables and
the dependent variable is found by controlling the values of the independent variables while
measuring the dependent variable.
Variables that are not or cannot be controlled during measurement but that affect the value of the
variable measured are called extraneous variables. Their influence can confuse the clear relation
between cause and effect in a measurement. Would not the driving style affect the fuel consumption
of a car? Then unless controlled, this influence will affect the result. Extraneous variables can
introduce differences in repeated measurements of the same measured variable taken under
seemingly identical operating conditions. They can also impose a false trend onto the behavior
of that variable. The effects due to extraneous variables can take the form of signals superimposed
onto the measured signal with such forms as noise and drift.
3
The tolerance design plan strategy used in this text draws on uncertainty analysis, a form of sensitivity analysis. Sensitivity
methods are common in design optimization.
09/14/2010
8
15:40:34
Chapter 1
Page 8
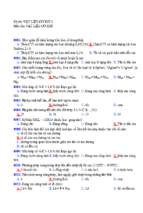
Basic Concepts of Measurement Methods
Boiling point results
215
214
Boiling region
213
212
Temperature ºF
E1C01
212.5
212.1
211.6
211
210
209
Test 1 (30.2 in. Hg)
Test 2 (29.7 in. Hg)
208
Test 3 (30.0 in. Hg)
207
206
205
1
2
3
4
5
6
7
Time (min)
Figure 1.6 Results of a boiling point test for water.
Consider a thermodynamics experiment to establish the boiling point of water. The apparatus
for measuring the boiling point might yield the results shown in Figure 1.6 for three test runs
conducted on separate days. Notice the different outcome for each test.
Why should the data from three seemingly identical tests show such different results?
Suppose we determine that the measurement system accuracy accounts for only 0.1� F of the test
data scatter. So another plausible contributing factor is the effect of an extraneous variable. Indeed,
a close examination of the test data shows a measured variation in the barometric pressure, which
would affect the boiling temperature. The pressure variation is consistent with the trend seen in
the boiling point data. Because the local barometric pressure was not controlled (i.e., it was not
held fixed between the tests), the pressure acted as an extraneous variable adding to the differences in
outcomes between the test runs. Control important variables or be prepared to solve a puzzle!
Parameters
In this text, we define a parameter as a functional grouping of variables. For example, a moment of
inertia or a Reynolds number has its value determined from the values of a grouping of variables. A
parameter that has an effect on the behavior of the measured variable is called a control parameter.
Available methods for establishing control parameters based on known process variables include
similarity and dimensional analysis techniques and physical laws (2–4). A parameter is controlled
if its value can be maintained during a set of measurements.
As an example, the flow rate, Q, developed by a fan depends on rotational speed, n, and the
diameter, d, of the fan. A control parameter for this group of three variables, found by similarity
methods, is the fan flow coefficient, C 1 ¼ Q=nd 3 . For a given fan, d is fixed (and therefore
controlled), and if speed is somehow controlled, the fan flow rate associated with that speed can
be measured and the flow coefficient can be determined.
- Xem thêm -