CEPR Working Paper
WP-04/2009
Dynamic Demographics and Economic Growth
in Vietnam
Nguyen Thi Minh
Mathematical Economics Department,
National Economics University Hanoi, Vietnam
CENTRE FOR ECONOMIC AND POLICY RESEARCH
COLLEGE OF ECONOMICS, VIETNAM NATIONAL UNIVERSITY HANOI
1
© 2009 Centre for Economic and Policy Research
College of Economics, Vietnam National University Hanoi
WP-04/2009
CEPR Working Paper
Dynamic Demographics and Economic Growth in Vietnam1
Nguyen Thi Minh
E-mail:
[email protected]
Abstract
This paper is an empirical study of the effect of age-structure of population on economic
growth in Vietnam. The statistics show that in recent years, Vietnam’s demographics have
been changing remarkably with an increase in the labor force as well as a decrease in the
dependency ratio. This change offers a great opportunity for the economy to enhance its
economic growth in the short and medium terms at least. Our estimated results from
regression models also indicate that Vietnam has utilized this opportunity: the change in
demographics has contributed up to 15 percent of economic growth during the last five years.
Another finding is that while being categorized as dependent, the aged seem do not have
negative impact on economic growth but young children do.
Vietnam’s population will probably shift from a demographic dividend to demographic debt
in about ten years. Therefore, it is very important for Vietnamese government to take
advantage of this dividend period in order to improve human capital and technology and
prepare a coming period of demographic debt. In addition, building up sound pension and
health care systems in the medium term is also a must.
Key Words: Demographics, economic growth, dependence ratio, age structure, demographic
dividend, Vietnam
1
Forthcoming in Journal of the Asia Pacific Economy in 2009.
2
Content
A brief review of Vietnam’s age-structure transition ................................................................4
Theoretical framework, empirical evidence and model setup ...................................................8
Data, the econometrics model and estimated results ...............................................................10
Concluding remarks and policy recommendation ...................................................................13
Reference .................................................................................................................................14
Tables
1. A comparison of fertility rate……………………………………………………….….…..4
2. OLS Estimated result for the determinants of the growth rate of income per capita…..….11
3. OLS Estimated result for the determinants of the growth rate of income per capita…..….12
Figures
1. Age structure of Vietnam population, history and projection………………………….…..5
2. Dynamics of the support ratio and dependency ratio for Vietnam…………………..…….7
Appendix
1. Table A: Sample statistics of variables in the data set………………………………..…..15
2. Test for heteroskedasticity………………………………………………………..………15
3. Test for model specification error………………………………………………...………15
3
A brief review of Vietnam’s age-structure transition
In 2007, Vietnam ranks 13th in population but 57th in GDP (by the World Bank); and
its population density is among the highest in the world. In addition, Vietnam has been
experiencing a rapid change in the age-structure of its population. With these characteristics,
Vietnam has to pay more attention on the issue of its demographics when shaping up the
economic-related policy. Below we will examine more closely the dynamics of demographics
in Vietnam.
Over the last 30 years, Vietnam has been experiencing a big change in its demographic
picture. During this period, the fertility rate decreased dramatically from a very high rate of
6.7% in 1970-1975 to 2.14% in 2005-2010. This may be due to several important factors: the
determination of the Government in implementing the Family Planning Program, which set a
target at reducing the population growth rate. Another factor is the social- economic
condition in Vietnam during this period: After 1975, the Vietnamese economy experienced a
difficult time as there was no longer economic foreign assistance – a very importance source
that supported Vietnam economy before the war ending in 1975. This difficulty lead to the
abolishment of the ration scheme in which the Government provided rice and other essential
products to all children under 18 whose parents worked for the Government. These two
factors play a key role in reducing the fertility rate at a rate that is must faster than in many
other countries. The dramatic reduction in the Vietnamese fertility rate is illustrated in Table
1 below.
Table 1: A comparison of fertility rate
Period
1970-1975
1975-1980
1980-1985
1985-1990
1990-1995
1995-2000
2000-2005
2005-2010
World
4.47
3.92
3.58
3.38
3.05
2.8
2.65
2.55
Developed
countries
2.13
1.91
1.85
1.83
1.68
1.55
1.56
1.6
Less developed
countries
5.41
4.65
4.15
3.84
3.42
3.11
2.9
2.75
Asia
5.04
4.19
3.67
3.4
2.97
2.67
2.47
2.34
Vietnam
6.7
5.89
4.5
4.02
3.3
2.5
2.32
2.14
Source: Population Division of the Department of Economic and Social Affairs of the United Nations
Secretariat. World Population Prospects: The 2006 Revision. http://esa.un.org/unpp
4
Table 1 shows that Vietnam had the highest fertility rate in 1970-1975 among country
groups in the table, while today it enjoys a rate that is lower than the world average level as
well as the level of Asian countries.
The same pattern is found with the infant mortality rate, measured as the number of
infant deaths over the number of live births, which reduces from a very high rate at 10. 67
percent during 1970-1975 to 2 percent today. To make a comparison, the figure for the world
during the same period is around 9% and 5%, respectively. This thanks to the improvement in
Vietnam’s health care system as well as innovations in medicine in the world.
In addition, life expectancy in Vietnam increased over time, from 50 years in 1970-1975
to 75 now. This is a great improvement compared with the world as a whole: the figure for
the world in the same periods is from 58 to 67, respectively.
The accumulation of the change in fertility rate, mortality rate and life expectancy has
resulted in a big change in the age structure of Vietnam’s population over time, which can be
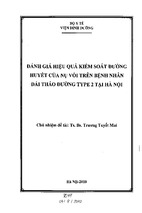
depicted in Figure 1.
Figure 1: Age structure of Vietnam population, history and projection
80
70
15-65
60
percent
50
40
30
5-14
20
0- 4
10
0
1975
>65
1980
1985
1990
1995
2000
2005
year
2010
2015
2020
2025
2030
2035
Source: Population Division of the Department of Economic and Social Affairs of the United Nations
Secretariat. World Population Prospects: The 2006 Revision. http://esa.un.org/unpp and author’s calculation
5
The figure shows three main features of the Vietnamese demographic dynamics:
1. The ratio of working age (from 15-65) to total population is expected to increase until
it peaks at 70 percent in (around) 2018. This is likely to provide a potential source for labor
force and hence for economic growth on the one hand, and pressure on new job creation on
the other hand.
2. The ratio of older people (defined as above 65 years of age) is also expected to
increase from 5.6 percent in 2006 to around 11 percent in 2030. This sharp increase requires a
well-built plan for the health care system as well as social security.
3. The ratio of young children (0-4) and school –age children (5-14) keep decreasing;
and this decline is likely to be enough to offset the increase in the rate of population,
implying that the number of young children is expected to remain unchanged.
The demographics of a population impacts the economy of the nation. It may be
supporting economic growth or impeding it, depending on the nature of the structure. In the
literature on the impact of demographics on economic growth, “demographic dividend” and
“demographic debt” are used to indicate the effects of the population on economic growth.
Demographic dividend and demographic debt
The term “demographic dividend” implies features of demographics that promote
economic growth, while “demographic debt” implies features that may impede economic
growth. A common way to see if the economy is in a demographic dividend period or not is
to look at the dynamics of the “support ratio”, defined as the ratio of working-age people to
total population, and the “dependency ratio”, defined as the ratio of under 15 and above 65 to
working-age people. A high ratio of working-age people normally implies not only a large
labor supply but also a large rate of saving and thus investment. This would promote per
capita economic growth. Conversely, a high ratio of dependent people would imply a large
rate of consumption and less investment, therefore impeding economic growth. Figure 2
below depicts the dynamics of the support ratio and the dependency ratio.
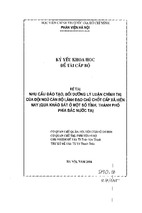
6
Figure 2: Dynamics of the support ratio and dependency ratio for Vietnam
90
dependency ratio
80
percent
70
60
support ratio
50
40
demographic dividend
30
1975
1985
1995
demographic debt
2005
support ratio
2015
2025
2035
dependency ratio
Source: Author’s calculation from Population Division of the Department of Economic and Social Affairs of the
United Nations Secretariat. World Population Prospects: The 2006 Revision. http://esa.un.org/unpp
Figure 2 shows that the support ratio has increased steadily from 1980 to 2010 with a
higher rate occurring between 2000 and 2010. After that it slows down and then stops rising.
Year 2018 is expected to be the end of a demographic dividend period and the starting point
for a period of demographic debt.
During the period of demographic dividend, the support ratio is expected to increase
from 50 percent in 1980 to 70 percent in 2018. Taking this projection into account will
improve the accuracy of growth accounting, therefore improve policy designs. During this
period, Vietnam has opportunities to take advantage of the increase in labor supply and
investment in order to accelerate economic growth and prepare for an expected decline in
support ratio from 2018.
The structure of the paper is as follows: the next section presents the theoretical
foundation for the relationship between age-structure and economic growth. Section 3
presents the econometric models and estimated results for the impact of age structure on
economic growth using provincial data. In this section, we take into account a fact that most
aged people in Vietnam do not receive a retirement benefit as in developed countries,
therefore many of them still work and contribute to economic growth. As such in this section
7
we run two regression models: the first one considers the effect of the age- structure on
economic growth in general. The second decomposes the dependents into two groups: young
children and the aged, and examines the impact of these two groups on economic growth.
Conclusions and policy recommendations are outlined in the final section.
Theoretical framework, empirical evidence and model setup
The analysis of the effect of age structure on economic growth is based on the main idea
that the role an individual plays as an economic agent in the economy varies over his or her
lifetime. A typical individual would be purely a consumer when he (or she) is at young ages,
then becomes a net saver cum producer once joining the labor force; and in the final stage of
his life, his behavior would be something in between (David Bloom and Canning, 2005). As
such, besides having an impact on economic growth via labor supply, the age structure of a
population also has an impact on economic growth through savings and investment (Bloom
and Williamson, 1998).
Another channel through which demography can affect economic growth is human
capital (Bloom and Canning, 2001a), which depends on the age structure of the population.
Empirical evidence regarding the important role of demography as a determinant of
economic growth is rich and can be found in developed as well as developing countries. For
example, Bloom and Williamson (1998) studied the effect of demography on economic
growth for EU countries during the period from 1965 to 1990. In this paper, they found that
almost 20 percent of economic growth is attributed to population dynamics.
For developing countries, where population is assumed to be young and the countries
have chance to take advantage of demographic dividend, demography is also shown to have
great impact on economic growth. Bloom et al. (2000), among others, show that around onethird of economic growth in Asian ‘miracle countries’ is assigned to age structure. China has
also gained from its demographic dividend over the recent years where its age structure
accounts for 15-20 percent of its economic growth (Cai Fang and Wang Dewen, 2006).
However, a demographics dividend only provides an opportunity for an economy to
grow more quickly, it is not sufficient in and of itself. Appropriate policies in investment
(both in physical and human capital) and job creation are necessary in order to realize the
opportunity. The success of the Asian miracles is a good example.
8
Vietnam is an emerging country whose economy is in the transition period from planned
to a market economy. Research on the supply side often pay attention on investors but not
labor. Because of that, very little study exits on the relationship between demographics and
economic growth for Vietnam. In this paper, we aim to shedding some light on this issue.
In the growth accounting approach, a simple mathematical manipulation is applied in
order to include the age structure into the model as follow (Bloom, 2005)
(Y/N) = (Y/L)(L/WA)(WA/N)
(1)
Where Y denotes total output, N is the total population, L is the labor force and WA is
the working age population. Assuming that the working participant rate (L/WA) is constant,
equation (1) can be rewritten as:
g ( y 1 ) = g ( y 2 ) + g ( WA
/ N )
(2)
Where the letter g denotes the growth rate, y1 denotes per capita income and y2 denotes
income per worker.
Equation (2) implies that the growth rate of income per capita can be physically
decomposed into two components: the growth rate of income per worker and the growth rate
of the ratio of working age group to total population. If income per worker (or in other words,
labor productivity) were to remain the same, income per capita would grow at the rate at
which the working age ratio grows. It would imply that for aging nations, where the workingage ratio tends to decline, income per capita would decline as well. Many developing
countries, which are experiencing a period of demographic dividend, see a rising income per
capita.
The growth regression approach is based on the neoclassical growth model, which states
that the growth rate of income per worker at the steady state depends on the value of income
per worker at the steady state and some initial level of income per worker (Bloom, 2005)
gy2 = a( y2* - y20)
(3)
Where the steady state y2* depends on factors that affect labor productivity such as
human capital or capital stock per worker.
Using the same manipulation as above, we arrive at the following equation:
gy1 = b( Xβ + log(L/WA)0 + log(WA/N)0 –y10) + g (WA/N)
(4)
Where X is a set of variables that determine income per worker at the steady state.
9
Equation (4) is the basis for econometric models that take into account the age structure
of a population as a determinant of economic growth.
In the following section, we will present the estimated results obtained from econometric
models based on equation (4).
Data, the econometrics model and estimated results
Data used in this work come mainly from the Vietnam Household Living Standard
Survey (VHLSS) for the years 2002, 2004 and 2006, conducted by the General Statistical
Office (GSO), which provides data on demography for sixty-one provinces.
Other macro-economic and social data are also collected from the General Statistic
Office of Vietnam.
The data are then calculated for each of 61 provinces and for each year from 2002 to
2006.
A description of the data is presented in Table A in the Appendix.
Variables used in the analysis:
1. GDP per capita
2002: represents initial GDP per capita, as to present the
heterogeneity in the economic condition between provinces ,which may include endowment,
human capital or other geographic-socio-economic condition
2. Working ratio: the percentage of people between ages 15 and 65 to total population
Working ratio 2002: the ratio measured in 2002, used as the initial level. The inclusion
of this variable is to account for the difference in endowment between provinces.
Working ratio growth: the average growth rate of the variable during period 2002-2006
3. Youth ratio: the ratio of people under 15 years of age to total population
4. Old ratio: the ratio of people above 65 years of age total population
5. Invest ratio: the ratio of investment to GDP
All variables are measured as the average over the period 2002-2006, due to the fact that
investment is often very lumpy. The lumpiness of investment is found in Minh (2006) and
others.
10
The method used in this paper is the ordinary least squares method (OLS) and the result
is reported in table 2.
Table 2: OLS Estimated result for the determinants of the growth rate of income
per capita. Dependent variable: growth rate of gdp per capita
Explanatory variables
Coef.
Std. Err
P>|t|
working ratio2002
0.276
0.085
0.001
working ratio growth
0.934
0.347
0.029
gdp per capita 2002
-0.142
0.736
0.847
invest ratio
0.024
0.018
0.184
_cons
-0.096
0.051
0.066
2
R
0.25
N0 of panels
57(*)
(*) Four provinces are excluded from the set of 61 provinces due to lack of data
The model passes the Breusch-Pagan test for heteroscedasticity and the Ramsey
regression specification error test (tests results are reported in Appendix).
The R2 of the model is 25% , implying that there are some other factors that affect
economic growth not included in the model. However, the model is well specified by the
Ramsey test and the obtained residuals are well behaved. Further more, our goal is not to
access the ability of independent variables in explaining the variation of the dependent
variable but to evaluate the impact of demography on economic growth, and hence the
relatively low R2 is not of great concern.
Table 2 shows that age structure is a significant determinant of economic growth: the
estimated coefficients on both the ratio of working-age people and its growth rate are
significantly positive. The coefficient 0.934 implies that each percent increase in the working
ratio is followed by nearly one percent increase in per capita income. During the period of
study, on average, the working ratio increase by 1.7 percent, leading to an increase of 1.6
percent in growth rate. With the annual per capita income growth at 112 percent, it means that
the total effect of age structure on per capita income growth is approximately 14.5 percentage
point.
2
Data on growth were calculted by province, taken from the General Statistics Office of Vietnam, and it was
greater than the data at the aggregate level due to the double counting problem.
11
Equivalently, the working ratio in the above model can be replaced by the dependency
ratio, which is defined as the ratio of people either younger than 15 or older than 65, which
has been done by many authors (Cai and Wang, 2006, for example). Instead of simply using
the dependency ratio as in Cai and Wang (2006), we deconstruct it into two: the youth ratio
and the old ratio. The former is defined as the ratio of people who are under 15 years of age
and the latter are older than 65. The reason for that is this: the effect of old people and the
young people on economic growth maybe different from each other: while many old people
are financially independent and have not much effect on the behavior of working people, the
young people do as their parents have to take responsibility for their children. And we want
to test this hypothesis.
The model then is:
g y1 = a0 + a1workingratio0 + a2 youth ratio growth + a3 old ratio growth + a4 gdp0
+ a5invest ratio + u
Table 3: OLS Estimated result for the determinants of the growth rate of income
per capita. Dependent variable: growth rate of GDP per capita
Explanatory variables
working ratio0
youth ratio growth
old ratio growth
gdp per capita 0
invest ratio
_cons
R2
No of panel
Coef.
0.143
-0.470
0.015
0.000
0.026
-0.020
Std. Error
0.069
0.166
0.067
0.000
0.019
0.043
0.25
57
P>|t|
0.044
0.007
0.820
0.289
0.168
0.637
Table 3 shows that although both young and old people are categorized as dependent in
the literature on demographics, the impact they have on economic growth differs: while the
youth ratio shows a clear impact on economic growth, the old does not. A possible
explanation is that: the hypothesis that the old consume more and save less may be true in
countries with a good retirement benefit system, where old people can be granted a
reasonable income to live on, but it may not be true for Vietnam where most old people do
not get a retirement benefit. In addition, they may not be as much of a burden for other
working members in their families as the youth do.
12
Concluding remarks and policy recommendation
During the last 30 years, Vietnam has gone through a period of demographic advantage
in terms of the age structure. The estimated results show that Vietnam had been turning this
advantage into reality during the studied period. This is consistent with the fact that during
this period, Vietnam has been opening up the economy, thus integrating more deeply into the
global economy. As a result, more flow of foreign investment comes in, and economic
conditions and institutions have been improved. All of these help utilize any potential source
of growth, including the demographic dividend. This regression result is in line with Cai and
Fang (2006), showing that Vietnam has achieved the same level as China in realizing the
advantage of having been in demographic dividend period.
However, in the short term when the economy is expected to be decline as a result of the
globally economic crisis, it is possible that Vietnam may lose its advantage of having been
in a dividend period, thus further reduction in economic growth is expected. At present, the
unemployment rate in Vietnam is on the rise, and there is no sign of it changing the course. In
addition, there is the added difficulty of 1.7 million people entering the labor force in 2009.
With the growth rate in 2008 at 6.2 percent (as confirmed by the General Statistics Office of
Vietnam recently), the effect of losing the advantage of being in dividend period alone could
pull down the growth rate to five percent in 2009 as predicted by the International Monetary
Fund.
It is recommended that Vietnam now provides more education and training to its labor
force. As there is more incentive for people to do the training in an economically harsh period
then in an easy period, given that the training is provided for free or with a suitable financial
package, this would be the best time for this. Another reason for that is this: in about 10
years, there will no longer be a demographic dividend in Vietnam, thus hence economic
growth will instead rely on human capital and technological progress. Therefore, the financial
package for stimulating the economy should include the education and training sector.
The regression result shows that the ratio of the aged does not affect economic growth. It
could be changed, however, when Vietnam applies the retirement system as an indispensable
tendency. At that time the aged then may work less then they do now, thus the ratio of the
aged in Vietnam may affect economic growth as in industrial economies. As the percentage
of the aged is expected to rise sharply after 2015, the Vietnamese authority should take this
conclusion into account when making plans for the economy in the future.
13
Reference
Andrew Mason and Sang-Hyop Lee, 2004. The demographic dividend and poverty
reduction, Seminar on the Relevance of Population Aspects or the Achievement of the
Millennium Development Goals, Paper No. UN/POP/PD/2004/19, New York, NY, November
17-19, 2004
Bloom, D. E. and Williamson, J.G., 1998. Demographic Transitions and Economic
Miracles in Emerging Asia. World Bank Economic Review 12(3): 419-455
Bloom D, Canning D, Malaney, P., 2000. Demographic change and economic growth in
Asia. Population and Development Review, 26:257-290.
Bloom, D. E. and Canning, D., 2001. Cumulative causality, economic growth, and the
demographic transition. In: N. Birdsall, A. Kelley, and S. Sinding. (eds.) Population
Matters: Demographic Change, Economic Growth, and Poverty in the Developing World.
Oxford: Oxford University Press, pp. 165-197.
Bloom, D.E and Canning D., 2005. Global demographic change: dimensions and
economic significance. Harvard Working Paper no 1, http://www.globalhealth. harvard.
edu/WorkingPapers.aspx
Cai Fang and Wang D., 2006. Demographic Transition and Economic Growth in China.
Paper prepared for the presentation at the International conference on the Dragon and the
Elephant: China and India’s Economic Reform, July 1st-July 2nd, 2006, Shanghai, China,
available
at:
http://iple.cass.cn/file/Demographic_Transition_and_Economic_Growth_in_China.pdf
Feyrer, J. D., 2002. Demographics and productivity. Mimeo, Dartmouth College
Minh Nguyen T., 2006. A Dynamic Analysis of Income Differences across Countries and
The Role of The Economic Environment, PhD thesis, Flinders University, Australia.
Wang Feng and Andrew Mason, 2005. Demographic Dividend and Prospects for
Economic Development in China. United Nations Expert Group Meeting on Social and
Economic Implications of Changing Population Age Structure, Mexico City, August 31September 2.
White, Halbert. 1980. A heteroskedastic-consistent covariance matrix estimator and a
direct test of heteroskedasticity. Econometrica 48:817-838
14
Appendix
1. Table A: Sample statistics of variables in the data set
. Variables
Mean
gdp
Standard
Standard
Minimum
Maximum
Error
Deviation
7212.231
1439.754
11244.838
657.294
80491.520
population
1343.807
111.599
871.615
294.667
5771.833
invest/gdp
0.328
0.020
0.149
0.057
0.761
youth ratio 2002
0.330
0.006
0.044
0.233
0.440
old ratio 2002
0.065
0.002
0.015
0.032
0.101
working ratio 2002
0.605
0.005
0.038
0.525
0.696
working ratio
growth
youth ratiogrowth
0.019
0.001
0.010
-0.008
0.039
-0.047
0.002
0.018
-0.087
-0.008
2. Test for heteroskedasticity
Breusch-Pagan / Cook-Weisberg test for heteroskedasticity
Ho: Constant variance
Variables: fitted values of gdp_per_rate
chi2(1)
=
1.30
Prob > chi2 = 0.2543
Conclusion: the error terms of the model have a constant variance
3. Test for model specification error
Ramsey RESET test using powers of the fitted values of gdp_per_rate
Ho: model has no omitted variables
F(3, 49) =
1.38
Prob > F =
0.2589
Conclusion: the model does not commit a model specification error
15
CONTACT INFORMATION:
Centre for Economic and Policy Research (CEPR)
College of Economics, Vietnam National University-Hanoi
Address:
Room 704, Building E4,
144 Xuan-Thuy Road, Cau-Giay District
Ha Noi, Viet Nam
Tel:
Fax:
Email:
Website:
(84) 4 3754 7506/ext 704-714
(84) 4 3704 9921
[email protected]
www.cepr.org.vn
© 2009 Centre for Economic and Policy Research
College of Economics, Vietnam National University-Hanoi
16