Downloaded from ascelibrary.org by RMIT UNIVERSITY LIBRARY on 01/03/19. Copyright ASCE. For personal use only; all rights reserved.
Congress on Technical
Advancement 2017
Cold Regions Engineering
Proceedings of the Congress on
Technical Advancement 2017
Duluth, Minnesota
September 10–13, 2017
Edited by Jon E. Zufelt, Ph.D., P.E., D.WRE
Downloaded from ascelibrary.org by RMIT UNIVERSITY LIBRARY on 01/03/19. Copyright ASCE. For personal use only; all rights reserved.
CONGRESS ON TECHNICAL
ADVANCEMENT 2017
COLD REGIONS ENGINEERING
PROCEEDINGS OF THE 17TH INTERNATIONAL CONFERENCE ON COLD
REGIONS ENGINEERING PRESENTED AT THE FIRST CONGRESS ON
TECHNICAL ADVANCEMENT
September 10–13, 2017
Duluth, Minnesota
SPONSORED BY
Committee on Technical Advancement
Aerospace Engineering Division
Cold Regions Engineering Division
Committee on Adaptation to a Changing Climate
Energy Division
Forensic Engineering Division
Infrastructure Resilience Division
Construction Institute
Duluth Section of ASCE
Utility Engineering and Surveying Institute of the
American Society of Civil Engineers
EDITED BY
Jon E. Zufelt, Ph.D., P.E., D.WRE
Downloaded from ascelibrary.org by RMIT UNIVERSITY LIBRARY on 01/03/19. Copyright ASCE. For personal use only; all rights reserved.
Published by American Society of Civil Engineers
1801 Alexander Bell Drive
Reston, Virginia, 20191-4382
www.asce.org/publications | ascelibrary.org
Any statements expressed in these materials are those of the individual authors and do not
necessarily represent the views of ASCE, which takes no responsibility for any statement
made herein. No reference made in this publication to any specific method, product, process,
or service constitutes or implies an endorsement, recommendation, or warranty thereof by
ASCE. The materials are for general information only and do not represent a standard of
ASCE, nor are they intended as a reference in purchase specifications, contracts, regulations,
statutes, or any other legal document. ASCE makes no representation or warranty of any
kind, whether express or implied, concerning the accuracy, completeness, suitability, or
utility of any information, apparatus, product, or process discussed in this publication, and
assumes no liability therefor. The information contained in these materials should not be used
without first securing competent advice with respect to its suitability for any general or
specific application. Anyone utilizing such information assumes all liability arising from such
use, including but not limited to infringement of any patent or patents.
ASCE and American Society of Civil Engineers—Registered in U.S. Patent and Trademark
Office.
Photocopies and permissions. Permission to photocopy or reproduce material from ASCE
publications can be requested by sending an e-mail to
[email protected] or by locating a
title in ASCE's Civil Engineering Database (http://cedb.asce.org) or ASCE Library
(http://ascelibrary.org) and using the “Permissions” link.
Errata: Errata, if any, can be found at https://doi.org/10.1061/9780784481011
Copyright © 2017 by the American Society of Civil Engineers.
All Rights Reserved.
ISBN 978-0-7844-8101-1 (PDF)
Manufactured in the United States of America.
Congress on Technical Advancement 2017
iii
Preface
Downloaded from ascelibrary.org by RMIT UNIVERSITY LIBRARY on 01/03/19. Copyright ASCE. For personal use only; all rights reserved.
The Congress on Technical Advancement was established to bring together several of the
Divisions under the ASCE Board-level Committee on Technical Advancement (CTA) at a
single venue. While some of the CTA Divisions hold regular small conferences, others do
not have an established forum to present technical information to their constituents or the
engineering community. One of the goals of the Congress is to provide greater
opportunities for interaction and synergy among the activities of the Divisions and ASCE’s
Institutes. This 1st Congress on Technical Advancement was held at the Duluth
Entertainment and Convention Center in Duluth, Minnesota on September 10-13, 2017.
This 1st Congress included the participation of and presentations by the Aerospace
Engineering Division, Cold Regions Engineering Division, Committee on Adaptation to a
Changing Climate, Energy Division, Forensic Engineering Division, Infrastructure
Resilience Division, the Construction Institute (CI), and the Utilities Engineering and
Surveying Institute (UESI), representing the combination of existing conference series as
well as opportunities for new periodic technical symposia. The Congress was hosted by the
Duluth Section of ASCE as they celebrated their 100th Anniversary with a special session
and evening social event.
The 2017 Congress on Technical Advancement included 3 days of presentations with daily
plenary sessions followed by 6 parallel tracks of technical sessions providing a venue for
over 160 presentations. The conference also included an Awards Luncheon highlighted by
the presentation of the Harold R. Peyton Award for Cold Regions Engineering, the CANAM Civil Engineering Amity Award, the Charles Martin Duke Lifeline Earthquake
Engineering Award and the Alfredo Ang Award on Risk Analysis and Management of
Civil Infrastructure. Other recognitions during the Congress include the Eb Rice Lecture
Award, the Best Journal of Cold Regions Engineering Paper Award, and the Best Cold
Regions Conference Paper Award. An Opening Congress Reception, Duluth Section 100th
Anniversary Session and Social Event, and Technical Tours provided additional
opportunities for attendees to share ideas.
This collection of 60 papers brings together the current state of knowledge on a variety of
topic areas presented at the 2017 Congress on Technical Advancement and is separated
into three EBooks. The first represents selected papers from the Proceedings of the 17th
International Conference on Cold Regions Engineering. The second includes the papers on
Infrastructure Resilience, Aerospace and Energy. The third EBook presents papers
addressing Construction and Forensic Engineering.
I would like to thank all of the volunteers and ASCE Staff who have made this 1st
Congress on Technical Advancement and Proceedings possible. It could not have been
done without all of the authors, reviewers, attendees, and Congress Committee members.
Jon E. Zufelt, Ph.D., PE, D.WRE, F.ASCE Congress Chair and Proceedings Editor
© ASCE
Congress on Technical Advancement 2017
Acknowledgments
Downloaded from ascelibrary.org by RMIT UNIVERSITY LIBRARY on 01/03/19. Copyright ASCE. For personal use only; all rights reserved.
Congress Organizing Committee
Jon Zufelt, Ph.D, P.E., CFM, D.WRE, F.ASCE
James Anspach, P.G. (ret.), F.ASCE
Ron Anthony, Aff.M.ASCE
Hiba Baroud, Ph.D., Aff.M.ASCE
Ana Boras, Ph.D, P.E., M.ASCE
Martin Derby, A.M.ASCE
Mike Drerup, P.E., M.ASCE
Jim Harris, P.E., Ph.D, F.SEI, F.ASCE, NAE
John Hinzmann, P.E., M.ASCE
Jen Irish, Ph.D, P.E., D.CE, M.ASCE
John Koppelman, A.M.ASCE
Tom Krzewinski, P.E., D.GE, F.ASCE
Bob Lisi, P.E., M.ASCE
Juanyu "Jenny" Liu, Ph.D., P.E., M.ASCE
Pat McCormick, P.E., S.E., F.ASCE, F.SEI
Nick Patterson, P.E., M.ASCE
David Prusak, P.E., M.ASCE
Ziad Salameh, P.E., M.ASCE
J. "Greg" Soules, P.E., S.E., P.Eng, SECB, F.SEI, F.ASCE
Amy Thorson, P.E., F.ASCE
Nasim Uddin, P.E., F.ASCE
Joel Ulring, P.E., M.ASCE
ASCE Staff
Susan Davis, A.M.ASCE
Jon Esslinger, PE, F.ASCE, CAE
Mark Gable
Katerina Lachinova
Shingai Marandure
Amanda Rushing, Aff.M.ASCE
Jay Snyder, Aff.M.ASCE
Catherine Tehan, Aff.M.ASCE
Drew Caracciolo
© ASCE
iv
Congress on Technical Advancement 2017
v
Proceedings Reviewers
Downloaded from ascelibrary.org by RMIT UNIVERSITY LIBRARY on 01/03/19. Copyright ASCE. For personal use only; all rights reserved.
Il-Sang Ahn
Lorenzo Allievi
Ron Anthony
Navid Attary
Bilal Ayyub
Eugene Balter
Heather Brooks
Henry Burton
ZhiQiang Chen
Adrian Chowdhury
Edwin Clarke
Billy Connor
Craig Davis
An Deng
Alicia Diaz de Leon
Curt Edwards
Jon Esslinger
Caroline Field
Madeleine Flint
Chris Ford
Warren French
Subhrendu
Gangopadhyay
Rob Goldberg
Scott Hamel
John Henning
Jiong Hu
Baoshan Huang
© ASCE
Josh Huang
Joshua Kardon
Mehrshad Ketabdar
John Koppelman
Thomas Krzewinski
David Lanning
Spencer Lee
Jenny Liu
Hongyan Ma
Rajib Mallik
Tony Massari
Roberts McMullin
Ralph Moon
Anthony Mullin
Mark Musial
LeAnne Napolillo
Kevin Orban
Sivan Parameswaran
Tim Parker
Robert Perkins
Brian Phillips
Chris Poland
Allison Pyrch
Craig Ruyle
Bill Ryan
Stephan Saboundjian
Ziad Salameh
Andrea Schokker
Yasaman Shahtaheri
Jim Sheahan
Xiang Shu
John Smith
Ryan Solnosky
Greg Soules
Bucky Tart
Scott Tezak
Ganesh Thiagarajan
Eric Thornley
John Thornley
Jeff Travis
Nasim Uddin
Joel Ulring
Shane Underwood
Cindy Voigt
Dan Walker
Haizhong Wang
Chenglin Wu
Gang Xu
Zhaohui Yang
Kent Yu
John Zarling
Chris Zawislak
Weiguang Zhang
Jon Zufelt
Congress on Technical Advancement 2017
vi
Contents
Downloaded from ascelibrary.org by RMIT UNIVERSITY LIBRARY on 01/03/19. Copyright ASCE. For personal use only; all rights reserved.
Effect of the Presence of Pre-Service Construction Cracks in
Concrete Decks on the Thermal Profile of Composite Steel-Concrete
Bridges in Cold Regions ............................................................................................. 1
Omar Y. El Masri and Caesar Abi Shdid
Opportunities for Increased Utilization of Geothermal Resources in the
United States.............................................................................................................. 13
Gretchen E. Schimelpfenig
Effect of Diamond Grinding on Pervious Concrete............................................... 25
B. I. Izevbekhai
Effects of Aggregate Thermal Contraction Properties on Asphalt Mixture’s
Thermal Properties and Low Temperature Performance .................................... 37
Moses Akentuna and Sang-Soo Kim
Bagged Reinforced Concrete Shaft in Saline Soils in Cold Regions .................... 50
Yu Zhang, Jianhong Fang, Zhaohui (Joey) Yang, and Jiankun Liu
The Use of Electrical Resistivity Methods for Ground Ice Characterization
for Engineering ......................................................................................................... 59
Kevin Bjella, Misha Kanevskiy, and Kenneth Hinkel
Internal Observation of Soil in Frost Heave Process Using the X-Ray
CT Scan...................................................................................................................... 71
Baiyang Song, Dai Nakamura, Takayuki Kawaguchi, Shunzo Kawajiri,
Satoshi Yamashita, and Dahu Rui
Haughton-Mars Project at 20: Challenges and Designs for
Future Exploration ................................................................................................... 79
Sarah J. Seitz and Brian J. Glass
Evaluation of a Simulated Roadway Weather Information System’s
Pavement Temperature Data in Illinois ................................................................. 91
Wouter Brink, Carmine Dwyer, Gregg Larson, and William Vavrik
Methods and Quality of Embankments Constructed in Winter ........................ 102
Atsuko Sato, Toshihiro Hayashi, Teruyuki Susuki, and Shinichiro Kawabata
Numerical Modeling of Electrically Conductive Pavement Systems ................. 111
S. M. Sajed Sadati, Kristen Cetin, and Halil Ceylan
© ASCE
Congress on Technical Advancement 2017
Frost Resistance of High Early-Age Strength Concretes for Rapid Repair...... 121
Matthew Maler, Meysam Najimi, and Nader Ghafoori
Downloaded from ascelibrary.org by RMIT UNIVERSITY LIBRARY on 01/03/19. Copyright ASCE. For personal use only; all rights reserved.
Frost Resistance of Self-Consolidating Concrete Containing Natural
Pozzolan ................................................................................................................... 132
Meysam Najimi, Mohammad Reza Sharbaf, and Nader Ghafoori
Estimating Liquefaction Potential of Thawing Permafrost Soils, an
Evaluation of Frozen and Recently Thawed Soils ............................................... 141
John D. Thornley, Nick Moran, Andrew Daggett, and Thomas G. Krzewinski
Thermosyphon Design for a Changing Arctic ..................................................... 151
Edward Yarmak and Jason T. Zottola
Stress Analysis of the Phoenix Compacted Snow Runway to Support
Wheeled Aircraft .................................................................................................... 161
Ariana Sopher and Sally Shoop
Thermal Evaluation of Common Locations of Heat Loss in Sandwich
Wall Panels .............................................................................................................. 173
Taylor Sorensen, Sattar Dorafshan, and Marc Maguire
Wear of Steel and Heavy Duty Coating Caused by Friction of Sea Ice ............. 185
S. Kioka, N. Maruta, and T. Takeuchi
On the Thickness of Sacrificial Steel Wall for Protection of Sea Ice
Action ....................................................................................................................... 195
T. Takeuchi, S. Kioka, and H. Miyazaki
Comparing Ground Snow Load Prediction Methods in Utah............................ 207
Brennan Bean, Marc Maguire, and Yan Sun
© ASCE
vii
Congress on Technical Advancement 2017
Effect of the Presence of Pre-Service Construction Cracks in Concrete Decks on the
Thermal Profile of Composite Steel-Concrete Bridges in Cold Regions
Omar Y. El Masri1 and Caesar Abi Shdid2
Downloaded from ascelibrary.org by RMIT UNIVERSITY LIBRARY on 01/03/19. Copyright ASCE. For personal use only; all rights reserved.
1
Ph.D. Candidate, Dept. of Civil and Environmental Engineering, Syracuse Univ., Syracuse, NY
13210. E-mail:
[email protected]
2
Associate Professor and Chair, Dept. of Civil and Environmental Engineering, Lebanese
American Univ., 211 E 46th St., New York, NY 10017. E-mail:
[email protected]
Abstract
Thermally induced stresses in composite steel-concrete bridges are higher than those experienced
by their concrete and steel cousins, leading to significant damage in the concrete deck and
corrosion of the steel reinforcement. Bridge design engineers use thermal profiles prescribed by
codes such as AASHTO to predict future service stresses. A 3D finite element model is
presented that investigates the temperature distribution in a case study bridge with pre-existing
construction deck cracks. The non-linear transient simulation is performed using actual
environmental loads for a geographic region with severe climate (North Dakota), and the
resulting profile is compared to that of AASHTO. The results show the thermal gradient
proposed by AASHTO to be overly conservative in cold regions. Existing models seem to ignore
the nonlinearity of the thermal gradient, which can be critical for thermal stress calculations. The
pre-service deck cracks appear to have a considerable effect on both the vertical and the
longitudinal temperature distributions, and it is recommended that they be given careful
consideration by design codes.
1. Introduction and Justification
Bridges are subjected to continuously changing diurnal environmental conditions that lead to
continuous heat gain and loss with their surroundings. The thermal gradient that develops within
a bridge cross section is affected by four basic heat transfer phenomena: a- convection at the
surfaces, b- irradiation, c- solar radiation, and d- conduction within the bridge. While the solar
radiation intensity has the highest effect on changing the bridge temperature, the thermal gradient
is largely affected by the thermal diffusivity of the constituent materials. It is the difference in
this thermal diffusivity of concrete and steel that makes the thermal gradient in composite steelconcrete bridges rather high. The non-uniform temperature distribution within a bridge cross
section when combined with different coefficients of thermal expansion and shear connectors
that prevent slip between the concrete deck and steel girders, will lead to considerable thermal
stresses. These stresses are known to be relatively high when compared to service load stresses,
leading to considerable damage in the concrete deck. The major damage attributed to thermal
stresses is developing deck cracks. However, and despite its importance, limited studies have
been dedicated to investigating the temperature distribution in composite bridges [1,2,3].
Design codes, such as the American Association for State Highway and Transportation Officials
(AASHTO) LRFD Bridge Design Specifications, assert the importance of accounting for thermal
stresses in bridge design by providing designers with proposed thermal gradients that describe
© ASCE
1
Downloaded from ascelibrary.org by RMIT UNIVERSITY LIBRARY on 01/03/19. Copyright ASCE. For personal use only; all rights reserved.
Congress on Technical Advancement 2017
the vertical temperature distribution in bridges located in various geographic regions [4].
However, previous studies, on which the proposed AASHTO gradient is based, mostly consider
two- or one-dimensional models with, in some cases, even steady state analysis. They have thus
failed to consider the effect of construction cracks, which are pre-existing in the bridge deck, on
the temperature distribution within the deck in both the transverse and longitudinal directions.
These cracks are found to develop directly after the concrete deck casting and before the opening
of the bridge for traffic [5]. The work presented here uses a three-dimensional computational
model to examine the accuracy of presently used thermal profile models in cold regions.
2. Related Work
Analytical, numerical, and experimental investigations have led to the development of various
thermal profiles that have been adopted by different codes around the world. Zuk [1] developed
equations to calculate the longitudinal and transverse stresses in composite bridges under
different conditions of temperature and shrinkage. These equations were developed for four (4)
different and critical cases of temperature distribution; however, a uniform temperature for the
steel beam is adopted in all cases due to its high thermal conductivity and its ability to adjust its
temperature quickly to that of the surrounding environment [1]. In a later study, Berwanger [6]
developed a numerical procedure that uses two-dimensional thermo-elastic finite element
analysis (FEA) to predict the transient temperature in the cross sections of composite bridges.
Results showed a slower response for the concrete slab with a very rapid increase in thermal
moments. The study concluded that a linear temperature profile could be used satisfactorily to
represent the temperature in the transverse cross section. The study also stresses that possible
existing cracks in the concrete deck were ignored.
Thermal gradients used in composite bridges differ from one code to another. Imbsen et al. [2]
evaluated the thermal effects on bridge superstructures based on different codes. Many of the
findings and recommendations of this study were included in the following revision of the
AASHTO code: Thermal Effects in Concrete Bridge Superstructures [7]. Kennedy and Soliman
[8] synthesized the various theoretical and experimental studies that had been conducted on
composite concrete slab on steel beam bridges, and proposed a simple one dimensional vertical
temperature distribution within the section. The distribution they proposed is uniform through
the depth of the steel beam and is linear through the concrete deck. A study by Fu et al. [3]
concluded that a steady-state thermal condition never exists within a bridge structure, and that
the time dependency of the ambient air temperature and solar radiation would dictate a transient
analysis. A more recent thermal profile was proposed by Chen [9] based on numerical analysis
using two-dimensional finite element (FE) analysis. Emanuel and Taylor [10] conducted a
computer-based study on composite bridges to investigate the relationship between uniform,
linear, and non-linear components of thermally-induced stresses on the one hand and varying
span lengths, number of spans, and support conditions on the other hand. The study concluded
that the three components of thermally induced stresses are independent of the span length.
Bridge decks with overhangs present a problem for predicting the daily temperature in a cross
section due to the shading effect that they will have on the steel girders—an effect that will vary
between geographical locations and throughout the time of the day. An analytical parametric
study was conducted by Fu et al. [3] on composite bridges to determine the effects of shading.
© ASCE
2
Congress on Technical Advancement 2017
Downloaded from ascelibrary.org by RMIT UNIVERSITY LIBRARY on 01/03/19. Copyright ASCE. For personal use only; all rights reserved.
The study concluded the shading on the girders from the slab overhang to be the most influential
factor on the vertical thermal distribution [3]. Another study confirmed the previous theoretical
findings through temperature measurements on experimental bridge scaled models placed on the
roof of a building as well as on an existing steel bridge in Hong Kong. [11].
Cracks occur in concrete bridge decks in different forms: transverse cracks, longitudinal cracks,
and map cracks. Map cracks (also known as pattern cracks) are a very common form of cracking
in all types of concrete bridge decks. Map cracks initiate at the bottom of the concrete deck and
propagate their way up through the deck until they immerge at the surface where they appear like
a map with squiggly lines. Such cracks are often the product of improper curing where the
concrete surface moisture is allowed to evaporate too quickly, and the movement or shrinkage of
the concrete deck is restrained. Studies have found transverse cracks (cracks that run
perpendicular to the girders) to be the predominant form of cracking in the reinforced concrete
bridge decks [5,12]. Transverse cracks have been found to be of full depth of the deck and occur
at regular intervals of 0.9 to 3.1 meters apart along the bridge length [13, 14, 15], in both the
positive and negative moment regions of the bridge [16]. The widths of the cracks have been
reported in the range of 0.1 to 0.5 mm. These cracks have been observed along the entire length
of bridges, in both simple and continuous span construction. Ramey et al. [12] noted that
transverse cracks occur early during the construction process typically after the casting of the
concrete, and before the bridge has been placed in service.
3. Composite Bridge Model
The City of Fargo in North Dakota (Latitude: 46˚, 52’, 38”; Longitude: 96˚, 47’, 22”; Elevation:
275 m.), with its extremely cold winters and very warm summers, was selected as an appropriate
location for to represent cold regions. This choice is made because such extreme climate
highlights the vast thermal differentials that can develop in composite bridges, and consequently
produce high thermal stresses.
3.1 Time Domain
For any thermal stress calculations for bridges, two cases of temperature conditions must be
considered by an engineer in order to estimate the critical stresses for design. The first case is in
the summer when the deck is hotter than the steel beams, and the second case is in the winter.
The time domain chosen for this transient analysis consists of two 24-hour time spans occurring
over two separate days: December 23 and June 4. The selection was based on the lowest and
highest radiation intensity days of the year, respectively, for Fargo, ND. The selection was based
as such since it has been shown that the solar radiation has the highest influence on the thermal
gradients in bridges [11]. This presents an improvement over existing models that have always
assumed that the two days for the simulation that represent the critical thermal cases of the year
are those with the highest and lowest ambient temperatures, where these temperatures were
calculated based on existing sinusoidal empirical expressions [10]. A transient time step of one
hour, divided into four (4) equal increments, was used for the thermal simulation. This choice
was based on two factors: 1- the fact that weather data used is only available in increments of
one (1) hour; and 2- very little temperature, radiation, and wind speed changes occurred over a
time span of one hour.
© ASCE
3
Congress on Technical Advancement 2017
4
Downloaded from ascelibrary.org by RMIT UNIVERSITY LIBRARY on 01/03/19. Copyright ASCE. For personal use only; all rights reserved.
3.2 Bridge Model Properties
Colquitz River Bridge was selected as a case study for its typical nature of many composite steelconcrete bridges, and due to its perfectly symmetrical cross section. The bridge is located near
Victoria in British Columbia, Canada. The bridge length is 83 meters divided into five spans of
varying lengths, and it has a width of 11.9 m. The concrete deck is 18 cm thick resting on six
wide-flange (W33x141) steel girders equally spaced at 198 cm on center with 99 cm overhangs
on each side. The material properties that are used in the model are summarized in Table 1.
Table 1. Bridge Model Material Properties
Bridge
Part
Concrete
Steel
Unit
Modulus Poisson’s
Thermal
Coefficient of
Weight of Elasticity Ratio Thermal Expansion Conductivity
(Kg/m3)
(MPa)
(W/m K)
(cm/cm/oC)
2,400
7,850
26,435
200,000
0.2
0.3
10.8 E-6
11.7 E-6
0.7
42.5
Grade
Compressive
Strength (MPa)
NA
ASTM A992
28
NA
Given the bridge cross-sectional symmetry with respect to the longitudinal axis, only a portion of
the bridge cross section 4 m wide that includes an exterior girder and one adjacent interior girder
is needed to develop the thermal profile for the full cross section. Since the thermal stresses are
not sought after in this study, the full span and the corresponding support conditions are not
necessary to develop the thermal profile, and a 2.75 m longitudinal segment of the bridge was
modeled. The post-construction and pre-service transverse cracks in concrete decks were
incorporated in the model at a spacing of 0.9 m, a width of 0.51 mm, and extending the full depth
of the deck, as reported in the literature. The study assumes that the bridge is neither equipped
with a waterproofing system nor with a top asphalt pavement.
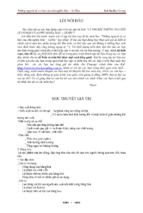
3.3 Environmental Loads and Boundary Conditions
Bridges are exposed to various environmental variables that lead to heat energy exchange
between their surfaces and the surrounding. This exchange is the reason behind the unsteady
thermal state within the bridge cross section. The different heat transfer components acting on
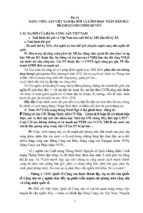
the boundaries of a bridge are visually depicted in Figure 1 and may be represented in terms of
heat flux as = + + , where q is rate of energy transfer, J/s-1 m2 or W/m2; qc is the rate
of energy convection; qr is the rate of thermal irradiation, and qs is the rate solar radiation energy.
The convection component of the heat flux equation, qc, is calculated using
= ℎ ( − ),
where hc is the convection heat transfer coefficient, W/m2 ˚C; T is the temperature of the surface,
˚C; and Ta is the ambient temperature, ˚C. The convective heat transfer coefficient is calculated
using the empirical formula suggested by Ibrahim [20] as ℎ = 4.67 + 3.83 for top surfaces,
ℎ = 2.17 + 3.83 for soffit surfaces and ℎ = 3.67 + 3.83 for steel webs and slab outer
surfaces, where u is the wind speed in m/s and hc is in W/m2. The air temperature and the wind
speed data for the two chosen days were obtained for the Hector International Airport in Fargo,
ND from the National Climatic Data Center [18]. This use of actual ambient temperature and
wind speed data for the actual location of the case study bridge represents an improvement over
existing models that have exclusively used data synthesized from semi-empirical expressions.
The irradiation component in the heat flux equation, qr, is calculated using ( − ), where
F is the Stefan-Boltzmann constant equals to 5.671 x 10⁻⁸ kg s-3 ˚K-4; T is the temperature of the
surface, oC; Ta is the ambient temperature, oC; and is the emissivity of the surface. The
© ASCE
Congress on Technical Advancement 2017
Downloaded from ascelibrary.org by RMIT UNIVERSITY LIBRARY on 01/03/19. Copyright ASCE. For personal use only; all rights reserved.
emissivitty value for concrete
c
and
d rusty steel and iron is rreported by A
ASHRAE [119] to be bettween
0.85 and 0.95. Thus, a value of 0.9
0 has been assigned in tthis study foor both materrials.
Figurre 1. Heat traansfer process in a bridgge exposed too environmeent
The heat radiation co
omponent off the heat flu
ux equation, q s, is calculaated using
, where is the
absorptiv
vity for solaar radiation; and
is th
he total houurly solar raadiation on a bridge surrface,
Btu/m2. The
T absorptiivity value fo
or concrete and
a rusty steeel and iron iis reported bby ASHRAE
E [19]
to be bettween 0.65 and
a 0.80. A value of 0.8 has been selected to bbe used in tthis study foor the
concrete slab and thee steel girderrs. The hourlly total solarr radiation on a bridgee surface conntains
three com
mponents: beam radiatio
on, diffuse radiation,
r
annd ground-reeflected radiaation. Duffiee and
Beckman
n [23] pro
ovided an expression to computte
as
=
+
+
, where is the totaal solar radiaation; is tthe beam soolar radiationn on a horizzontal
surface; is the difffuse radiatio
on on a horizzontal surfacce; I is the tootal radiation on a horizzontal
surface ( + ); is
i the angle of
o incidencee; is the zeenith angle; is the sloppe of the surrface;
is the diffused gro
ound reflecttion and is equal to 0.22. The expreession to deetermine coss is
cos ∅ sin cos +cos cos ∅ cos cos +cos sin ∅ sin
n cos coss
sin ∅ cos -
+cos siin sin sin
n , where ∅ is the su
urface latitudde;
is thee declination;
the suurface
azimuth angle; is hour angle. The hourly
y solar radiattion data at the selectedd location foor the
two chossen days, inccluding the beam
b
and difffused comp onents annd , were oobtained from
m the
National Renewable Energy Laboratory [21].
c
by th
he deck overrhang on thee web of the exterior girdder is
The hourrly height off the shade created
given by = (
, where Lc iis the lengthh of the overrhang slab inn cm;
)
is the solar altitud
de angle in degrees;
d
iss the surfacee azimuth anngle in degrees; is thhe sun
grees. The hourly
h
solar altitude anggle and sun aazimuth anggle were obtained
azimuth angle in deg
from the National Reenewable En
nergy Laborratory [21] fo
for the choseen bridge loccation and oon the
two seleccted days in June and Deecember. Su
uch actual meeasured dataa considers tthe actual alttitude
of the briidge above th
he sea level,, and how th
hat affects thee solar anglees.
© ASCE
5
Congress on Technical Advancement 2017
Downloaded from ascelibrary.org by RMIT UNIVERSITY LIBRARY on 01/03/19. Copyright ASCE. For personal use only; all rights reserved.
3.4 Finite Element Modeling
Studies on the thermal behavior of composite bridges found in the literature have conducted oneand two-dimensional FEA in which the temperature is assumed to remain constant along the
length, and sometimes the transverse width, of the bridge [3,23]. The 2D model is widely
accepted as an accurate approach for conducting transient heat transfer simulation in composite
bridges. However, such 1D and 2D models fall short of being able to model the thermal effect of
transverse cracks that have been repeatedly reported to exist prior to the bridge being put into
service. A 3D model is used in this study to better reflect the effect of such transverse cracks on
the temperature distribution within the bridge cross section.
The FE model of the bridge section is constructed using homogenous solid elements. Both
concrete deck and steel girders were modeled using 3D 8-node linear hexahedral heat transfer
mesh elements with temperature as a single degree of freedom at each node, and second-order
(quadratic) interpolation in three dimensions. The refined mesh elements measured 2.25 cm, thus
resulting in eight (8) elements along the depth of the concrete deck. The overall model measured
4 m in the transverse direction and 2.75 m in the longitudinal direction, with 0.51 mm wide
cracks spaced at 0.9 m in the longitudinal direction and stretching the entire width of the deck.
Uncoupled heat transfer analysis was conducted in which the temperature field was calculated
without consideration of any stresses or deformations. The nonlinearity in the analysis is the
result of the boundary conditions being nonlinear, and the latent heat properties of the elements.
The cracks were modeled as an open cavity element with constant size throughout the depth of
the deck equal to the width of the crack. The air inside the crack was given the same initial
conditions as the air outside the crack. Natural convection and surface irradiation interaction
properties are assigned to the two surfaces of each crack. Natural convection at the crack
surfaces is generated by density differences in the air occurring due to the temperature gradient
across the crack surface. Solar and diffused radiation were not accounted for at the crack surfaces
due to its small width and the inability of the radiations to reach such surfaces as shading is
provided by the adjacent surface. The contact direction with adjacent elements was modeled to
be normal to the vertical surfaces of the crack, and the environmental boundary conditions
(arranged in text files) are assigned to the surface elements that recall data from these files at
every transient time step.
Previous studies have indicated that initial temperature appears to have very little effect on the
temperature difference within a bridge deck [3,10]. Given this fact, the bridge temperature was
initially set to =0℃, and the environmental initial boundary conditions were set as obtained
from the National Climatic Data Center [18]. To ensure a full composite action between the
concrete deck and the steel girders with no slip, a “Tie” interaction was used at the contact
surface between the two components. This approach ensures a hard pressure over-closure
between the two surfaces and hence permits the heat to transfer through conduction. Surface
irradiation to the surrounding medium was modeled as a time dependent surface property
covering the whole model with uniform emissivity distribution and hourly ambient temperature
data. Three different sets of convection heat fluxes (for the top surfaces, soffit surfaces, and side
surfaces) were calculated and implemented in the FE model as boundary conditions.
© ASCE
6
Congress on Technical Advancement 2017
7
The vertical temperature distribution was obtained at four distinct critical positions within the
bridge. These positions are: Position I: midway between the cracks, for the exterior girder.
Position II: near the surface of the crack, for the exterior girder. Position III: midway between the
cracks, for the interior girder. Position IV: near the surface of the crack, for the interior girder
4.1 Exterior versus Interior Girders
An initial comparison of the vertical temperature distributions between the bridge sections at the
exterior and interior girders revealed similar results between Positions I and III on the one hand,
and Positions II and IV on the other hand. This similarity in the temperature profile was valid for
both simulated days. A maximum temperature differential of 0.45 ˚C was reached between the
two girders at time 8:00 on June 4, 2010. This small difference is due to the sun beams radiations
reaching the exterior steel web soon after sunrise. Yet, the shading effect on the exterior girder
for the remainder of the day results in the same temperature distribution for the two girders.
4.2 Absolute Maximum Temperature in the Section
120
Concrete
Deck
100
80
15
20
25
30
60
40
Steel
Girder
20
0
Temperature (˚C)
45
40
35
30
35
40
25
20
15
Position I
10
5
0
Elevation (in)
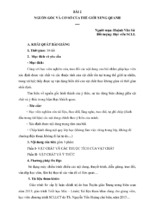
The absolute maximum temperature in the concrete deck is critical for calculating the bridge
thermal stresses resulting from the various components of thermal strains (uniform, linear, and
non-linear). On June 4, the temperature in the concrete deck reached a maximum value of 38.6
˚C at time 15:00 at position I. This temperature was recorded at the top surface of the concrete
deck as can be seen from the color contours in Figure 8. At this same time, the temperature at
position II reached a maximum value of 33.7 ˚C at the top end of the deck. The reason for this
difference of 4.8 ˚C in the maximum temperature between Positions I and II is the presence of
cracks, which appear to help the concrete deck surface at mid-depth to quickly adjust its
temperature to the transient conditions of the surrounding. This effect is more noticeable in the
summer than it is in the winter. Yet, a very high wind speed during the winter could lead to a
negative gradient at the crack position (Position II) due to forced air flow through the cracks.
Figure 2 provides the vertical temperature distribution at these two locations. It is worth noting
that due to solar radiations reflected from the ground, the temperature at the bottom surface of
the concrete deck tends to be slightly cooler right over the two steel girders than the regions
between the two girders and under the overhang.
Elevation (cm)
Downloaded from ascelibrary.org by RMIT UNIVERSITY LIBRARY on 01/03/19. Copyright ASCE. For personal use only; all rights reserved.
4. Discussion of Results
Figure 2. Vertical temperature distribution at Positions I and II (15:00, June 4)
© ASCE
Congress on Technical Advancement 2017
8
The absolute maximum temperature in the steel girder will also significantly affect the thermal
stresses in the bridge. On June 4, the temperature in the steel girder reached a maximum value of
28.6 ˚C at time 14:00 in the middle of the steel web. The maximum temperature on December 23
peaked at only -4.4 ˚C at 15:00 in the middle of the steel web.
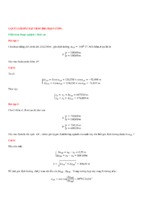
Results of the three-dimensional FE computations show that the vertical temperature distribution
in the steel web is almost uniform for the two selected days in June and December. This
temperature gradient is expected given the high thermal conductivity of steel and its ability to
adjust its temperature quickly to that of the surrounding environment. The computations show
that on June 4, the maximum vertical temperature differential between the steel girder and the
concrete deck occurred at time 18:00 and reached a maximum value of 11 ˚C (positive gradient),
as shown in Figure 3(a), at Position I. This value is less than half that suggested by Kennedy and
Soliman [8], which is 22.2 ˚C. The corresponding vertical temperature difference at Position II
was only 6 ˚C. It is interesting to note that the absolute maximum temperature differential was
reached at time 11:00 inside the concrete deck, and this is due to the low thermal diffusivity of
concrete. This difference between the top surface and the mid-depth of the concrete deck reached
a value of 11.2 ˚C. In fact, the top and bottom surfaces of the concrete deck are exposed to direct
and ground reflected solar radiations at time 11:00 during the heating process. These radiations,
in conjunction with the low thermal diffusivity of concrete, lead to a lower temperature at middepth of the deck as shown in Figure 3(a). After sunset, the thermal profile in the concrete deck,
provided in Figure 3(a) at time 22:00, shows that the concrete is the warmest at mid-depth of the
deck during the cooling process. This happens due to both top and bottom surfaces of the deck
losing heat to the surrounding by convection faster than the concrete at mid-depth. On December
23, the vertical temperature distribution is almost uniform for the entire day due to low ambient
temperature and solar radiation. The maximum negative differential temperature between the
steel girder and the concrete deck reached a value of 2 ˚C at time 7:00 at Position I, as shown in
Figure 3(b). This negative thermal gradient is due to the start of the heating process after sunrise.
After sunset (after 17:00), the temperature distribution in the bridge reached almost a steady state
with a maximum vertical temperature difference of 0.4 ˚C. Therefore, the cooling process had
negligible effects on the thermal gradient in December under normal environmental conditions.
120
80
60
40
20
0
45
(a)
Temperature (˚C)
10
15
(b)
40
35
20
25
30
35
40
11:00
18:00
22:00
30
25
20
15
Elevation (in)
100
Elevation (cm)
Downloaded from ascelibrary.org by RMIT UNIVERSITY LIBRARY on 01/03/19. Copyright ASCE. For personal use only; all rights reserved.
4.3 Vertical Temperature Distribution
-15
-10
-5
10
5
0
Figure 3. Vertical temperature distribution at Poisiton I (a) (June 4), (b) (7:00, December 23)
© ASCE
Congress on Technical Advancement 2017
9
The AASTO LRFD Bridge Design Specification [4] provides provisions for the vertical
temperature gradient in composite bridges. AASHTO LRFD [4] recommends that the vertical
temperature distribution be uniform in the steel girders and linear in the superimposed concrete
deck. The temperature differential in the concrete deck is based on the map of solar radiation
zones in the United States, in which the city of Fargo, ND is located in zone 2. For zone 2, the
AASHTO LRFD Bridge Design Specification [4] recommends a maximum positive vertical
temperature differential of 18.9 ˚C between the top and bottom surfaces of the concrete deck,
with a linear profile in between. The AASHTO temperature gradient and that proposed by
Kennedy and Soliman [8] are compared to that computed using the thermo-elastic analysis of the
FE model in June, as shown in Figure 4.
120
45
(a)
25
30
35
40
45
50
30
25
60
FE Model
40
AASHTO
15
20
Kennedy & Soliman
(1987)
10
0
Temperature (˚C)
20
5
0
40
100
35
20
45
(b)
Elevation (in)
80
120
40
100
Elevation (cm)
Downloaded from ascelibrary.org by RMIT UNIVERSITY LIBRARY on 01/03/19. Copyright ASCE. For personal use only; all rights reserved.
4.4 Comparison with Existing Models
80
35
20
25
30
35
40
50
30
25
60
20
15
40
10
20
0
45
5
Temperature (˚C)
0
Figure 4. Vertical temperature distribution at position I on June 4 at: (a) (18:00), (b) (11:00)
Figure 4(a) shows that the shape of the obtained vertical temperature distribution is very similar
to the one proposed by AASHTO and by Kennedy and Soliman [8]; however, the AASHTO
specification provides a maximum temperature differential of at least 7.9 ˚C higher than the one
obtained in this study at Position I (almost 13 oC at Position II). This difference is even more for
the model proposed by Kennedy and Soliman [8], which reaches 11 oC at Position I and about
16oC at Position II. This very conservative approximation adopted by AASHTO leads to
considerable error in assessing the thermal stresses in composite steel-concrete bridges in
locations as the one considered here.
Figure 4(b) shows a comparison of the vertical temperature distribution proposed by AASHTO
and by Kennedy and Soliman [8] to that obtained in this study at time 11:00. The relative error
between the two maximum temperature differentials in both profiles (AASHTO and proposed) is
7.7 ˚C. Another issue to consider is the nonlinearity of the thermal profile when compared with
the linear distribution proposed by AASHTO. In fact, the vertical temperature distribution in the
concrete deck was close to being linear only in the afternoon between time 14:00 and 19:00, and
nonlinear for the remainder of the day. This nonlinearity in the temperature distribution will
produce a nonlinear thermal strain component and its effects on the design of the bridge require
further investigation.
© ASCE
Downloaded from ascelibrary.org by RMIT UNIVERSITY LIBRARY on 01/03/19. Copyright ASCE. For personal use only; all rights reserved.
Congress on Technical Advancement 2017
10
It is thereefore eviden
nt that the vertical thermaal gradient pproposed by AASHTO ffor the considdered
climate is
i conservative in the concrete
c
decck due to seeveral reasonns: a) AASHTO complletely
ignores the
t effect off the depth of
o the concreete deck andd its effect oon the maxim
mum temperrature
differentiial. b) The thermal pro
ofile prescriibed by AA
ASHTO is bbased on a one dimenssional
conductio
on analysis,, and thus the
t solar rad
diation refleected from the ground is ignored. This
reflected radiation deecrease the positive
p
therrmal gradiennt through hheating the bbottom surfaace of
the conccrete deck. c) The AASHTO mod
del does nott take the ooverhang-to--depth ratioo into
consideraation. This ratio
r
has an effect on th
he maximum
m temperatuure differentiial of the crritical
exterior beam
b
throug
gh the shadin
ng effect. d) A linear verrtical temperrature distribbution is assuumed
by AASH
HTO in the concrete deeck at all tim
mes. e) AAS
SHTO does not accountt for the effeect of
pre-existing transverse construction cracks in
n the concreete deck, whhose effect teends to lesseen the
average temperature
t
differential between thee concrete deeck and the ssteel beam.
The AASHTO LRFD
L
[4] seems
s
to prrovide a sim
mple and ggeneral therm
mal gradiennt for
compositte bridges for
f various geographic regions. Hoowever, it iis shown heere to be ooverly
conservaative and sim
mplistic. By incorporatin
ng the aforeementioned points, the A
AASHTO m
model
can be revised
r
to obtain a morre accurate thermal graadient and tthe correspoonding maxiimum
temperatu
ure differen
ntials. This accuracy
a
willl help desiggners achievve a more opptimal desiggn by
better esttimating and
d accounting for the effeccts of the theermal stressees in compossite bridges.
4.5 Effeccts of Transvverse Deck Cracks
C
The com
mputations performed
p
show
s
that the
t
deck traansverse craacks have aan apparentt and
significan
nt effect on the
t thermal profile of th
he compositee bridge. Thiis effect is m
more noticeabble in
the summ
mer than it iss in the winter. Yet, a veery high win d speed duriing the winteer could leadd to a
negative gradient at the crack po
osition due to
t air flow tthrough the cracks. Thiss effect mannifests
itself in a reduction of
o the positiive thermal gradient
g
betw
ween the topp and bottom
m of the conncrete
deck, an
nd can be demonstrated
d
d by plotting
g the therm
mal profiles at Positionss I and II oor by
examinin
ng the temp
perature con
ntours for th
he positive aand negativve thermal ggradient casses in
Figure 5.. The variatio
on in the tem
mperature diffferentials between Posiitions I and III ranges bettween
3.1 and 5.6 ˚C in Ju
une. The hig
ghest differeence of 5.6 ˚C is reachhed at time 21:00 durinng the
p
of th
he bridge. In
n fact, the bridge
b
will eexperience fa
faster coolingg near the ccracks
cooling process
due to the faster heatt loss by convection at th
he crack surfface.
(a))
(b)
Figure
F
5. Teemperature distribution
d
at
a (a) 20:00,, June 4, (b) 10:00, Deceember 23
© ASCE
Congress on Technical Advancement 2017
Downloaded from ascelibrary.org by RMIT UNIVERSITY LIBRARY on 01/03/19. Copyright ASCE. For personal use only; all rights reserved.
The vertical temperature distribution in the concrete deck at Position I was nonlinear for most of
the day, while that at Position II has a much lower degree of nonlinearity due to the crack’s
effect in helping the concrete to quickly adjust its internal temperature to the ambient conditions.
Various codes and researchers ignore the temperature differentials in the longitudinal direction of
the bridge and assume them to be negligible when compared with the vertical temperature
distribution. The difference in the longitudinal temperature distribution is said not to exceed 15%
of the vertical temperature differential suggested by AASHTO [4]. The computations presented
here however indicate a maximum temperature differential of 6.3 ˚C in the longitudinal direction
of the bridge when compared to the vertical temperature differential of 9.4 ˚C. The longitudinal
temperature differential thus constitutes more than 67 % of the vertical temperature differential,
and the effect of this nonlinear longitudinal thermal gradient on the development of cracks and
nonlinear strains requires further assessment and cannot be treated in a trivial manner.
5. Conclusions and Recommendations
The effect of pre-existing transverse construction cracks in the concrete deck on the thermal
gradient in composite steel-concrete bridges was investigated using a non-linear transient
thermal analysis in 3D FE formulation. The following main conclusions are reached: 1) The
maximum positive vertical temperature differential between the concrete deck and steel girder
reached a maximum value of 11 ˚C in the summer, while vertical thermal gradient is almost
uniform for the entire day in winter, under normal environmental conditions. 2) For composite
bridges in geographic regions having climates similar to the one considered in this case study,
the AASHTO LRFD Bridge Design Specification is overly conservatively and overestimates the
vertical thermal gradient, which leads to significant error in assessing the thermal stresses in
composite steel-concrete bridges. The current AASHTO model is based on the 1989 guide
specifications, and needs to be updated with new findings taken into considerations. 3) The FE
model analysis show a nonlinear vertical temperature distribution in the concrete deck when
compared to the linear distribution proposed by AASHTO and other previously-suggested
models. This nonlinearity will create a nonlinear strain component that will create stresses
currently not considered by designers. 4) The longitudinal thermal gradient is more than 67% of
the vertical one. Its impact on the self-equilibrating transverse stresses in the bridge due to
sectional continuity, Poisson’s effect, and displacement compatibility at the interface of
consecutive sections needs further assessment. While the conclusions arrived at in this study can
be generally applicable to similar bridges in somewhat similar climates, they remain specific to
the bridge case under investigation. More numerical and experimental studies should be
conducted on bridges under different weather conditions to draw a better assessment of the
accuracy of currently used thermal gradient models, such as that of AASHTO in more moderate
climates.
References
[1]
[2]
© ASCE
Zuk, W. (1961). “Thermal and shrinkage stresses in composite beams.” ACI Journal, 58(9),
1529-1558.
Imbsen, R. A., Vandershaf, D. E., Schamber, R. A., and Nutt, R. V. (1985). “Thermal
effects in concrete bridge superstructures.” (NCHRP Report No. 276). Washington, DC:
Transportation Research Board.
11
Congress on Technical Advancement 2017
[3]
Downloaded from ascelibrary.org by RMIT UNIVERSITY LIBRARY on 01/03/19. Copyright ASCE. For personal use only; all rights reserved.
[4]
[5]
[6]
[7]
[8]
[9]
[10]
[11]
[12]
[13]
[14]
[15]
[16]
[17]
[18]
[19]
[20]
[21]
[22]
[23]
© ASCE
Fu, H. C., Ng, S. F., and Cheung, M. S. (1990). “Thermal behavior of composite bridges.”
J. Struct. Eng., 116(12), 3302-3323.
AASHTO . (2012). “LRFD Bridge Design Specifications.” Washington, DC.
Ramey, G. E., and Wright, R. (1994). “Assessing and enhancing the durability/longevity
performances of highway bridges.” (HRC Research Project 2-13506). Alabama: Auburn
University.
Berwanger, C. (1983). “Transient thermal behavior of composite bridges.” J. of Struct.
Eng., 109(10), 2325-2339.
AASHTO (Association of State Highway and Transportation Officials). (1989). “Guide
Specifications, Thermal Effects in Concrete Bridge Superstructures.” Washington, DC.
Kennedy, J. B., and Soliman, M. H. (1987). “Temperature distribution in composite
bridges.” J. of Struct. Eng., 113(3), 475-482.
Chen, Q. (2008). “Effects of thermal loads on Texas steel bridges.” Doctoral dissertation.
Emanuel, J. H., and Taylor, C. M. (1985). “Length-Thermal Stress Relations for Composite
Bridges.” J. of Struct. Eng., 111(4), 788-804.
Tong, M., Tham, L. G., and Au F. (2002). “Extreme thermal loading on steel bridges in
tropical region.” J. of Bridge Eng., 7(6), 357-366.
Ramey, G. E., Wolff, A. R., and Wright, R. L. (1997). “Structural design actions to
mitigate bridge deck cracking.” Practice Periodical on Structural Design and
Construction, 2(3): 118-124.
PCA (Portland Cement Association). (1970). “Final report – Durability of concrete bridge
decks – A cooperative study.” State Highway Departments of California, Illinois, Kansas,
Michigan, Minnesota, Missouri, New Jersey, Ohio, Texas, and Virginia.
Cheng, T. T. H., and Johnston, D. W. (1985). “Incidence assessment of transverse cracking
in concrete bridge decks: Construction and material considerations.” (Report No.
FHWA/NC/85-002,1).
Kosel, H. C., and Michols, K. A. (1985). “Evaluation of concrete deck cracking for
selected bridge deck structures of Ohio Turnpike.” Ohio: Construction Technology
Laboratory, Ohio Department of Transportation.
Krauss, P. D., and Rogalla, E. A. (1996). “Transverse cracking in newly constructed bridge
decks.” Transportation Research Board, (NCHRP Report No. 380). Washington, DC.
Emanuel, J. H., and Hulsey, J. L. (1978). “Temperature distributions in composite bridges.”
Journal of the Structural Division, 104(1), 65-78.
Ibrahim, A. M. (1995). “Three-dimensional thermal analysis of curved concrete box girder
bridges.” Master’s thesis, Concordia University, Montreal.
ASHRAE (American Society of Heating and Air conditioning Engineers). (1959).
“Heating, ventilating, air conditioning guide.” 37(52).
Duffie, J. A., and Beckman, W. A. (1991). Solar engineering of thermal process, Wiley,
New York.
NREL. (n.d.). National solar radiation database.
Elbadry, M. M., and Ghali, A. (1983). “Temperature variations in concrete bridges.” J. of
Struct. Eng., 109(10), 2355-2374.
Moorty, S., and Roeder, C. W. (1992). “Temperature-dependent bridge movements.” J.
Struct. Eng., 118(4), 1090-1105.
12