Downloaded from ascelibrary.org by RMIT UNIVERSITY LIBRARY on 01/04/19. Copyright ASCE. For personal use only; all rights reserved.
Coastal Structures
and Solutions to
Coastal Disasters 2015
Tsunamis
Proceedings of the Coastal Structures and Solutions
to Coastal Disasters Joint Conference 2015
Boston, Massachusetts
September 9–11, 2015
Edited by
Louise Wallendorf, P.E.
Daniel T. Cox, Ph.D.
Downloaded from ascelibrary.org by RMIT UNIVERSITY LIBRARY on 01/04/19. Copyright ASCE. For personal use only; all rights reserved.
COASTAL STRUCTURES AND
SOLUTIONS TO COASTAL
DISASTERS 2015
Tsunamis
PROCEEDINGS OF THE COASTAL STRUCTURES AND SOLUTIONS TO
COASTAL DISASTERS JOINT CONFERENCE 2015
September 9–11, 2015
Boston, Massachusetts
SPONSORED BY
Coasts, Oceans, Ports, and Rivers Institute of the
American Society of Civil Engineers
EDITED BY
Louise Wallendorf, P.E.
Daniel T. Cox, Ph.D.
Published by the American Society of Civil Engineers
Downloaded from ascelibrary.org by RMIT UNIVERSITY LIBRARY on 01/04/19. Copyright ASCE. For personal use only; all rights reserved.
Published by American Society of Civil Engineers
1801 Alexander Bell Drive
Reston, Virginia, 20191-4382
www.asce.org/publications | ascelibrary.org
Any statements expressed in these materials are those of the individual authors and do not
necessarily represent the views of ASCE, which takes no responsibility for any statement
made herein. No reference made in this publication to any specific method, product, process,
or service constitutes or implies an endorsement, recommendation, or warranty thereof by
ASCE. The materials are for general information only and do not represent a standard of
ASCE, nor are they intended as a reference in purchase specifications, contracts, regulations,
statutes, or any other legal document. ASCE makes no representation or warranty of any
kind, whether express or implied, concerning the accuracy, completeness, suitability, or
utility of any information, apparatus, product, or process discussed in this publication, and
assumes no liability therefor. The information contained in these materials should not be used
without first securing competent advice with respect to its suitability for any general or
specific application. Anyone utilizing such information assumes all liability arising from such
use, including but not limited to infringement of any patent or patents.
ASCE and American Society of Civil Engineers—Registered in U.S. Patent and Trademark
Office.
Photocopies and permissions. Permission to photocopy or reproduce material from ASCE
publications can be requested by sending an e-mail to
[email protected] or by locating a
title in ASCE's Civil Engineering Database (http://cedb.asce.org) or ASCE Library
(http://ascelibrary.org) and using the “Permissions” link.
Errata: Errata, if any, can be found at https://doi.org/10.1061/9780784480311
Copyright © 2017 by the American Society of Civil Engineers.
All Rights Reserved.
ISBN 978-0-7844-8031-1 (PDF)
Manufactured in the United States of America.
Coastal Structures and Solutions to Coastal Disasters 2015
Preface
Downloaded from ascelibrary.org by RMIT UNIVERSITY LIBRARY on 01/04/19. Copyright ASCE. For personal use only; all rights reserved.
For many years, the Coastal Structures and Solutions to Coastal Disasters conferences
have existed as independent meetings for coastal professionals to exchange ideas on
coastal protection and the vulnerability of the coastal infrastructure to coastal storms
(hurricanes, tsunamis, and cyclones) and variations in sea level.
We were fortunate to have both of these conferences in the United States in the same
year; together they provided attendees a more diverse forum for discussion of coastal
development, protection, and resiliency. A truly resilient community requires the active
input of scientists and engineers in conjunction with community planners and managers,
social scientists, policy makers, and the community itself. Given the public’s enjoyment
of the coast as residents or visitors, we must all use care and restraint to preserve and
enhance our waterfront for future generations.
Coastal Structures and Solutions to Coastal Disasters Joint Conference 2015 is
sponsored and organized by the Coastal Structures Committee, Coastal Zone
Management Committee, and Solutions to Coastal Disasters Organizing Committee of
the Coasts, Oceans, Ports, and Rivers Institute of the American Society of Civil
Engineers. Committee members of all COPRI Coastal Committees were actively
involved in the development of the conference program and organization of the
conference.
The Joint Conference efforts were led by:
Louise Wallendorf, P.E., M.ASCE, Conference Co-Chair
Daniel Cox, Ph.D., Conference Co-Chair
Brian Caufield, P.E., CFM, M.ASCE, Local Chair
Lesley Ewing, Ph.D., P.E., D.CE, M.ASCE, Technical Chair
Christopher Jones, P.E., M.ASCE, Technical Chair
Approximately 260 abstracts were submitted for consideration by the Conference
Technical Committee, consisting of over 40 individuals who reviewed abstracts and
served as Moderators. The Technical Committee chose 94 for publication in the Coastal
Structures and Solutions to Coastal Disasters Proceedings and 26 for publication in the
Coastal Structures and Solutions to Coastal Disasters: Tsunamis Proceedings. These
120 papers reflect the combined coastal conferences’ full diversity, and are organized
into two volumes covering:
© ASCE
iii
Coastal Structures and Solutions to Coastal Disasters 2015
iv
Downloaded from ascelibrary.org by RMIT UNIVERSITY LIBRARY on 01/04/19. Copyright ASCE. For personal use only; all rights reserved.
Coastal Structures and Solutions to Coastal Disasters:
Sea Level Rise and Climate Change; Natural and Nature-based Designs for
Coastal Defense; Wave Run up and Overtopping; Wave Loads on Coastal
Structures; Tsunamis; Wave-Soil-Structure Interaction; Armor Stability;
Urban Shorelines and Coastal Structures; Coastal Risk and Resilience; Sea
Level Rise and Climate Change; Advances in Coastal Modelling; Case
Studies; Performance-based Design of Coastal Infrastructure; Field
Measurements and Forensic Studies; Hurricanes and Coastal Storms ;Urban
Shorelines; Social and Behavioral Aspects of Coastal Disasters; Coastal
Hazards Mapping; Coastal Erosion and Shoreline Change; Vulnerability
Assessment and Loss Estimation
Coastal Structures and Solutions to Coastal Disasters: Tsunamis
Tsunami Generation & Modelling; Tsunami Measurement & Debris;
Tsunami Mitigation; Tsunami Morphology/Sediments; Tsunami Structures
The success of this Conference has relied on the contributions of the authors who
submitted their work for our consideration. The preparation of conference abstracts,
papers, and presentations is a demanding process, and our sincere thanks go out to all of
those who have participated.
We would like to thank the volunteers who reviewed abstracts, papers, moderated
sessions, and who served on the Technical Committees for the success of the Coastal
Structures and Solutions to Coastal Disasters Joint Conference 2015.
This conference proceedings is dedicated to Orville T. Magoon (1928–2016), who had
the foresight to encourage/instigate/and inspire us all to develop creative solutions for
the world’s coasts.
Sincerely and with great appreciation,
Louise Wallendorf, P.E., M.ASCE
Conference Co-Chair
U.S. Naval Academy
Daniel T. Cox, Ph.D.
Conference Co-Chair
Oregon State University
Acknowledgments
We appreciate the enthusiastic support of the conference planning committee members
Lesley Ewing, Chris Jones, and Brian Caufield. The metropolitan Boston Community
embraced the conference and provided valuable insight to the local community.
© ASCE
Coastal Structures and Solutions to Coastal Disasters 2015
Contents
Downloaded from ascelibrary.org by RMIT UNIVERSITY LIBRARY on 01/04/19. Copyright ASCE. For personal use only; all rights reserved.
Tsunami Generation and Modelling
Modeling Tsunami Sources and Their Propagation in the Atlantic Ocean for
Coastal Tsunami Hazard Assessments and Inundation Mapping along the
U.S. East Coast ...............................................................................................................................1
Stéphan Grilli, Annette R. Grilli, Babak Tehranirad, and James T. Kirby
The 1975 Kitimat Landslide Tsunami: Validation and Comparative Testing
of Modeling Strategies .................................................................................................................13
James T. Kirby, Fengyan Shi, Dmitry Nicolsky, Gangfeng Ma, Shubhra Misra, and
Pramod Rao
Hydro-Acoustic Wave Generation during the Tohoku-Oki 2011 Earthquake ......................24
A. Abdolali, James T. Kirby, Giorgio Bellotti, S. Grilli, and J. C. Harris
Tsunami Measurements and Debris
ASCE 7 Structural Load Provisions for Impact by Tsunami-Driven Shipping
Containers .....................................................................................................................................35
H. R. Riggs, Clay J. Naito, Christina Cercone, and Yong Wei
Tracking of “Smart” Debris Location Based on the RFID Technique ...................................43
N. Goseberg, I. Nistor, and J. Stolle
Flood-Induced Debris Dynamics over a Horizontal Surface ...................................................54
J. Stolle, I. Nistor, N. Goseberg, T. Mikami, T. Shibayama, R. Nakamura, and S. Matsuba
USGS SAFRR Tsunami Scenario Debris Management Assessment of Californian
Port Facilities ................................................................................................................................65
T. R. Norton and P. Moore
Tsunami Mitigation
Tsunami Disaster Risk Management in Greece ........................................................................76
G. M. Karagiannis and C. E. Synolakis
Numerical Simulation of Hydrodynamic Interference Effects on Coastal Twin
Bridge Decks under Hurricane Waves ......................................................................................87
Guoji Xu and C. S. Cai
Future Tsunami Disaster Mitigation—Lessons Learnt from the Great East Japan
Earthquake and Tsunami Disaster.............................................................................................98
Shigeo Takahashi, Takashi Tomita, and Ken-ichiro Shimosako
© ASCE
v
Coastal Structures and Solutions to Coastal Disasters 2015
Using New LiDAR to Update Old Tsunami Hazard Maps on the Island of Hawaii ...........110
J. Mull, E. Drei-Horgan, K. MacDougall, and E. Simmons
Downloaded from ascelibrary.org by RMIT UNIVERSITY LIBRARY on 01/04/19. Copyright ASCE. For personal use only; all rights reserved.
Tsunami Morphology/Sediments
A Study on the Tenacity of Coastal Dikes Constructed by Clay and Lean Cement
Mixed Soil against Tsunami Overflow .....................................................................................118
Takahide Honda, Yukinobu Oda, Kazunori Ito, Hiroyasu Ishii, and Tomoyuki Takabatake
Study on Tsunami Scour at the Landward Toe of a Coastal Dike and the Tsunami
Force on Its Armor Blocks ........................................................................................................128
T. Nakamura, Y. Nezasa, N. Mizutani, and Y. Kotake
Numerical Simulation on Scour behind Seawalls Due to Tsunami Overflow ......................137
Dong Wang, Taro Arikawa, Shaowu Li, and Hayao Gen
Does a Morphological Adjustment during Tsunami Inundation Increase Levels
of Hazards? .................................................................................................................................145
B. Tehranirad, J. T. Kirby, S. T. Grilli, and F. Shi
Tsunami-Induced Beach Profile Changes with Different Initial Profiles .............................154
Y. Kuriyama, Y. Uno, K. Honda, and K. Takahashi
Tsunami Structures
Characteristics of a Tsunami Wave Using a Hybrid Tsunami Generator ...........................164
Adi Prasetyo, Tori Tomiczek, Tomohiro Yasuda, Nobuhito Mori, and Hajime Mase
Numerical Analysis on Tsunamis Overtopping Caisson Breakwaters and the
Stability of Armor Units ............................................................................................................176
J. Mitsui, A. Matsumoto, M. Hanzawa, and K. Nadaoka
Stability of a Breakwater with Steel Pipe Piles under Tsunami Overflow ...........................187
Shin Oikawa, Taro Arikawa, Yoshiaki Kikuchi, Akihiko Yahiro, and Kenichiro Shimosako
Wave Force Reduction Effect of Wave-Dissipating Works against a Tsunami
with Soliton Fission ....................................................................................................................200
Sohei Maruyama, Tomotsuka Takayama, Kenichiro Shimosako, Akihiko Yahiro,
Kojiro Suzuki, Toru Aota, Masashi Tanaka, Akira Matsumoto, and Minoru Hanzawa
Development and Installation of a Flap-Gate Seawall against Tsunamis ............................212
Yuichiro Kimura, Katsuya Shimizu, Masaaki Wani, Mitsuhiro Yasuda, Hiroki Kimura,
and Hajime Mase
Experimental Generation of Tsunami-Like Waves ................................................................219
D. Wüthrich, I. Nistor, M. Pfister, and A. J. Schleiss
© ASCE
vi
Coastal Structures and Solutions to Coastal Disasters 2015
Tsunami Response Analysis of Pile-Supported RC Buildings in Onagawa Town
Due to the 2011 Great East Japan Earthquake and Tsunami ...............................................227
Yoshihiro Okumura, Takuya Yane, and Junji Kiyono
Downloaded from ascelibrary.org by RMIT UNIVERSITY LIBRARY on 01/04/19. Copyright ASCE. For personal use only; all rights reserved.
Dynamic Behaviour of a Flexible Membrane Tsunami Barrier with Dyneema ..................235
Bas Hofland, Roelof Marissen, and Otto Bergsma
Experimental Study on Tsunami Characteristics Flowing over Coastal Dikes
with Different Shapes ................................................................................................................246
Shota Seto, Yoshimitsu Tajima, Takenori Shimozono, and Hideyuki Nakao
A Method for Estimating the Reflected Tsunami Inundation Depth at the Front
of an RC Building with an Aperture ........................................................................................258
H. Matsutomi
© ASCE
vii
Coastal Structures and Solutions to Coastal Disasters 2015
Modeling Tsunami Sources and Their Propagation in the Atlantic Ocean for Coastal
Tsunami Hazard Assessments and Inundation Mapping along the U.S. East Coast
Stéphan Grilli1; Annette R. Grilli2; Babak Tehranirad3; and James T. Kirby4
Downloaded from ascelibrary.org by RMIT UNIVERSITY LIBRARY on 01/04/19. Copyright ASCE. For personal use only; all rights reserved.
1
Dept. of Ocean Engineering, Univ. of Rhode Island, Narragansett, RI 02882, USA. E-mail:
[email protected]
2
Dept. of Ocean Engineering, Univ. of Rhode Island, Narragansett, RI 02882, USA. E-mail:
[email protected]
3
Center for Applied Coastal Research, Univ. of Delaware, Newark, DE 19716, USA. E-mail:
[email protected]
4
Center for Applied Coastal Research, Univ. of Delaware, Newark, DE 19716, USA. E-mail:
[email protected]
ABSTRACT
Numerical simulations are performed to develop tsunami inundation maps for the U.S. East
Coast (USEC), as envelopes of surface elevations caused by the probable maximum tsunamis
(PMTs) in the Atlantic Ocean basin. These PMTs are triggered by various sources, identified
from historical records or hypothetical, including : (i) near-field submarine mass failures (SMF)
on or near the continental shelf break; (ii) an extreme hypothetical M9 seismic event occurring in
the Puerto Rico Trench; (iii) a repeat of the historical 1755 M9 (Lisbon) earthquake occurring in
the Madeira Tore Rise; and (iv) large scale volcanic flank collapses (80 and 450 km3) of the
Cumbre Vieja volcano (CVV) on La Palma, in the Canary Archipelago. Tsunamis caused by: (1)
earthquakes, are obtained from the estimated coseismic seafloor deformation; (2) SMF sources,
modeled as rigid slumps, are generated using the 3D non-hydrostatic model NHWAVE; and (iii)
the CVV sources are modeled as subaerial flows of a heavy fluid, using a 3D Navier-Stokes
model. For each source, tsunami propagation to the USEC is then modeled in a series of nested
grids of increasingly fine resolution, by one-way coupling, using FUNWAVE-TVD, a nonlinear
and dispersive (2D) Boussinesq model. High-resolution inundation maps have been developed
based on these results, so far for about a third of the USEC. A comparison of coastal inundation
from each tsunami source shows similar alongshore patterns of higher and lower inundation,
whatever the initial source direction; this is due to wave focusing and defocusing effects induced
by the shelf bathymetry. Once developed for the entire USEC, inundation maps will fully
quantify coastal hazard from the selected PMTs and allow developing site-specific mitigation
measures and evacuation plans. Besides maximum inundation, other “products” available at
high-resolution are maximum momentum flux, currents, and vorticity, although these are not
systematically developed as maps in this phase of work.
INTRODUCTION
Since 2010, under the auspice of the US National Tsunami Hazard Mitigation Program
(NTHMP; http://nthmp.tsunami.gov/index.html), the authors have performed tsunami modeling
work to develop high-resolution tsunami inundation maps for the US east coast (USEC), starting
with the most critical or vulnerable areas, but eventually to cover the entire coast. These first
generation maps are constructed as envelopes of maximum inundation caused by the most
extreme near- and far-field tsunami sources, a.k.a., Probable Maximum Tsunamis (PMTs), both
historical and hypothetical, in the Atlantic Ocean basin, without considering their return period
© ASCE
1
Coastal Structures and Solutions to Coastal Disasters 2015
Downloaded from ascelibrary.org by RMIT UNIVERSITY LIBRARY on 01/04/19. Copyright ASCE. For personal use only; all rights reserved.
or probability. Probabilistic tsunami hazard analyses may be part of future generations of
inundation maps.
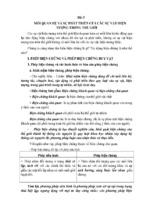
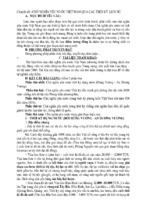
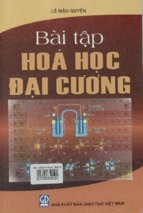
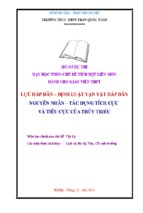
Figure 1: (a) Locations of near- and far-field tsunami sources in Atlantic Ocean, and
footprint and ETOPO1 bathymetry (m) of FUNWAVE-TVD’s 1 arc-min grid G1; (b)
zoom-in on USEC, with footprints of 3 regional 20 arc-sec nested grids G2 (NRG, MRG,
SRG).
Tsunami sources leading to the PMTs included (Fig. 1a; see also ten Brink et al., 2008): (i)
far-field seismic sources : (1) a series of Mw 9 sources in the Madeira Tore Rise, representing
possible sources of the 1755 Lisbon earthquake (LSB), and (2) a Mw 9 source in the Puerto Rico
Trench (PRT; e.g., Grilli et al., 2010), corresponding to an entire failure of the 600 km long
trench; (ii) extreme flank collapses (80 or 450 km3 volume) of the Cumbre Vieja Volcano (CVV)
on La Palma (Canary Islands; e.g., Abadie et al., 2012; Tehranirad et al., 2015); and (iii) nearfield Submarine Mass Failures (SMFs) on or near the USEC continental shelf break. Areas prone
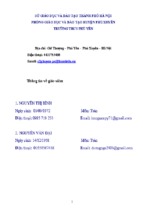
to tsunami-genic SMFs were first identified based on Monte Carlo slope stability analyses (Grilli
et al., 2009), which showed that SMF tsunami hazard is highest north of Cape Hatteras, a region
where USGS identified and parameterized numerous SMF scars from historical SMFs on the
continental shelf and shelf break (ten Brink et al., 2014), with the most prominent one being the
historical 165 km3 Currituck (CRT) underwater land-slide (Geist et al., 2009; Grilli et al.,
2015a). Based on a geotechnical analysis of site specific data, 4 areas deemed at higher SMF risk
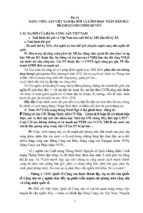
and having sufficient sediment accumulation for a large SMF (Fig. 2) were selected for analysis.
According to the PMT approach used in first-generation maps, SMF tsunami sources in these 4
areas were modeled with the approximate geometry (volume, dimensions, depth) of the CRT
slide in a site specific orientation: these are referred to as SMF CRT proxy tsunami sources.
METHODOLOGY
Tsunami propagation model
Tsunami propagation from each source to the USEC was modeled using the nonlinear and
dispersive two-dimensional (2D) Boussinesq long wave model (BM) FUNWAVE-TVD, in a
series of nested grids of increasing resolution, by a one-way coupling method. FUNWAVE-TVD
is a newer implementation of FUNWAVE (Wei et al., 1995), which is fully nonlinear in
Cartesian grids (Shi et al., 2012) and weakly non-linear in spherical grids (Kirby et al., 2013).
The model was efficiently parallelized for use on a shared memory cluster (over 90% scalability
is typically achieved), which allows easily using large grids. FUNWAVE and then FUNWAVE© ASCE
2
Downloaded from ascelibrary.org by RMIT UNIVERSITY LIBRARY on 01/04/19. Copyright ASCE. For personal use only; all rights reserved.
Coastal Structures and Solutions to Coastal Disasters 2015
TVD have been widely used to simulate tsunami case studies (e.g., Grilli et al., 2007; Ioualalen
et al., 2007; Tappin et al., 2008, 2014; Abadie et al., 2012; Tehranirad et al., 2015; Grilli et al.,
2010, 2013, 2015a,b). As discussed in introduction, since 2010, the authors have used this model
and related methodology to compute tsunami inundation maps for the USEC, as part of the
NTHMP work (e.g., Abadie et al., 2012; Grilli and Grilli, 2013a; Grilli et al., 2015; Tehranirad et
al., 2015; see http://chinacat.coastal.udel.edu/nthmp.html) and also for several other tsunami
hazard assessment studies of coastal nuclear power plants in the U.S. Both spherical and
Cartesian versions of FUNWAVE-TVD were validated through benchmarking and approved for
NTHMP work (Tehranirad et al., 2011).
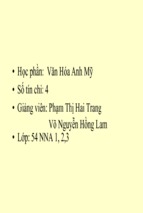
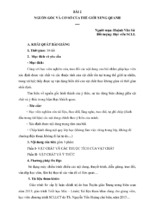
Figure 2: Left: Locations of historical CRT slide complex and of 4 areas where CRT SMF
proxies are sited. Right: location and direction of motion of SMF proxies sited in areas 1-4
(subplots a-d); each subplot represents the footprint of the NHWAVE grid used to simulate
the SMF tsunami sources. Color scales are bathymetry/topography in meter.
As they include frequency dispersion effects, BMs simulate more complete physics than
models based on Nonlinear Shallow Water Equations (NSWE), which until recently were
traditionally used to simulate co-seismic tsunami propagation. Dispersive models are necessary
to accurately simulate landslide tsunamis, which are typically made of shorter and hence more
dispersive waves than co-seismic tsunamis (Watts et al., 2003). However, dispersion is also
important for modeling propagation and coastal impact of co-seismic tsunamis, since undular
bores can occur near the crest of incident long waves, in increasingly shallow water (Madsen et
al., 2008).The importance of dispersion for modeling tsunami propagation was confirmed by
running FUNWAVE in both BM and NSWE modes, by Tappin et al. (2008) for the 1998 Papua
New Guinea landslide tsunami, and by Ioualalen et al. (2007) for the 2004 Indian Ocean and
Kirby et al. (2013) for the 2011 Tohoku, coseismic tsunamis.
Simulations of tsunami propagation are performed in nested grids (Figs. 1, 3a), using a oneway coupling method, in which time series of surface elevation and depth-averaged current are
computed for a large number of stations/numerical wave gages, defined in a coarser grid, along
the boundary of the finer grid used in the next level of nesting. Computations are fully performed
in the coarser grid and then are restarted in the finer grid using the station time series as
boundary conditions. As these include both incident and reflected waves computed in the coarser
grid, this method closely approximates open boundary conditions. It was found that a nesting
© ASCE
3
Coastal Structures and Solutions to Coastal Disasters 2015
Downloaded from ascelibrary.org by RMIT UNIVERSITY LIBRARY on 01/04/19. Copyright ASCE. For personal use only; all rights reserved.
ratio with a factor 3-4 reduction in mesh size allowed achieving good accuracy in tsunami
simulations. Note that to prevent reflection in the first grid level, sponge layers are used along all
the offshore boundaries.
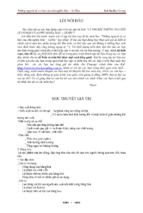
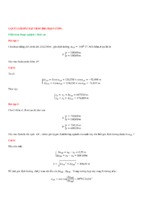
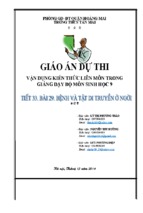
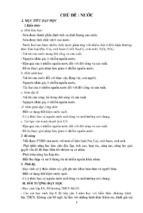
Figure 3: Simulations with FUNWAVE-TVD of the Mw 9 PRT seismic source in 1 arc-min
grid G1 (truncated at Lon. E. -55; Fig. 1a): (a) Initial surface elevation of tsunami source
computed in lower red box with Okada’s (1985) method, based on 12 SIFT sub faults (Gica
et al., 2008; Grilli et al. 2013b); the upper red box is the area of the 20 arc-sec nested grid
G2-NRG (Figs. 1b, 6); (b,c) instantaneous surface elevations after t = 1h 42 min and 3h 20
min of propagation; (d) envelope of maximum surface elevation over a 6h simulation. Color
scales are surface elevation in meter.
For the 3 far-field sources (LSB, PRT, CVV), simulations are initiated in a 1 arc-min (about
1800 m) resolution ocean basin scale spherical grid G1, covering the footprint of Fig. 1a (with
100 to 200 km wide sponge layers on offshore boundaries), in which tsunami sources are
specified as initial conditions. The first level of nested grids are 3 regional 20 arc-sec (about 500600 m) spherical grids G2, referred to as NRG, MRG and SRG (Fig.1b). For the near-field SMF
sources, simulations are directly initiated in grids G2, based on sources computed with
© ASCE
4
Downloaded from ascelibrary.org by RMIT UNIVERSITY LIBRARY on 01/04/19. Copyright ASCE. For personal use only; all rights reserved.
Coastal Structures and Solutions to Coastal Disasters 2015
NHWAVE (see next section). To compute detailed inundation maps, tsunami simulations for all
sources are continued in finer nested Cartesian grids of about 125, 30 and 10 m resolution. For
each grid level, whenever possible, bathymetry and topography are interpolated from data of
accuracy commensurate with the grid resolution. In deeper water, we use NOAA’s 1 arc-min
ETOPO-1 data (Fig. 1); in shallower water and on continental shelves, we use NOAA’s NGDC
3” (about 90 m) and 1” (about 30 m) Coastal Relief Model data and, finally, onshore, we use
NOAA’s 10 m resolution tsunami DEMs, if available, or the equivalent FEMA data if not.
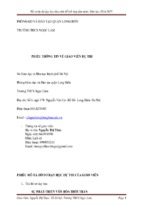
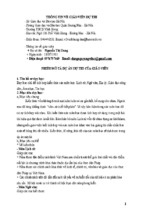
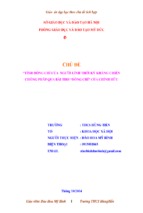
Figure 4: Simulations with FUNWAVE-TVD of the Mw 9 LSB seismic source in 1 arc-min
grid G1: (a) Close-up of Madeira Tore Rise (1) with bathymetry/topography (m); (b,c)
initial tsunami surface elevation computed with Okada’s (1985) method, for 15 and 345
deg. strike, respectively (Grilli and Grilli, 2013a); (d) instantaneous surface elevation after t
= 6h 30 min of propagation; (e,f) envelope of maximum surface elevation over a 9h
simulation for (b) and (c), respectively. Color scales are surface elevation in meter.
Along the shore, FUNWAVE-TVD has an accurate moving shoreline algorithm that
identifies wet and dry grid cells. Bottom friction is modeled by a quadratic law with a constant
friction coefficient. In the absence of more specific data we used the standard value Cd = 0.0025,
which corresponds to coarse sand and is conservative as far as tsunami runup and inundation.
Earlier work indicates that tsunami propagation results are not very sensitive to the friction
coefficient values in deeper water, but that they are in shallower water; in particular, the modeled
wave height decay over a wide shallow shelf is strongly affected by bottom friction (Tehranirad
et al., 2015). Finally, dissipation from breaking waves is modeled using a front tracking (TVD)
© ASCE
5
Coastal Structures and Solutions to Coastal Disasters 2015
Downloaded from ascelibrary.org by RMIT UNIVERSITY LIBRARY on 01/04/19. Copyright ASCE. For personal use only; all rights reserved.
algorithm and switching to NSWEs in grid cells where breaking is detected (based on a breaking
criterion). Earlier work shows that numerical dissipation in NSWE models closely approximates
the physical dissipation in breaking waves (Shi et al., 2012).
Figure 5: Simulations with FUNWAVE-TVD of the 80 km3 CVV flank collapse source in
grid G1 (Fig. 1a): (a,b) Initial surface elevation (m) and horizontal velocity module (m/s) of
tsunami source at t = 20 min; (c) Instantaneous surface elevation after t = 8 h; (d) envelope
of surface elevation over 10 h. Color scales are surface elevation (meter).
Tsunami source generation models
The initial surface elevation of far-field seismic sources (LSB, PRT) is specified in
FUNWAVE-TVD (with no velocity) based on the co-seismic seafloor deformation computed
using Okada’s (1985) method, as a function of fault plane parameters (e.g., Fig. 3a, Fig. 4a,b,c);
this is acceptable since water is nearly incompressible and raise times are usually small. Okada’s
© ASCE
6
Downloaded from ascelibrary.org by RMIT UNIVERSITY LIBRARY on 01/04/19. Copyright ASCE. For personal use only; all rights reserved.
Coastal Structures and Solutions to Coastal Disasters 2015
method solves a three-dimensional (3D) elasticity problem for a homogeneous half-space with a
dislocation specified over an oblique plane. Single or multiple fault planes can be used and for
each of those the required parameters are the fault plane area (width W and length L), depth d at
the source centroid, centroid location (lat-lon), 3 angles for orientation of the fault plane (dip,
rake, strike) and the shear modulus (µ) of the medium (10-60 Gpa, for shallow rupture in
soft/poorly consolidated marine sediment to deep rupture in basalt). The moment magnitude of
the anticipated earthquake is defined as Mo (J) = µ LWS, where S denotes fault slip. Therefore,
besides the geometrical and material parameters, to complete the source parameterization, one
needs either the slip value or the Mo value of the considered event (or its magnitude, Mw =
(logMo )/1.5 − 6, on a base 32 log scale).
The far-field source for the CVV flank collapse is computed using the 3D multi-material
Navier-Stokes model THETIS, as a subaerial slide represented by a heavy Newtonian fluid of
density 2.9 (see details in Abadie et al., 2012). Once the slide has stopped moving and most of its
energy has been transferred to the water motion, surface elevation and depth-averaged currents
are re-interpolated into a FUNWAVE-TVD horizontal grid of 1000 m resolution, to further
compute tsunami propagation, and then at t = 20 min into the event, into grid G1.
Finally, for near-field SMF sources, tsunami generation is computed with the 3D nonhydrostatic model NHWAVE, using a 500 m resolution Cartesian horizontal grid and a coarse
vertical grid made of a few boundary fitting (sigma) layers; 3 to 5 such layers are usually
sufficient to achieve a good accuracy (Ma et al., 2012). Here, all CRT SMF proxies are assumed
to be rigid slumps, which is conservative as far as tsunami generation, with their geometry and
kinematics specified as bottom boundary condition in NHWAVE, from the parameters of the
CRT slide (see details in Grilli et al., 2015a).
RESULTS
Source parameters, tsunami generation, and oceanic propagation
Here, we give results of the parametrization, initialization and initial propagation in
FUNWAVE-TVD’s 1 arc-min grid G1, of the three far-field sources (PRT, LSB and CVV), and
of the four CRT SMF proxy sources in 20 arc-sec grids G2 (Fig. 1). For a historical case such as
LSB, the source is based on both the estimated magnitude and location/geometry of the failure.
The largest hypothetical earthquake in a subduction zone such as PRT can be inferred from
potential slip estimated as the convergence rate (e.g., mm/year) times the number of years
considered for the event return period. With this approach, Grilli et al. (2010) for instance found
that a Mw 9.1 PRT earthquake corresponds to a 600 year return period, while a Mw 8.1 earthquake
to only 40 years. For the CVV flank collapse, we considered both the most extreme scenario of
450 km3 and the most probable extreme scenario of 80 km3 (Abadie et al., 2012; Tehranirad et
al., 2015). As indicated before, the near-field SMF sources are parameterized as CRT proxies,
sited in areas 1 to 4 in Fig. 2. Details of parameterization, tsunami generation, and initial oceanic
propagation for each source are given in the following.
Far-field PRT source: As in Grilli et al. (2010), we are modeling an extreme Mw = 9 seismic
source in the PRT, corresponding to the entire trench rupturing north of Puerto Rico (Figs. 1a,
3a), over a 600 km length. Unlike in this earlier work, where only one fault plane was used, to
better model the curved geometry of the trench, we use 12 individual sub-fault planes with
parameters obtained from the SIFT data base (“Short-term Inundation Forecast for Tsunamis”;
Gica et al., 2008). Each sub-fault is thus a “SIFT-unit source” of magnitude Mw = 7.5, length L =
© ASCE
7
Downloaded from ascelibrary.org by RMIT UNIVERSITY LIBRARY on 01/04/19. Copyright ASCE. For personal use only; all rights reserved.
Coastal Structures and Solutions to Coastal Disasters 2015
100 km, width W = 50 km, with a 1 m slip; with these parameters, we find µ = 35.6 GPa.
Moreover the location, depth and orientation of each subfault plane (strike, dip and rake angles)
is based on the local geology (see details in Grilli and Grilli, 2013b). The slip of each subfault is
then scaled for the total magnitude to be Mw = 9, or Mo = 3.162 1022 J; thus, S = (Mo/12)/(LWµ) =
14.8 m. Using these parameters in Okada’s model, we find the initial surface elevation shown in
Fig. 3a, which varies between -6 and +8 m. Figs. 3b and c show instantaneous surface elevations
computed in grid G1 with FUNWAVE-TVD after 1h 42 min and 3h 20 min of propagation,
respectively, and Fig. 4d shows the envelope of maximum surface elevations, over 6h of
simulations. Results show a fairly narrow and directional train of the largest tsunami waves
aimed almost directly north (towards the upper USEC), with elevations of order 2 m, and some
westward propagation affecting the lower USEC, but to a lesser extent, with elevations of order 1
m. The detailed near-field impact of this source in Puerto Rico and Hispaniola was detailed in
Grilli et al. (2010) and Grilli et al. (2015b), respectively.
Figure 6: Instantaneous surface elevations of the CRT SMF proxy in Area 1 (Fig. 2)
computed in 20 arc-sec grid G2-NRG (Figs. 1b, 3a): (a) with NHWAVE at t = 13 min; and
(b) with FUNWAVE-TVD at t = 1h 18 min. Instantaneous surface elevation computed in
grid G2 with FUNWAVE-TVD for the : (c) PRT tsunami at t = 4 h; (d) CVV tsunami at t =
8 h. Color scale is elevation and black contour bathymetry, both in meter.
Far-field LSB sources: The exact location and parameters of the 1755 LSB event (Fig. 1a),
which is the basis for this Mw 9 seismic source, are unknown. As part of the NTHMP work, Grilli
and Grilli (2013a) modeled a dozen sources of this magnitude, sited at various locations in the
Açores convergence zone, with parameters selected based on earlier published work. Strike
© ASCE
8
Downloaded from ascelibrary.org by RMIT UNIVERSITY LIBRARY on 01/04/19. Copyright ASCE. For personal use only; all rights reserved.
Coastal Structures and Solutions to Coastal Disasters 2015
angle, in particular, which strongly affects the tsunami directionality, was varied to cause
maximum impact on various sections of the USEC. They found that maximum impact on the
USEC was created by sources sited in the Madeira Tore Rise (Fig. 4a), which is the westernmost
potential site for the historical earthquake. Parameters of the fault plane are (Barkan et al., 2008):
(i) fault plane center: -10.753 E Lon. 36.042 N Lat., (ii) L = 317 km, (iii) W = 126 km, (iv) dip
angle: 40 deg., (v) rake angle: 90 deg., (vi) strike angle: 15 to 345 deg.; (vii) S = 20 m, and (viii)
µ = 40 GPa, which yields Mo = 3.162 1022 J or Mw = 9. All other parameters being equal, Grilli
and Grilli (2013a) found that a strike angle of 15 deg. led to the maximum impact on the upper
USEC, while an angle of 345 deg. caused maximum impact on the lower USEC and in the
Carribeans and Hispaniola. Figs. 4b and c show the two seismic sources based on these
parameters and 2 strike angles, respectively, computed with Okada’s model; we see an over 10 m
initial surface elevation. Fig. 4d shows the instantaneous surface elevation for the first source,
simulated with FUNWAVE-TVD in grid G1, after 6h 30 min of propagation, and Figs. 4e and f
show the envelopes of maximum surface elevations obtained for each source, over 9h of
simulations. Maximum tsunami impact clearly has the expected directionality for both sources,
but overall (in this coarse grid) maximum onshore elevations are only up to 1 m along the USEC.
Figure 7: Maximum surface elevations (b,c, x-axis in meter) computed at 5 m depth with
FUNWAVE-TVD, as a function of distance along the USEC (b,c, y-axis in km; states
identified in (a) by colors), for the CVV tsunami, from the 80 (blue) and 450 (red) km3
sources, compared to the: (b) PRT; and (c) CRT SMF proxy (Area 1), tsunamis (black).
Far-field volcanic collapse sources (CVV): The surface elevation and velocity of the 80 km3
CVV flank collapse source (from Abadie et al., 2012) are shown in Figs. 5a,b, 20 min after the
event; at that time, we see a concentric wave train with elevations ranging between -35 and +35
m, velocity modules up to 2 m/s, and a clear directionality in the WSW direction. Fig. 5c shows
the instantaneous surface elevation computed with FUNWAVE-TVD in grid G1, 8h into the
event. Despite the long propagation distance, very large waves with elevations in the range -3 m
to +3 m are approaching the USEC. Fig. 5d shows the envelope of maximum surface elevations
computed over 10h of simulations; in this coarse grid, most of the USEC would experience over
3 m nearshore surface elevations. [It should be noted that the very large elevations in (d,e) west
© ASCE
9
Downloaded from ascelibrary.org by RMIT UNIVERSITY LIBRARY on 01/04/19. Copyright ASCE. For personal use only; all rights reserved.
Coastal Structures and Solutions to Coastal Disasters 2015
of Hispaniola are spurious and due to grid coarseness; these disappear in finer nested grids.]
Maximum impact occurs in Cape Hatteras and Florida, but in the latter location, there appears to
have large wave decay over the wide shelf. Tehranirad et al. (2015) showed that this is
essentially an effect of bottom friction. Note that results for the 450 km3 CVV (not detailed
here), are qualitatively similar to those of the smaller source, except that elevations are about 3
times larger (see Abadie et al., 2012 and Tehranirad et al., 2015 for details).
Near-field SMF sources: Grilli et al. (2015a) modeled each of the CRT SMF proxy sources
sited in Areas 1 to 4 (Fig. 2) in 3D using NHWAVE. They determined that all the wave
generation was completed before 13.3 min and hence at that stage reinterpolated the computed
surface elevation and depth-averaged velocity into FUNWAVE-TVD grids to continue the
simulations. We proceed similarly here and Fig. 6a shows the initial surface elevation computed
with NHWAVE for the SMF in Area 1, interpolated into the 20 arc-sec G2-NRG grid (Fig. 1b);
elevations at this stage range between -10 and +10 m and there are two main trains of waves,
propagating on-shore and offshore, respectively. Fig. 6b then shows instantaneous surface
elevations computed with FUNWAVE-TVD for this case, after 1h 18 min.
Nearshore tsunami propagation and coastal impact
For each tsunami source, the nearshore propagation is simulated with FUNWAVE-TVD in a
series of nested grids of increasingly fine resolution. Figs. 6b,c and d, for instance compare the
surface elevations simulated in the 20 arc-sec grid G2-NRG (Fig. 1b) for the CRT SMF proxy
(Area 1), PRT, and CVV tsunamis, respectively. We see that, despite the very different sources
for these three cases and their widely different locations (i.e., nearshore, south and east of the
considered area), all tsunami wave trains, due to refraction over the wide shallow shelf, are
nearly aligned with the 50 m isobath and start focusing away from the Hudson River canyon, and
onto the western Long Island and northern New Jersey shores.
This focusing-defocusing behavior is also quite apparent in the envelopes of maximum
surface elevations in Figs. 3d, 4e,f and 5d, for the PRT, LSB and CVV tsunamis, respectively,
and more clearly illustrated in Fig. 7, which plots the maximum surface elevations computed at a
5 m depth off the USEC, as a function of the distance along shore, for the PRT and CRT SMF
proxy (area 1), as compared to the CVV 80 and 450 km3 cases. Despite large differences in
elevation magnitude, we see very similar along-shore patterns of elevation/inundation for all
tsunami sources. Hence, there is a strong control of the bathymetry on tsunami coastal impact;
Tehranirad et al. (2015) further illustrated the latter for the CVV tsunamis by drawing incident
wave rays.
Results of detailed simulations of tsunami inundation in nested grids, developed into 10 or 30
m resolution inundation maps, are left out due to lack of space.
CONCLUSIONS
We presented the methodology for and overall results of modeling work conducted to
simulate tsunami hazard along the USEC. Based on this work, many tsunami inundation maps
have been developed, so far for the most critical areas of the USEC, but eventually for the entire
coast. Detailed reports on the latter and actual maps can be found on the project webpage at:
http://chinacat.coastal.udel.edu/nthmp.html.
Acknowledgments The authors gratefully acknowledge support from the National Tsunami
Hazards Mitigation Program grants NA14NWS4670041 and NA15NWS4670029.
© ASCE
10
Coastal Structures and Solutions to Coastal Disasters 2015
Downloaded from ascelibrary.org by RMIT UNIVERSITY LIBRARY on 01/04/19. Copyright ASCE. For personal use only; all rights reserved.
REFERENCES
Abadie, S., J.C. Harris, S.T. Grilli and R. Fabre (2012). “Numerical modeling of tsunami waves
generated by the flank collapse of the Cumbre Vieja Volcano (La Palma, Canary Islands):
tsunami source and near field effects,” J. Geophys. Res., 117, C05030.
Barkan, R., ten Brick, U.S., Lin, J. (2008). “Far field tsunami simulations of the 1755 Lisbon
earthquake: Implication for tsunami hazard to the U.S. East Coast and the Caribbean,”
Marine Geol., 264, 109-122.
Gica, E., M. C. Spillane, V. V. Titov, C. D. Chamberlin, and J. Newman (2008). “Development
of the forecast propagation database for NOAAs Short-Term Inundation Forecast for
Tsunamis,” NOAA Tech. Memo. OAR PMEL-139.
Grilli A.R. and S.T. Grilli (2013a). “Modeling of tsunami generation, propagation and regional
impact along the U.S. East Coast from the Azores Convergence Zone,” Research Report no.
CACR-13-04, 20 pp, University of Delaware. http://www.oce.uri.edu/grilli/grilli-grilli-cacr13-04.
Grilli A.R. and S.T. Grilli (2013b). “Modeling of tsunami generation, propagation and regional
impact along the upper U.S East coast from the Puerto Rico trench,” Research Report no.
CACR-13-02, 18 pp., University of Delaware http://www.oce.uri.edu/grilli/grilli-grilli-cacr13-02.
Grilli, A.R., Grilli S.T., David, E. and C. Coulet (2015b). “Modeling of tsunami propagation in
the Atlantic Ocean Basin for tsunami hazard assessment along the North Shore of
Hispaniola,” In Proc. 25th Offshore and Polar Engng. Conf. (ISOPE15, Kona, HI, USA.
June 21-27, 2015), 733-740.
Grilli, S.T., Ioualalen, M, Asavanant, J., Shi, F., Kirby, J. and Watts, P. (2007). “Source
Constraints and Model Simulation of the December 26, 2004 Indian Ocean Tsunami,” J.
Waterway Port Coast. Oc. Engng., 133(6), 414-428.
Grilli, S.T., S. Dubosq, N. Pophet, Y. Prignon, J.T. Kirby and F. Shi (2010). “Numerical
simulation and first-order hazard analysis of large co-seismic tsunamis generated in the
Puerto Rico trench: near-field impact on the North shore of Puerto Rico and far-field impact
on the US East Coast,” Nat. Haz. Earth Syst. Sc., 10, 2109-2125.
Grilli, S.T., J.C. Harris, T. Tajalibakhsh, T.L. Masterlark, C. Kyriakopoulos, J.T., Kirby and F.
Shi (2013). “Numerical simulation of the 2011 Tohoku tsunami based on a new transient
FEM co-seismic source: Comparison to far- and near-field observations,” Pure Appl.
Geophys., 170, 1333-1359.
Grilli S.T., O’Reilly C., Harris J.C., Tajalli-Bakhsh T., Tehranirad B., Banihashemi S., Kirby
J.T., Baxter C.D.P., Eggeling T., Ma G. and F. Shi (2015a). “Modeling of SMF tsunami
hazard along the upper US East Coast: Detailed impact around Ocean City, MD,” Nat. Haz.,
76(2), 705-746.
Ioualalen, M., Asavanant, J., Kaewbanjak, N., Grilli, S.T., Kirby, J.T. and P. Watts (2007).
“Modeling the 26th December 2004 Indian Ocean tsunami: Case study of impact in
Thailand,” J. Geophys. Res., 112, C07024.
Kirby, J.T., Shi, F., Tehranirad, B., Harris, J.C. and S.T. Grilli (2013). “Dispersive tsunami
waves in the ocean: Model equations and sensitivity to dispersion and Coriolis effects,”
Ocean Modell., 62, 39-55.
Ma G., Shi F., Kirby J.T. (2012). “Shock-capturing non-hydrostatic model for fully dispersive
surface wave processes,” Ocean Modell., 4344, 2235.
Madsen P.A., D.R. Fuhrman and H. A. Schaffer (2008) “On the solitary wave paradigm for
© ASCE
11
Downloaded from ascelibrary.org by RMIT UNIVERSITY LIBRARY on 01/04/19. Copyright ASCE. For personal use only; all rights reserved.
Coastal Structures and Solutions to Coastal Disasters 2015
tsunamis,” J. Geophys. Res., 113, C12012.
Okada, Y. (1985). “Surface deformation due to shear and tensile faults in a half space,” Bull.
Seismol. Soc. America, 75(4), 1135-1154.
Shi, F., J.T. Kirby, J.C. Harris, J.D. Geiman and S.T. Grilli (2012). “A High-Order Adaptive
Time-Stepping TVD Solver for Boussinesq Modeling of Breaking Waves and Coastal
Inundation,” Ocean Modell., 43-44, 36-51.
Tappin, D.R., Watts, P., S.T. Grilli (2008). “The Papua New Guinea tsunami of 1998: anatomy
of a catastrophic event,” Nat. Haz. Earth Syst. Sc., 8, 243-266.
Tappin D.R., Grilli S.T., Harris J.C., Geller R.J., Masterlark T., Kirby J.T., F. Shi, G. Ma, K.K.S.
Thingbaijamg, and P.M. Maig (2014). “Did a submarine landslide contribute to the 2011
Tohoku tsunami ?” Mar. Geol., 357, 344-361.
Ten Brink, U., Twichell D., Geist E., Chaytor J., Locat J., Lee H., Buczkowski B., Barkan R.,
Solow A., Andrews B., Parsons T., Lynett P., Lin J., and M. Sansoucy (2008). “Evaluation of
tsunami sources with the potential to impact the U.S. Atlantic and Gulf coasts,” USGS
Administrative report to the U.S. Nuclear Regulatory Commission, 300 pp.
Tehranirad B., Harris J.C., Grilli A.R., Grilli S.T., Abadie S., Kirby J.T. and F. Shi (2015). “Farfield tsunami impact in the north Atlantic basin from large scale flank collapses of the
Cumbre Vieja volcano, La Palma,” Pure Appl. Geophys., 28pps. doi:10.1007/s00024-0151135-5 (published online 07/21/15).
Tehranirad, B., Shi, F., Kirby, J. T., Harris, J. C. and Grilli, S. (2011). “Tsunami benchmark
results for fully nonlinear Boussinesq wave model FUNWAVE-TVD, Version 1.0,”
Research Report No. CACR-11-02, University of Delaware.
Watts P., Grilli S.T., Kirby J.T., Fryer G.J. and D.R. Tappin (2003) “Landslide tsunami case
studies using a Boussinesq model and a fully nonlinear tsunami generation model,” Nat. Haz.
Earth Syst. Sc., 3, 391-402.
Wei, J., Kirby, J.T, Grilli, S.T. and Subramanya, R. (1995). “A Fully Nonlinear Boussinesq
Model for Surface Waves. Part 1. Highly Nonlinear Unsteady Waves,” J. Fluid Mech., 294,
71-92.
© ASCE
12