Health and Quality of Life Outcomes
BioMed Central
Open Access
Research
The reliability, validity, and preliminary responsiveness of the Eye
Allergy Patient Impact Questionnaire (EAPIQ)
Michael Alexander1, William Berger2, Patricia Buchholz3, John Walt4,
Caroline Burk5, Jeff Lee4, Rob Arbuckle*6 and Linda Abetz6
Address: 1Niagara Clinical Research, 5673 North Street, Niagara Falls, Ont L2G1J4, Canada, 2Southern California Research, 27800 Medical Center
Road, Suite 240, Mission Viejo, CA 92691, USA, 3Allergan, Inc., Ettlingen GmbH, Pforzheimer Str. 160, Ettlingen 76275, Germany, 4Allergan, Inc.,
2525 Dupont Drive, Irvine, CA 92612, USA, 5CT Burk, Inc., 1337 Cerritos Drive, Laguna Beach, CA 92651, USA and 6Mapi Values Ltd, Adelphi
Mill, Grimshaw Lane, Bollington, Macclesfield, Cheshire SK10 5JB, UK
Email: Michael Alexander -
[email protected]; William Berger -
[email protected]; Patricia Buchholz -
[email protected];
John Walt -
[email protected]; Caroline Burk -
[email protected]; Jeff Lee -
[email protected];
Rob Arbuckle* -
[email protected]; Linda Abetz -
[email protected]
* Corresponding author
Published: 31 October 2005
Health and Quality of Life Outcomes 2005, 3:67
doi:10.1186/1477-7525-3-67
Received: 18 August 2005
Accepted: 31 October 2005
This article is available from: http://www.hqlo.com/content/3/1/67
© 2005 Alexander et al; licensee BioMed Central Ltd.
This is an Open Access article distributed under the terms of the Creative Commons Attribution License (http://creativecommons.org/licenses/by/2.0),
which permits unrestricted use, distribution, and reproduction in any medium, provided the original work is properly cited.
Patient functioningocular allergypsychometric validationEAPIQpatient reported outcomes
Abstract
Background: The Eye Allergy Patient Impact Questionnaire (EAPIQ) was developed based on a
pilot study conducted in the US and focus groups with eye allergy sufferers in Europe. The purpose
of this study was to present the results of the psychometric validation of the EAPIQ.
Methods: One hundred forty six patients from two allergy clinics completed the EAPIQ twice
over a two-week period during the fall and winter allergy seasons, along with concurrent measures
of health status, work productivity, and utility. Construct validity, reliability (internal consistency
and test-retest), concurrent, known-group, and clinical validities, and responsiveness of the EAPIQ
were assessed. Known-group validity was assessed by comparing EAPIQ scale scores between
patients grouped according to their self-rating of ocular allergy severity (no symptoms, very mild,
mild, moderate, severe, very severe). Clinical validity was assessed by assessing differences in
EAPIQ scores between groups of patients rated by their clinician as non-symptomatic, mild,
moderate, and severe.
Results and Discussion: Results from the validation study suggested the deletion of 14 of 43
items (including embedded questions) that required patients to complete the percentage of time
they were troubled by something (daily activity limitations/emotional troubles). These items yielded
a significant amount of missing or inconsistent data (50%). The resulting factor analysis suggested
four domains: symptoms, daily life impact, psychosocial impact, and treatment satisfaction. When
included as separate scales, the symptom-bother and symptom-frequency scales were highly
correlated (> 0.9). As a consequence, and due to superior discriminative validity, the symptom
bother and frequency items were summed. All items met the tests for item convergent validity
(item-scale correlation = 0.4). The success rate for item discriminant validity testing was 97% (itemscale correlation greater with own scale than with any other). The criterion for internal consistency
reliability (alpha coefficient ≥ 0.70) was met for all EAPIQ scales (range 0.89–0.93), as was the
Page 1 of 11
(page number not for citation purposes)
Health and Quality of Life Outcomes 2005, 3:67
http://www.hqlo.com/content/3/1/67
criterion for test-retest reliability (intraclass correlation [ICC] ≥ 0.70). Largely moderate
correlations between the scales of the EAPIQ and the mini Rhinoconjunctivitis Quality of Life
Questionnaire (miniRQLQ) and low correlations with the Health Utilities Index 2/3 (HUI2/3) were
indicative of satisfactory concurrent validity. The EAPIQ symptoms, Daily Life Impact, and
Psychosocial Impact scales were able to distinguish between patients differing in eye allergy
symptom severity, as rated by patients and clinicians, providing evidence of satisfactory knowngroup and clinical validities, respectively. Preliminary analyses indicated the EAPIQ Symptoms, Daily
Life Impact, and Psychosocial Impact scales to be responsive to changes in eye allergies.
Conclusion: Following item reduction, construct validity, reliability, concurrent validity, knowngroup validity, and preliminary responsiveness were satisfactory for the EAPIQ in this population
of ocular allergy patients.
Background
The term ocular allergy is used to describe a number of
distinct disease entities, ranging from allergic conjunctivitis, a relatively mild condition, to keratoconjunctivitis, a
sight-threatening condition affecting the cornea [1]. All
could be described as atopic conditions affecting the conjunctiva and the surrounding structures of the eye, including the eyelids. Underlying immune mechanisms
responsible have not been clarified, but it is believed that
IgE related mast cell and eosinophil mediated inflammation leads to the release of mast cell mediators and toxic
eosinophil granule proteins and enzymes. Ocular allergy
affects approximately 15% of the world population, and
its incidence is increasing in industrialised countries [2].
Elsewhere it has been reported that approximately 20% of
the population in temperate climates suffer from allergic
rhinoconjunctivitis [3]. Patients suffering from ocular
allergy might experience such symptoms as red, itchy,
burning, swollen or dry eyes in differing degrees of severity and duration. Some patients might only be affected for
a few weeks, while others may experience symptoms continuously throughout the year. Thus, ocular allergy potentially affects patients in their daily life activities, thereby
impacting their health-related quality of life (HRQoL). In
particular, people suffering from ocular allergy may be
limited in performing daily activities such as reading,
computer work, and going outside.
In order to treat patients effectively it is necessary to know
which treatments work best and which treatments
patients prefer to use. Patient reported outcomes instruments can be used to determine which drugs have the
greatest effect on patient reported HRQoL, treatment satisfaction, and work productivity. Given the plethora of
drugs on the market, patient reported outcomes data can
provide patients and clinicians guidance as to which treatments are most beneficial for ocular allergy patients.
The EAPIQ (Appendix [see Additional file 1]), an ocular
allergy-specific questionnaire, was recently developed to
evaluate the impact of eye allergies on patient functioning
and daily activities, and to assess patient satisfaction with
treatment, for use in clinical trials. In addition, three questionnaires measuring the HRQoL of patients with ocular
allergy have been identified in the literature. They are as
follows: the Rhinoconjunctivitis Quality of Life Questionnaire (RQLQ) with standardised activities, the miniRQLQ
and the Allergic Conjunctivitis Quality of Life Questionnaire. Previous versions of the EAPIQ have been used in
studies in Europe and US, and results have been presented
as posters [4,5]. The objective of the present study was to
further validate the questionnaire by investigating the psychometric properties of the EAPIQ in a sample of patients
with ocular allergies, in US and Canada.
Methods
Subjects and study design
This was an observational validation study involving
patients with ocular allergy (data collected between October 2002 and March 2003). There were 146 ocular allergy
patients in two allergy clinics in US and Canada. All 146
patients were administered the EAPIQ, and the two concurrent measures at baseline seven to ten days later, 79 of
these patients were administered the EAPIQ a second time
in addition to the Health Change questionnaire (for the
assessment of test retest reliability).
The patients were stratified by the clinicians into four
groups based on the severity of their symptoms based on
their clinic experience: 'no current symptoms' (n = 34),
'mild symptoms' (n = 40), 'moderate symptoms' (n = 42),
and 'severe symptoms' (n = 30).
Measures
The following measures were administered during the
study:
EAPIQ (Appendix [see Additional file 1])
A patient perspective questionnaire consisting of 49 items
developed to measure ocular allergy symptoms and their
impact on HRQoL, work productivity and treatment satisfaction. The EAPIQ was developed at Allergan from ocular
Page 2 of 11
(page number not for citation purposes)
Health and Quality of Life Outcomes 2005, 3:67
http://www.hqlo.com/content/3/1/67
Table 1: Purpose of psychometric tests
Property
Purpose
Item convergent validity
To assess an item's correlation with its own hypothesized sub-scale score (satisfied if correlation
achieved is ≥ 0.40)
To assess whether an item considered in isolation has a higher correlation with its hypothesized scale
than with other scales in the questionnaire
To evaluate the extent to which individual items of the instrument are consistent to one another and
reflect an underlying scheme or construct (satisfied if Cronbach's alpha coefficient = 0.70 is achieved)
Assesses the extent to which the measure yields the same results in repeated applications in an
unchanged population. The intra-class correlation coefficient (ICC) was used as a measurement of testretest reliability, and was assessed in patients who reported their health status to be stable between
baseline (week 0) and study end (7 to 10 days later) (satisfied if an ICC coefficient = 0.70 is achieved)
Refer to a high percentage of patients scoring the lowest score possible and a high percentage of patients
achieving the highest score possible, respectively. High baseline floor or ceiling effects are indicative of a
scale that is limited in its responsiveness to clinical change. Minimal floor and ceiling effects are therefore
recommended. For the EAPIQ scales a percentage of 20% at floor or at ceiling was considered a
significant effect
To determine whether the concepts measured in the individual scales (domains) of the EAPIQ were
distinct and that none of the domains were redundant
Concurrent validity was supported if the EAPIQ sub-scales were substantially correlated (≥ 0.40), with
miniRQLQ sub-scales measuring similar concepts. Conversely, sub-scales measuring unrelated concepts
should be poorly correlated. As a generic measure of health status the HUI2/3 was expected to be less
strongly correlated with the EAPIQ scales
Differences in EAPIQ scores were expected among groups of patients known to differ in their patientevaluated health status
Clinical validity assesses the ability of scores to discriminate among groups of patients defined according
to clinical severity. Patients who have a good clinical status at baseline should score well in the
questionnaire, and patients who have a poor clinical status at baseline should score poorly
Responsiveness refers to the ability of a measure to reflect underlying change. Preliminary responsiveness
of the EAPIQ was assessed by comparing EAPIQ scores in those patients who report a change in their
health status over the two-week period. Patients who were assessed at baseline and two weeks later
were stratified by their report of worsening, no change and improvement in their 'overall health', 'all
allergies', and 'eye allergy' symptoms, over the 7 to 10 days
Item discriminant validity
Internal consistency reliability
Test-retest reliability
Floor and ceiling effects
Scale-scale correlations
Concurrent validity
Known-group validity
Clinical validity
Responsiveness
allergy related questions derived from the mini Rhinoconjunctivitis QOL Questionnaire (mini RQLQ, Juniper et
al.2000). Its structure, format, and layout was patterned
after questions from the Ocular Surface Disease Index
(OSDI, Walt et al.). The EAPIQ was presented to four
patient focus groups (n = 10 in each group) in 2001 in UK,
France, Italy and Sweden where language specific questionnaires (controlled by forward-backward translations)
were generated for non- English groups. Patients were
asked to comment on layout, structure, and clarity of
questions. Based on these focus groups, the EAPIQ was
restructured and questions were rephrased to be more
patient friendly and concise. Further validation of the
EAPIQ was conducted using the revised questionnaire at
two allergy clinics in the US and Canada (146 patients).
Of the 49 original items in the questionnaire, the 43 items
assessing symptoms (1–12), the impact of symptoms on
HRQoL (items 18–31) and treatment satisfaction (items
32–34) were included in the item reduction and psychometric validation analyses. Six items assessing healthcare
resource utilisation (item 13), work status (items 14 and
15), work productivity (items 16 and 17), and activity
limitations (item 35) were not assessed in the analyses
described because they require categorical and non-Likert
type responses. Scores for the EAPIQ scales are transformed to give a minimum score of 0 and a maximum
score of 100. Higher scores indicate a greater impact on
health due to worse symptoms.
Mini Rhinoconjunctivitis Quality of Life Questionnaire (miniRQLQ)
A 14-item self-administered questionnaire developed by
Elizabeth Juniper (MCSP, MSc) to measure the problems
that adults with rhinoconjunctivitis experience in their
day-to-day lives [6]. The miniRQLQ has five domains:
activity limitations, practical problems, nose symptoms,
eye symptoms and non-nose/eye symptoms.
Health Utilities Index (HUI2/3)
A health status and preference-based health-related quality of life measure suitable for use in clinical and population studies [7]. This 17 item self-administered
questionnaire consists of seven attributes: sensation
(vision, hearing, speech), mobility, emotion, cognition,
self-care, pain, and fertility. The fertility dimension was
excluded.
Page 3 of 11
(page number not for citation purposes)
Health and Quality of Life Outcomes 2005, 3:67
http://www.hqlo.com/content/3/1/67
Table 2: Demographic and clinical characteristics
Characteristic
Gender n (%)
Male
Female
Missing data
Age
Mean
Standard deviation
Range
Missing data
Ethnicity n (%)
Caucasian
African-American
Hispanic/Spanish American
Asian/Oriental/Pacific is.
Other
Missing data
Highest level of education n (%)
High school or less
High school diploma
Some college
College degree
Graduate/postgraduate
Other
Missing Data
Current work status n (%)
Working (FT/PT)
Retired – ill health
Retired – age
Never in paid employment
Unemployed/searching
Other
Missing Data
Domestic situation n (%)
Living alone
Living with husband/partner
Living with children
Living with family/friends
Other
Missing Data
Patient perceived severity of ocular allergy n (%)
I don't have eye allergy symptoms
Very mild
Mild
Moderate
Severe
Very Severe
Missing data
Currently taking dry eye medication n (%)
Yes
No
Missing data
n (%) or
mean
34 (23.29)
99 (67.81)
13 (8.90)
41.4
13.3
18.0–76.0
1
114 (81.43)
2 (1.43)
10 (7.14)
6 (4.29)
8 (5.71)
6 (4.11)
5 (3.62)
22 (15.94)
0 (0.00)
32 (23.19)
47 (34.06)
32 (23.19)
8 (5.48)
102 (71.33)
4 (2.80)
6 (4.20)
2 (1.40)
12 (8.39)
17 (11.89)
3 (2.05)
15 (14.56)
51 (49.51)
9 (8.74)
25 (24.27)
3 (2.91)
43 (29.45)
26 (17.81)
10 (6.85)
34 (23.29)
42 (28.77)
26 (17.82)
7 (4.79)
1 (0.68)
93 (63.40)
52 (35.62)
1 (0.68)
Health Status Change Questionnaire-Short Form
Administered at follow up, this questionnaire use six
questions to assess the extent of any health change in the
patient 7–10 days after the baseline assessment.
Responses were used to categorise patients' health as 'better', 'stable', or 'worse' in order to assess the responsiveness of the EAPIQ.
Analyses
Exploratory Factor Analysis (principal components analysis) with the number of factors left free was performed to
categorise each item to its respective domains. The methodology used thereafter utilised the information gained
from the factor analysis. The number of factors selected
was determined by the number of factors that provided
more than a 0.5 step in eigen value, ± 2 factors. Consideration was also made of the number of factors with eigen
values > 1.0. Items were considered for deletion if they
loaded on two or more factors, or had a correlation of less
than 0.40 with their own factor, or had a high (> 0.70)
floor or ceiling effect (based on item-descriptive statistics). However, if items were found to have substantial
face or content validity they may still be retained, regardless of the factor analysis results.
The EAPIQ was then assessed for the following psychometric properties: item convergent validity [8,9], item discriminant validity [10], internal consistency reliability
[11,12], test retest reliability [13], floor and ceiling effects,
scale-scale correlations, concurrent validity [14], knowngroup validity, clinical validity and responsiveness [14],
all defined in Table 1.
Known-group validity was assessed by comparing EAPIQ
scale scores between patients grouped according to their
self-rating of ocular allergy severity. These patient-rated
severity subgroups were compared using analysis of variance (ANOVA) on baseline data. It was hypothesised that
patients in more severe groups would have worse (higher)
EAPIQ scores, with the exception of the Treatment Satisfaction Scale.
Clinical validity was assessed by comparing EAPIQ scores
according to the clinician report of ocular allergy severity.
Severity was assessed using a single item measure that asks
clinicians to rate the patient's ocular allergy as non-symptomatic, mild, moderate, or severe. Scores for non-symptomatic, mild, moderate and severe groups were expected
to differ significantly from one another when compared
using the Analysis of Variance (ANOVA) test.
In a preliminary analysis of responsiveness, changes in
EAPIQ scores between baseline (week 0) and follow up
(7–10 days after baseline) were compared among groups
of patients who rated themselves as 'better', 'stable' or
'worsened' in terms of 'eye allergies', 'all allergies', and
'overall health' (as assessed using the Health Change
Questionnaire). As a disease specific measure of allergy
symptoms and wellbeing, EAPIQ scores were expected to
Page 4 of 11
(page number not for citation purposes)
Health and Quality of Life Outcomes 2005, 3:67
http://www.hqlo.com/content/3/1/67
Table 3: Final rotated factor pattern, Oblimin rotation method (Standardized Regression Coefficients).
22
26
25
24
21
20
18
19
29
30
28
27
3
2
1
5
4
32
34
33
Troubled with concentrating on daily tasks
Troubled by feeling irritable
Troubled by feeling frustrated/angry
Troubled by feeling tired/fatigued
Troubled with sleeping
Troubled with going outdoors
Troubled with reading
Troubled with driving
Troubled by feeling less attractive
Troubled by feeling uncomfortable in social settings
Troubled by feeling helpless
Troubled by feeling embarrassed
Red eyes
Water eyes
Swollen / puffy
Dry eyes
Itchy / burning eyes
Satisfaction with eye drops
Satisfaction with comfort of eye drops
Satisfaction with how quickly eye drops improved
Factor 1: Daily
Life Impact
Factor 2:
Psychosocial
Impact
Factor 3:
Symptoms
Factor 4:
Treatment
Satisfaction
0.89986
0.82799
0.62794
0.61900
0.58228
0.55971
0.53845
0.50325
-0.16437
0.15673
0.19658
0.00565
-0.09104
0.10791
0.01604
0.49205
0.46646
0.01473
0.00802
0.00569
-0.12534
0.27741
0.45009
0.01189
0.19613
0.17176
-0.07626
-0.03648
0.82591
0.80984
0.70135
0.69426
0.14292
0.27184
0.36873
-0.24760
0.10921
-0.00548
0.01457
0.04313
0.01571
-0.19979
-0.08244
0.22953
0.06456
0.19318
0.47037
0.45243
0.26851
-0.00459
-0.08085
0.22569
0.80942
0.56104
0.54369
0.51892
0.45380
-0.02048
-0.02372
-0.02938
0.13486
-0.15545
0.04161
0.01391
-0.05398
0.08847
0.09245
0.05192
0.06665
-0.12471
0.12504
0.12197
0.08124
-0.13643
-0.10554
-0.12212
0.00162
0.93682
0.93502
0.90542
be most sensitive to changes in 'eye allergies', and least
sensitive to changes in 'overall health'.
Changes in EAPIQ scores were defined as small, moderate, or large using effect sizes (ES), as defined by Kazis
[15]. Kazis proposed that an effect size between 0.20 and
0.49 are considered small, 0.50 to 0.79 are moderate, and
0.80 or above are large. It was hypothesised that those participants who reported an improved or worsened health
status over the two weeks would show corresponding
changes in EAPIQ scores, and those who reported an
unchanged health status would have no significant
change in their EAPIQ scores.
Statistical Analysis Software (SAS Institute Inc., Cary, NC)
was used in the factor analysis assessment, clinical and
known-group validity, and responsiveness over time.
Multi-trait Analysis Program-Revised (MAP-R) [16] software was used for the assessment of psychometrics (internal consistency reliability, item convergent/divergent
validity, floor/ceiling effects, scale/scale correlations). A
significance level of 0.05 was used for all tests unless otherwise stated.
Results
One hundred and forty six patients were recruited. Demographic and clinical characteristics for the patient population at baseline are presented in Table 2.
Construct validity
Fourteen items in the EAPIQ asked for the percentage of
time the patients were troubled while carrying out daily
activities. Responses for these items were often missing or
were inconsistent with responses for corresponding 'level
of bother' items. Consequently, the 14 frequency of
bother items (the second part of questions 18 to 31) were
deleted. Principal Components Analysis (PCA) was then
conducted on the remaining items using Varimax, Promax, and Oblimin rotation methods. Items 11 and 12
('Please rate to what extent you usually suffer from eye
allergy symptoms in relation to OVERALL allergy symptoms' and 'How many days in the past week have you
been free from allergy symptoms', respectively) were
deleted because they did not load on any of the factors.
In addition, items 23 'Trouble with putting on/wearing
make-up' and 31 'Troubled by feeling uncomfortable in
business settings' were excluded from further analyses
because of the high frequency of missing data for these
items. The high frequency of missing data for these items
is likely due to a large number of patients (for example,
men) who do not wear makeup or who do not work. As
these two items provided important information about
patients for whom there is relevance, the items have been
retained as single items instead of being part of any scale
scores.
The relative merits of assessing symptom-bother in a scale
separate from symptom-frequency were assessed. Each of
the symptom-bother items was highly correlated to its
Page 5 of 11
(page number not for citation purposes)
Health and Quality of Life Outcomes 2005, 3:67
http://www.hqlo.com/content/3/1/67
Table 4: Results of tests of item convergent validity, item discriminant validity, reliability, and floor and ceiling effects for the EAPIQ
(total sample)
Item-level
EAPIQ scale
No. of Items
Symptomsc
Daily Life Impactc
Psychosocial Impactc
Treatment Satisfactiond
5
6
6
3
Scale-level
Reliability
Convergent
validitya
Scale-level
Discriminant
validityb
Internal
consistency
Testretest
Floor
effects
Ceiling
effects
Range of
correlations
Success rate
(%)
Success rate
(%)
Cronbach's
alpha
ICC
%
%
0.53–0.77
0.57–0.78
0.58–0.75
0.84–0.86
100
100
100
100
90
83.3
91.7
100
0.84
0.88
0.88
0.93
0.75
0.84
0.85
0.72
11.3
15.5
28.2
1.7
0.7
0.0
0.0
0.0
of item-scale correlations ≥ 0.40.
of item-scale correlations (adjusted for overlap) higher with the item's own scale than with any other EAPIQ scale
c Sample size of 142 patients who completed more than half of the items in the Daily Life Impact, Psychosocial Impact and Symptoms scales.
d Sample size of 119 patients who completed more than half of the items in the Daily Life Impact, Psychosocial Impact and Symptoms and
Satisfaction scales.
a Percentage
b Percentage
corresponding symptom-frequency item (range: r = 0.85–
0.90), suggesting redundancy. Furthermore, when MAP-R
analysis was performed with the symptom-frequency and
symptom-bother items as two separate scales, the two
scales correlated very highly (r = 0.90) with each other,
again suggesting redundancy. Known-group validity testing suggested the superior discriminative ability of the
symptom-frequency scale (F = 44.63 vs. 39.63). However,
when symptom-bother and -frequency items were
summed, discriminative validity was superior for the
summed measure (F = 45.29). As a result, symptombother and symptom-frequency items were summed in
the scoring, reducing 10 items to five in the final factor
analysis and psychometric analyses.
To summarise, 16 items were dropped from the questionnaire (items 12, 13, and the second part of questions 18–
31), two items were excluded from further analyses but
retained as single item measures (items 23 and 31), and
five symptom-frequency items (items 1–5)_were combined with five symptom-bother items (items 1–6) in the
scoring. Thus 20 items were included in the final factor
analysis. The final factor analysis resulted in four domains
being established: Daily Life Impact (eight items), Psychosocial Impact (four items), Symptoms (five items) and
Treatment Satisfaction (three items). Standardised regression coefficients are presented in Table 3. There were five
items that loaded on more than one factor. These items
were assigned to scales based on a qualitative assessment
of their content (face validity).
45
40
E
A
P
I
Q
35
30
25
20
S
C 15
O
10
R
E* 5
Fem ale
(97)
Male
(98)
(88)
(24)
(98)
(33)
(33)
(33)
0
Sym ptom s**
Daily Life Im pact**
Psychosocial Im pact** Treatm ent Satisfaction
E APIQ scale
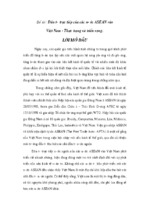
Figure scale
EAPIQ
1 scores at baseline by gender
EAPIQ scale scores at baseline by gender. *Mean EAPIQ scores with 95% Confidence Interval (n) **Overall ANOVA
results found statistically significant differences between groups (P < 0.01)
Page 6 of 11
(page number not for citation purposes)
Health and Quality of Life Outcomes 2005, 3:67
http://www.hqlo.com/content/3/1/67
EAPIQ scale score*
50
40
30
Not taking
medication (n=50)
20
Taking medication
(n=93***)
10
0
Symptoms**
Daily Life Impact**
Psychosocial Impact**
EAPIQ scale
Figure
Comparison
egy
symptoms
2 of EAPIQ scores at baseline between patients taking medication and those not taking medication for their eye allComparison of EAPIQ scores at baseline between patients taking medication and those not taking medication
for their eye allegy symptoms. *Mean EAPIQ scores with 95% Confidence Interval **Overall ANOVA results found statistically significant differences between groups (P < 0.01) ***Except for the Symptoms scale, for which n = 92
Results of tests of item convergent validity, item discriminant validity, reliability, and floor and ceiling effects are
presented in Table 4. All items met the criterion for item
convergent validity (item-scale correlations of ≥ 0.40),
and 90.7% of item-scale correlations (adjusted for overlap) were higher with the item's own scale than with any
other EAPIQ scale (criterion for item discriminant validity). Only three items (items 5 'Dry eyes', 24 'Troubled by
feeling tired/fatigued', and 26 'Troubled by feeling irritable') correlated slightly higher with a scale other than their
own, as compared to the correlation with their own scale.
All scales demonstrated excellent internal consistency reliability, with alpha coefficients ranging from 0.84 to 0.93.
In addition, all scales surpassed the 0.70 criterion for testretest reliability [ICC coefficients ranged from 0.72 to
0.85]. These results demonstrate satisfactory reliability for
the EAPIQ multi-item scales.
There were no significant ceiling effects (percentage scoring at ceiling ranged from 0% to 0.7%) for any of the
EAPIQ scales when assessed for the total cross sectional
sample. When floor effects were assessed in the total cross
sectional sample there were significant floor effects (>
20%) for the Psychosocial Impact scale only (28.2% scoring at floor). Patients with 'no eye allergy symptoms', are
expected to score at floor. When these patients were
excluded, there were no significant floor effects (2.7% of
scoring at floor for the Symptoms scale and 17.3% of scoring at floor for the Psychosocial Impact scale).
Concurrent validity
EAPIQ Symptoms, Daily Life Impact, and Psychosocial
Impact scores all correlated significantly with the miniRQLQ scores (P < 0.0001 for all). The correlations were
moderate, ranging from r = 0.34 to r = 0.85. There was a
low, statistically significant correlation between EAPIQ
Treatment Satisfaction scores and miniRQLQ Eye Symptoms scores (r = 0.24, P = 0.0090). The EAPIQ Treatment
Satisfaction Scale did not correlate significantly with any
of the other miniRQLQ scales.
Correlations between the EAPIQ scales and the items of
the HUI2/3 were low (0.20
- Xem thêm -