Mô tả:
Chapter 8
IIR Filter Design
1. Problem P 8.1
Analog Butterworth lowpass filter design: Ω
M ATLAB Script:
111
p = 30
rad/s, R
p=1
dB, Ωs = 40 rad/s, As = 30 dB.
112
S OLUTIONS M ANUAL
FOR
DSP
USING
M ATLAB
A PRIL 98
The system function is given by
Ha (s) = 2:8199
1022
1122 s + 57:338s + 984:84 s + 50:777s + 984:84
11
2 + 41:997s + 984:842 + 31:382s + 984:84ss
11
s2 + 19:395s + 984:84s2 + 6:5606s + 984:84
1
s2 + 61:393s + 984:84
1
s + 31:382
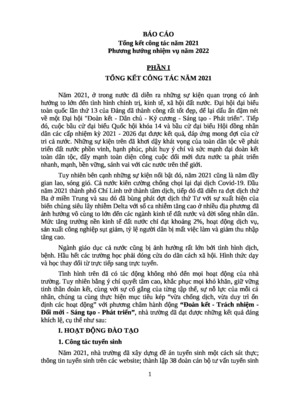
The filter design plots are given in Figure 8.1.
2. Problem P 8.2
Analog Elliptic lowpass filter design: Ω p = 10 rad/s, R
M ATLAB Script:
p=1
dB, Ωs = 15 rad/s, As = 40 dB.
A PRIL 98
S OLUTIONS M ANUAL
FOR
DSP
USING
M ATLAB
113
Analog Butterworth Lowpass Filter Design Plots in P 8.1
Magnitude Response
0
1
0.89
Magnitude
30
Decibels
Log−Magnitude Response
0
0
30 40
Analog frequency in rad/sec
100
100
0
30 40
Analog frequency in rad/sec
100
Phase Response
0
0.1
Impulse Response
Phase in pi units
0.05
−3.47
−4.89
ha(t)
0
0
30 40
Analog frequency in rad/sec
100
−0.05
0
0.5
1
t (sec)
1.5
2
Figure 8.1: Analog Butterworth Lowpass Filter Plots in Problem P 8.1
114
S OLUTIONS M ANUAL
FOR
DSP
USING
M ATLAB
A PRIL 98
The system function is given by
Ha (s) =
46978s4 + 220:07s2 + 2298:5
s5 + 9:23s4 + 184:71s3 + 1129:2s2 + 7881:3s + 22985
:
The filter design plots are given in Figure 8.2.
Analog Elliptic Lowpass Filter Design Plots in P 8.2
Magnitude Response
1
0.89
log−Magnitude in dB
Magnitude
0
Log−Magnitude Response
40
0
0
1015
Analog frequency in rad/sec
30
100
0
1015
Analog frequency in rad/sec
30
Phase Response
0
3
2
ha(t)
−1.26
−1.64
1
0
−1
−2
Impulse Response
Phase in pi units
0
1015
Analog frequency in rad/sec
30
0
2
4
t (sec)
6
8
10
Figure 8.2: Analog Elliptic Lowpass Filter Design Plots in P 8.2
3. Problem P 8.3
A PRIL 98
S OLUTIONS M ANUAL
FOR
DSP
USING
M ATLAB
115
The filter passband must include the 100 Hz component while the stopband must include the 130 Hz component. To
obtain a minimum-order filter, the transition band must be as large as possible. This means that the passaband cutoff must
be at 100 Hz while the stopband cutoff must be at 130 Hz. Hence the analog Chebyshev-I lowpass filter specifications
are: Ω p = 2π (100) rad/s, R p = 2 dB, Ωs = 2π (130) rad/s, As = 50 dB.
M ATLAB Script:
116
S OLUTIONS M ANUAL
FOR
DSP
USING
M ATLAB
A PRIL 98
The system function is given by
Ha (s) = 7:7954 1022
1
1
s2 + 142:45s + 51926
s2 + 75:794s + 301830
The magnitude response plots are given in Figure 8.3.
1
s2 + 116:12s + 168860
11
2 + 26:323s + 388620ss + 75:794
Analog Chebyshev−I Lowpass Filter Design Plots in P 8.3
Magnitude Response
1
0.79
Magnitude
0
0
100130
Analog frequency in Hz
200
Log−Magnitude Response
0
Decibels
50
100
0
100130
Analog frequency in Hz
200
Figure 8.3: Analog Chebyshev-I Lowpass Filter Plots in Problem P 8.3
4. Problem P 8.4
Analog Chebyshev-II lowpass filter design: Ω p = 2π (250) rad/s, R p = 0:5 dB, Ωs = 2π (300) rad/s, As = 45 dB.
M ATLAB Script:
A PRIL 98
S OLUTIONS M ANUAL
FOR
DSP
USING
M ATLAB
117
118
S OLUTIONS M ANUAL
FOR
DSP
USING
M ATLAB
A PRIL 98
The filter design plots are given in Figure 8.4.
Digital Butterworth Filter Design Plots in P 8.7
Log−Magnitude Response
0
Decibel
50
0
0.4
Frequency in Hz
0.6
1
Impulse Response
0.1
ha(t)
0
−0.1
0
10
20
30
40
5060
time in seconds
70
80
90
100
Figure 8.4: Analog Chebyshev-II Lowpass Filter Plots in Problem P 8.4
5. Problem P 8.5
M ATLAB function afd.
6. Problem P 8.6
A PRIL 98
S OLUTIONS M ANUAL
FOR
DSP
USING
M ATLAB
119
Digital Chebyshev-1 Lowpass Filter Design using Impulse Invariance. M ATLAB script:
(a) Part (a): T
= 1.
M ATLAB script:
The filter design plots are shown in Figure 8.5.
(b) Part (b): T
= 1=8000.
M ATLAB script:
120
S OLUTIONS M ANUAL
FOR
DSP
USING
M ATLAB
A PRIL 98
Filter Design Plots in P 8.6a
Log−Magnitude Response
0
Decibel
40
60
0
1500
2000
Frequency in Hz
4000
Impulse Response
0.3
0.2
0.1
0
−0.1
−0.2
h(n)
0
10
20
30
40
50
n
60
70
80
90
100
Figure 8.5: Impulse Invariance Design Method with T
=1
in Problem P 8.6a
The filter design plots are shown in Figure 8.6.
(c) Comparison: The designed system function as well as the impulse response in part 6b are similar to those in part 6a
except for an overall gain due to Fs = 1=T = 8000. This problem can be avoided if in the impulse invariance design
method we set
h (n) = T ha (nT )
7. Problem P 8.7
Digital Butterworth Lowpass Filter Design using Impulse Invariance. MATLAB script:
A PRIL 98
S OLUTIONS M ANUAL
FOR
DSP
USING
M ATLAB
121
Filter Design Plots in P 8.6b
Log−Magnitude Response
0
Decibel
40
60
0
15002000
Frequency in Hz
Impulse Response
4000
3000
2000
1000
0
−1000
−2000
h(n)
0
10
20
30
40
50
n
60
70
80
90
100
Figure 8.6: Impulse Invariance Design Method with T
= 1=8000 in
Problem P 8.6b
The filter design plots are shown in Figure 8.7.
Comparison: From Figure 8.7 we observe that the impulse response h (n) of the digital filter is a sampled version of the
impulse response ha (t ) of the analog proptotype filter as expected.
122
S OLUTIONS M ANUAL
FOR
DSP
USING
M ATLAB
A PRIL 98
Digital Butterworth Filter Design Plots in P 8.7
Log−Magnitude Response
0
Decibel
50
0
0.4
Frequency in Hz
0.6
1
Impulse Response
0.1
ha(t)
0
−0.1
0
10
20
30
40
5060
time in seconds
70
80
90
100
Figure 8.7: Impulse Invariance Design Method with T
=2
in Problem P 8.7
8. M ATLAB function dl
A PRIL 98
S OLUTIONS M ANUAL
FOR
DSP
USING
M ATLAB
123
M ATLAB verification using Problem P8.7:
124
S OLUTIONS M ANUAL
FOR
DSP
USING
M ATLAB
A PRIL 98
The filter design plots are given in Figure 8.8.
Digital Butterworth Filter Design Plots in P 8.8
Log−Magnitude Response
0
Decibel
50
0
0.40.6
Frequency in pi units
1
Magnitude Response
0.5
|H|
0.0
0
0.40.6
Frequency in pi units
1
Figure 8.8: Digital filter design plots in Problem P8.8.
9. Problem P 8.11
Digital Butterworth Lowpass Filter Design using Bilinear transformation. M ATLAB script:
(a) Part(a): T
= 2.
M ATLAB script:
A PRIL 98
S OLUTIONS M ANUAL
FOR
DSP
USING
M ATLAB
125
The filter design plots are shown in Figure 8.9.
Comparison: If we compare filter orders from two methods then bilinear transformation gives the lower order than
the impulse invariance method. This implies that the bilinear transformation design method is a better one in all
aspects. If we compare the impulse responses then we observe from Figure 8.9 that the digital impulse response is
not a sampled version of the analog impulse response as was the case in Figure 8.7.
(b) Part (b): Use of the function.
butt
M ATLAB script:
126
S OLUTIONS M ANUAL
FOR
DSP
USING
M ATLAB
A PRIL 98
Digital Butterworth Filter Design Plots in P 8.11a
Log−Magnitude Response
0
Decibel
50
0
0.4
Frequency in Hz
0.6
1
Impulse Response
0.2
ha(t)
0
−0.2
0
10
20
30
40
5060
time in seconds
70
80
90
100
Figure 8.9: Bilinear Transformation Design Method with T
=2
in Problem P 8.11a
The filter design plots are shown in Figure 8.10.
Comparison: If we compare the plots of filter responses in part 9a with those in part 9b, then we observe that the
butt
function
satisfies
r stopband
e
specifications exactly at s . Otherwise the both designs are essentially similar.
10. Problem P 8.13
Digital Chebyshev-1 Lowpass Filter Design using Bilinear transformation. M ATLAB script:
A PRIL 98
S OLUTIONS M ANUAL
FOR
DSP
USING
M ATLAB
127
Digital Butterworth Filter Design Plots in P 8.11b
Log−Magnitude Response
0
Decibel
50
0
0.4
Frequency in Hz
0.6
1
Impulse Response
0.2
h(n)
0
−0.2
0
5
10
15
20
25
n
30
35
40
45
50
Figure 8.10: Butterworth filter design using the function
butt
in Problem P 8.11b
= 1.
(a) Part(a): T
M ATLAB script:
(b) Part(b): T
= 1=8000.
The filter design plots are shown in Figure 8.11.
M ATLAB script:
128
S OLUTIONS M ANUAL
FOR
DSP
USING
M ATLAB
A PRIL 98
Filter Design Plots in P 8.13a
Log−Magnitude Response
0
Decibel
40
60
0
1500
2000
Frequency in Hz
4000
Impulse Response
0.3
0.2
0.1
0
−0.1
−0.2
h(n)
0
10
20
30
40
50
n
60
70
80
90
100
Figure 8.11: Bilinear Transformation Design Method with T
=1
in Problem P 8.13a
The filter design plots are shown in Figure 8.12.
(c) Comparison: If we compare the designed system function as well as the plots of system responses in part 10a and
in part 10a, then we observe that these are exactly same. If we compare the impulse invariance design in Problem
6 with this one then we note that the order of the impulse invariance designed filter is one higher. This implies that
the bilinear transformation design method is a better one in all aspects.
11. Digital lowpass filter design using elliptic prototype.
M ATLAB script using the function:
bi
A PRIL 98
S OLUTIONS M ANUAL
FOR
DSP
USING
M ATLAB
129
Filter Design Plots in P 8.13b
Log−Magnitude Response
0
Decibel
40
60
0
1500
2000
Frequency in Hz
4000
Impulse Response
0.3
0.2
0.1
0
−0.1
−0.2
h(n)
0
10
20
30
40
50
n
60
70
80
90
100
Figure 8.12: Bilinear Transformation Design Method with T
= 1=8000 in
Problem P 8.13b
130
S OLUTIONS M ANUAL
FOR
DSP
USING
M ATLAB
A PRIL 98
The filter design plots are shown in Figure 8.13.
Digital Elliptic Filter Design Plots in P 8.14a
Log−Magnitude Response
0
Decibel
60
80
0
0.4
Frequency in Hz
0.6
1
Impulse Response
0.2
ha(t)
0
−0.2
0
10
20
30
40
5060
time in seconds
70
80
90
100
Figure 8.13: Digital elliptic lowpass filter design using the bilinear function in Problem P8.14a.
M ATLAB script using the function:
elli
- Xem thêm -