CHINESE GEOGRAPHICAL SCIENCE
Volume 13, Number 4, pp. 334-339, 2003
Science Press, Beijing, China
APPLICATION OF SWAT MODEL IN THE UPSTREAM
WATERSHED OF THE LUOHE RIVER
ZHANG Xue-song, HAO Fang-hua, CHENG Hong-guang, LI Dao-feng
(State Key Laboratory of Water Environment Simulation, Institute of Environmental Sciences,
Beijing Normal University, Beijing 100875, P. R. China)
ABSTRACT: In the Huanghe (Yellow) River basin, soil erosion is a serious problem, while runoff and sediment
yield simulation has not been extensively studied on the basis of GIS (Geographic Information System) and distributed hydrological model. GIS-based SWAT (Soil and Water Assessment Tool) model was used to simulate runoff and
sediment in the Huanghe River basin. The objective of this paper is to examine the applicability of SWAT model in
a large river basin with high sediment runoff moduius, which could reach 770t/(krn2-a). A two-stage "Brute Force"
optimization procedure was used to calibrate the parameters with the observed monthly flow and sediment data from
1992 to 1997, and with input parameters set during the calibration process without any change the model was validated with 1998-1999's observed data. Coefficient of examination (R2) and Nash-Suttcliffe simulation efficiency (E,s)
were used to evaluate model prediction. The evaluation coefficients for simulated flow and sediment, and observed
flow and sediment were all above 0.7, which shows that SWAT model could be a useful tool for water resources and
soil conservation planning in the Huanghe River basin.
KEY WORDS: Luohe River; watershed; SWAT model; sediment; flow
CLC number: S 1 5 7
Document code: A
Article ID: 1002-0063(2003)04-0334-06
1 INTRODUCTION
do some researches on flow and sediment modeling.
In the Huanghe (Yellow) River basin, soil erosion is a
serious problem, while runoff and sediment yield simulation has not been extensively studied on the basis
o f GIS (Geographic Information System) and distributed hydrological model. In this study, the Lushi
watershed, which is located at the upstream o f the
Lushi Hydrological Station in the Luohe River--the
biggest" tributary o f the Huanghe River and downstream o f Xiaolangdi Dam, is selected as the study
area. The level o f soil erosion in Lushi watershed is
moderate in the Huanghe River basin: the rate o f soil
erosion is about 2000-4000t/(km2-a) and sediment
runoff modulus reaches 770t/(km2.a) (GUO and
ZHENG, 1995).
SWAT (Soil and Water Assessment Tool) has been
extensively validated across the U.S. for stream flow
and sediment yields (ARNOLD and ALLEN, 1999),
and here the GIS-based SWAT model was selected to
2 MATERIALS AND METHODS
2.1 SWAT Model Description
SWAT is a hydrologic/water quality model developed
by United States Department o f Agriculture-Agricultural Research Service (USDA-ARS) (ARNOLD et
d . , 1998). It is a continuous time model that operates
on a daily time step. The objective o f the model is to
predict the impact o f management on water, sediment,
and agricultural chemicals in large ungaged basins. To
satisfy the objective, this model is physically based
(calibration is possible on ungaged basins); uses readily available inputs; is computationally efficient to operate on large basins in a reasonable time; and is continuous in time and capable o f simulating in long period for computing the effects o f management changes.
The sub-basin/sub-watershed components o f SWAT
Received date: 2003-04-28
Foundation item: Under the auspices of the Key Program of National Natural Science Foundation of China (No.50239010) and Ph.
D. foundation from Ministry of Education (No.20010027013)
Biography: ZHANG Xue-song (1979-), male, a native of Liaocheng City, Shandong Province, Master candidate of the Institute of
Environmental Sciences, Beijing Normal University, specialized in water resources and environmental modeling
Application of SWAT Model in the Upstream Watershed of the Luohe River
SPCON is the concentration in g/m 3 at a velocity of
lm/s; V is flow velocity in m/s; and SPEXP is a
can be placed into eight major components: hydrology, weather, erosion/sedimentation, soil temperature,
plant growth, nutrients, pesticides, and land management. SWAT uses a modified version of the SCSCN
(Soil Conversation Service Curve Number)method
for predicting runoff (USDA-SCS, 1972). Erosion and
sediment yield are estimated for each sub-basin with
the Modified Universal Soil Loss Equation (MUSLE)
(WILLIAMS, 1975). The channel sediment routing equation uses a modification of BAGNOLD's sediment
transport equation (BAGNOLD, 1977) that estimates
the transport concentration capacity as a function of
velocity.
CY,~:SPCONx Vsm~e
constant in BAGNOLD's equation. The sediment deposit and re-suspension can be calculated according
to the sediment load entering the channel.
2.2 Watershed Description
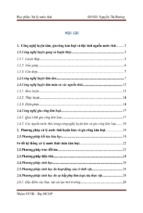
SWAT model was applied to the 4623km 2 of the
upstream watershed of the Luohe River (Fig. 1). This
area is mainly mountainous,
and the Qinling
Mountains is located to the south of the watershed,
Huashan Mountain and Yao Mountain to the north.
The degree of slope in this area is normally about 30
degree. This area belongs to warm temperate zone,
and precipitation is abundant.
where CY,, is sediment transport concentration in g/m3;
ll0°]00'E
[
I
,
."
110°~4' E
..,¢" " ~
"°~" " "
"~o"
tA
,
.
~
h
~
,
oN
w
I
Mr
~"
-- k ~ 2 h a n g r f i l d i - ~ - - - ~ ~'~ m - ~
~!
~l~himenyu N
- t.uoyuan ."~ff~_
~% . ~ - - . ~ " ~
~ ~ B o y u ~ i
"-,¢ ~ ~
"~
""
"
~_
m
i
..
Manli
2
lz.,-
110°48' E
.1- -,~ol.
...,~,'. t-- s
335
~ Raingauge - I ___ Watershed boundary
Water System t
II0°~I0'E
-
~
"
-
!,
I
'-,
i
..........
31-1Miaot~" '~-.
.~.,..i / ~ - ~ , , ~ iLiugua n
"~ I Hao in h e ;
[1
X
"-"
P g
!
1,
~
IPanhe
Shahejie
"~1! ~ f u t ° n g g ° u ~ l ~
~
~- ipLushi
|'
~
! k. ~_ Jianbei "-'l~.a,
°~
"-
I
~nttyn,a
-" ""-~
~
i (
"~
~
|
t~
Nianzigoukoff'.,.
~'u
lLCruanDo
m
~ "i.... . . . . . ,,..~.@ongxia " ~ 1 ~
i
" "X
I i
:.. ~ t m
i
'
'
"
Zulmyu._.~
m
-¢
110°24'E
110°48'E
Fig. 1 Map of the study area
Land-uses in this watershed are mostly forest and
cropland in the upper portion while cropland and pasture are wide spread in the lower portion. Major soil
series are zonal from the low elevation to the high elevation area, accordingly the soil series change from
Calcic Cinnamon Soils, Typic Cinnamon Soils, Typic
Burozems to Clay Pan Yellow-brown Earths, the percentage of which in total watershed are about 27%,
34%, 38% and 1%, respectively.
2.3 Model Inputs for Lushi Watershed
A Geographic Resource Analysis Support System-Geographic Information System (GRASS-GIS) interface (SRINIVASAN and ARNOLD, 1994) was used
to develop SWAT input files for the watershed (Table
1).
Initially,
the watershed was delineated into
sub-basins by using the digital elevation map. The delineated sub-basin map, land-use and soil map were
overlaid. SWAT simulates different land-uses in each
sub-basin.
Table 1 Data sources for Lushi watershed
Data type
Topography
Scale
1:250000
Data description/properties
Elevation, overland, and channel slopes, lengths
Soil
1:4000000
Soil classifications
Land use
1: 100000
Land-use classifications
Weather
Daily precipitation
Land management
Tillage,
information
ing dates for different crops
planting and harvest-
336
ZHANG Xue-sor~g, HAO Fang-hua, CHENG Hong-guang et ol.
2.4 Evaluation of Model Prediction
Mean, standard deviation, coefficient of determination
(R2), and Nash-Suttcliffe simulation efficiency (E,~)
(NASH and SUTTCLIFFE, 1970) are used to evaluate
model prediction. The R 2 value is an indicator of
strength of relationship between the observed and simulated values. Nash-Suttcliffe simulation efficiency
(Ens) indicates how well the plot of observed versus
simulated value fits the 1:1 line. If the R 2, Ens values
are less than or very close to 0, the model prediction
is considered "unacceptable or poor". If the values
are 1, then the model prediction is "perfect". However
there are no explicit standards specified for assessing
the model prediction using these statistics.
2.5 Model Calibration
The SWAT model was built with state-of-the-earth
components with an attempt to simulate the processes
physically and realistically. Most of the model inputs
are based on readily available information. It is important to understand that SWAT is not a "parametric
model" with a formal optimization procedure (as part
of the calibration process) to fit any data. Instead, a
few important variables that are not well defined physically such as runoff curve number and Universal Soil
Loss Equation's cover and management factor, or C
factor may be adjusted to provide a better fit.
A two-stage "Brute Force" optimization procedure
described by ALLRED and HAAN (1996) was used to
find the optimum parameter values. In the first optimization stage, a rough estimate of the optimum parameter set was obtained by setting a percentage by
which each parameter was to be changed. Eight increments or decrements were performed for each parameter. Curve numbers were always increased or decreased by a whole number. If the optimum values of
parameters were obtained at the upper or lower
boundary of the parameter values, the step sizes of the
parameter values were increased and the same procedure was repeated to insure that the optimum parameter estimates did not fall at the boundary values. Mathematically, the optimum parameter value can be represented as (P~)j, where P, is the average optimum value
of parameter i obtained at step j (j" -- 1, 2, ..., 8). I f j
was equal to t or 8, then the range of the step size
was increased, and the optimization procedure was repeated. The second optimization was conducted in a
similar manner as the first one by further refining the
parameter values. Refinement was accomplished by
using a much narrower range of parameters obtained
from the first optimization. If the optimum parameter
obtained by the first approximation was (Pi)i, then the
range of the parameters in the second optimization
was (Pi)i-I to (Pi)i+l. In the second optimization, a
step size in the form of a fraction for each parameter
was calculated and divided the range of the parameter
into 10 evenly distributed values. Each parameter was
then increased or decreased by this fraction and model
runs were performed.
The set of parameters that
match the observed data best was considered as the final optimum parameter set.
2.5.1 Calibration procedure
There are numerous potential errors that can occur
in the measured input data and data used for calibration, including: 1) spatial variability errors in rainfall,
soils and land-use; 2) errors in measuring flow; 3) errors caused by sampling strategies. WINTER (1981)
suggested error rates in annual estimates of precipitation, stream flow, and evaporation ranged from 2% to
15%, whereas monthly rates could range from 2% to
30%. Errors in sampling strategies can also be significant. WALLING and WEBB (1988) determined that
using continuous turbidity and daily flow data resulted
in errors of 23% to 83% when calculating annual sediment loads. The calibration criteria for this study evolved based on these potential errors shown in literature. Initially, base flow was separated from surface
flow for both observed and simulated stream flows using an automated digital filter technique (NATHAN
and MCMAHON, 1990; ARNOLD and ALLEN,
1999). Calibration parameters for various model outputs were constrained within the ranges shown in
Table 2. Model outputs were calibrated to fall within a
percentage of average measured values and then
monthly regression statistics (R 2 and End) were evaluated. If measured and simulated means met the calibration criteria and monthly R 2 and En~ or did not, then
additional checking was performed to ensure that rainfall variability and plant growing seasons were properly simulated over time. If all parameters were pushed
to the limit of their ranges for a model output (i.e.
flow or sediment) and the calibration criteria were still
not met, then calibration was stopped for that output.
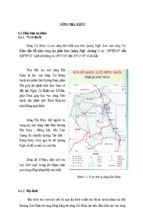
The procedure for calibrating the SWAT model in
flow, sediment is shown in Fig.2 (SANTHI et al.,
2001 ) .
Stream flow was the first output calibrated (Fig. 2).
Surface runoff was calibrated until the difference
between average measured and simulated surface
runoffs was within 15% and monthly R 2>~0.6 and Ens >I
Application of SWATModel in the Upstream Watershedof the LuoheRiver
337
Table 2 Inputsused in model calibration
Variable
Process
Description
CN
REVA PC
ESCO
EPCO
C factor
Flow
Flow
Flow
Flow
Sediment
Curve number
Ground water re-evaporation coefficient
Soil evaporation compensation factor
Plant uptake compensation factor
Cover or management factor
Parameter range
+8
0.00 to
0.00 to
0.00 to
0.003 to
SPCON
SPEXP
Sediment
Sediment
Linear factor for channel sediment routing
Sediment exponential factor for channel sediment routing
0.0001 to 0.01
1.0 to 1.5
Separatesurfacerunoff(SR)and base flow
(BF) for measureddaily flow
[
+
[
I"
....
llf~
Yes {"
[-"'-\
. . . . . g. . . . . . . . dand . . . . . ge
simulatedBF<15%,e~>~O~,
[ Run SWAT
"~N_~.2_~Adjast~EYXPC,
}|
ESCO,ePCO
Yes/
averagemeasuredandaverage "~No [ AdjustCfactor I
V"-~X simu~tedSediment<20%,i~>0.SJ--[ SPCON,SPE'~ [
~'
Calibrationcomplete [
E~: Nash-Suncliffeefficiency
R~:Coefficientof determination
Fig. 2 Calibrationprocedure for flow and
sediment in SWAT model
1.00
1.00
1.00
0.45
Value/change
_+2
0.10
0.20
0.10
Pasture: 0.006
Forest: 0.010
Cropland: 0.20
0.0008
1.0
pensation factor (EPCO) were adjusted from SWAT
initial estimates to match the simulated and observed
flows (Table 2). The simulation was started from
1991 to reduce errors in initial estimates of state variables, such as soil water content and surface residue.
2.5.3 Sediment
The cover, or C factor, of the Universal Soil Loss
Equation was adjusted to match observed and simulated sediment loads (Fig. 2). The C factor was adjusted
(Table 2) to represent the surface better in the range
and pasture lands. Channel sediment routing variables
such as the linear factor for calculating the maximum
amount of sediment re-entrained during channel sediment routing (SPCON) and the exponential factor for
calculating the sediment re-entrained in the channel
sediment routing (SPEXP) were also adjusted (Table
2) during the sediment calibration. These two variables were adjusted to represent the cohesive nature
of the channels in this watershed (ALLEN et al.,
1999).
2.6 Model Validation
0.5. The same criteria were applied to base flow, and
surface runoff was continually rechecked as the base
flow calibration variables also affect surface runoff.
Sediment was calibrated after flow calibration and
continued until the difference between average measured and simulated sediment loads was within 20%.
2.5.2 Flow
SWAT simulation was calibrated (Fig. 2) for the
period from 1992 to 1997. For flow calibration, the
runoff curve numbers (CN) were adjusted within +8
from the tabulated curve numbers (MOCKUS, 1969)
to reflect conservation tillage practices and soil
residue cover conditions of the watershed (Table 2).
Other related model parameters such as re-evaporation
coefficient for ground water [REVAPC represents the
water that moves from the shallow aquifer back to the
soil profile/root zone and plant uptaken from deep
roots (ARNOLD et al., 1993)], soil evaporation compensation factor (ESCO), and plant evaporation com-
In the validation process, the model was operated with
input parameters set during the calibration process
without any change and the results were compared to
the remaining observational data to evaluate the model
prediction. Measurements from January 1998 to December 1999 were used to validate the model for
Lushi Hydrological Station. The same statistical measures were used to assess the model prediction.
3 RESULTS AND DISCUSSION
3.1 Model Calibration
3.1.1 Flow
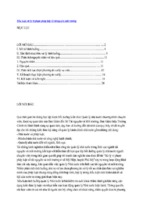
Monthly measured and simulated flows at Lushi
Hydrological Station matched well (Fig. 3a). Means
and standard deviations of the observed and simulated
flows were within a difference of 15 % (Table 3). Fur-
ZHANG Xue-song,
338
HAO Fang-hua, CHENG Hong-guang et ol.
(a) flow in calibration period
II
Observed
-
(b) sediment in calibration period
Simulated
$
150
%
1500
100
~
tooo
o~
~x 50
~
500
0
~
0
l 5 9 131721252933374145495357616569
Observed
---II--Simulated
1 5 9 131721252933374145495357616569
Month (1992-1997)
Month (1992-1997)
(There were 72 months from 1992 to 1997, 1 represents January 1992, 2 February 1992, and so on and so forth.)
Fig. 3 Observedand simulatedmonthlyflow and sedimentloadings during calibrationperiod
ther agreement between observed and simulated flows
is shown by the coefficient of determinations and E,s
greater than 0.8 (Table 3). The estimated proportion
of base flow from the observed flows was 35% by the
filter technique, which was 32 % for the same locations for SWAT simulated flows. These results for
surface runoff and base flow for observed and simulated flows reveal that hydrologic processes in SWAT
are modeled realistically and the concentrations at
flow regime are realistic.
3.1.2 Sediment
The temporal variations of sediment loading at
Lushi Station are represented in Fig. 3b. Means and
standard deviations of observed and simulated sediment were both within a difference of 20% (Table 3).
The values of R 2 and Ens were both 0.70 (Table 3)
which indicates that the simulated sediment is closer
to the observed sediment and this model is able to predict sediment loadings well.
3.2 Model Validation
Table 3 Monthly calibration results at
Lushi Hydrological Station from 1992 to 1997
Variable
Mean
Standard deviation
Flow volume
(m3/s)
Sediment
(x 103 t)
13.15
12.29
24.83
21.23
0.87
0.86
800.5
880.7
2390.6
2080.6
0,70
0.70
Observed
Simulated
Observed
Simulated
Rz
E,s
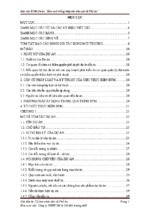
3.2.1 Flow
Observed and simulated flows at Lushi Hydrological Station matched well (Fig. 4a). The model overpredicted the flow in of June, September and October
1998, April, May, and in late 1999, and slightly underpredicted in August, December 1998 (Fig. 4a). The
difference might be due to the spatial variability of
(a) flow in validationperiod
$
Observed
(b) sediment in validation period
--II.--Simulated
200 [
~
°15ot
$
Observed
3
5
+Simulated
2500 F
i 2°°°
15o0
~lOO
1000
I~ 50
0
500
0
1
3
5
7
9
11 13 15 17 19 21 23
Month (1998-1999)
1
7
.........
l--A--__-9 11 13 15 17 19 21 23
Month (1998-1999)
(There were 24 months from 1998 to 1999, 1 represents January 1998, 2 February 1998, and so on and so forth.)
Fig. 4 O b s e r v e d a n d s i m u l a t e d m o n t h l y f l o w a n d s e d i m e n t l o a d i n g s d u r i n g v a l i d a t i o n p e r i o d
precipitation. However, the prediction statistics was
high (Table 4).
Table 4 Monthlyvalidation results at Lushi
Hydrological Station from 1998 to 1999
Variable
Mean
Observed
Simulated
Standard deviation Observed
Simulated
R2
En~
Flow volume (m3/s) Sediment (x 104 t)
15.45
20.73
157.70
134.10
0.84
0.81
320.77
320.30
4320.70
3460.70
0.98
0.94
3.2.2 Sedimer~t
Observed and simulated sediment loading matched
well. However, the model underpredicated the sediment in May and August 1998, and slightly overpredicated the sediment in July 1999 (Fig. 4b). The values
o f R 2 and Ens are both above 0.9, which indicates that
the model is able to predict sediment reasonably. The
high values of R 2 and E,s may be due to that in 1998
the sediment yield was much greater than sediment
yield in 1999. So as the "goodness of fit" of observed
Application of SWAT Model in the Upstream Watershed of the Luohe River
and simulated data in 1998 was good, the results were
agreeable even though in 1999 the data did not match
well. Another reason was that the observed data were
not accurate due to the difficulties to measure sediment.
4 CONCLUSIONS
The basic spatial and attribute database for runoff and
sediment modeling in the study area has been established using the GIS technology. The objective of this
study was to calibrate and validate SWAT model in a
watershed with high sediment loading. Monthly simulated flow, and sediment loadings were compared with
observed values for the calibration and validation periods. The results show that in most instances, simulated flow, and sediment were close to the measured values during the calibration period and validation period. In general, SWAT predictions were acceptable.
And due to its spatial analyst capability, GIS-based
SWAT model could be used as a useful tool for planning and management of water resources systems in a
manner that is environmentally sustainable and socially acceptable.
REFERENCES
ALLEN P M, ARNOLD J G, JAKUBOWSKI E, 1999. Prediction of stream channel erosion potential [J]. Environmental
and Engineering Geoscier~ee, 3:339-351.
ALLRED B, HAAN C T, 1996. Small Watershed Monthly
Hydrologic Modeling System [M]. Users Manual, Stillwater
OK: Oklahoma State University Press.
ARNOLD J G, ALLEN P M, 1999. Automated methods for estirnating base flow and ground water recharge from stream
flow records [J]. Journal of American Water Resources
339
Association, 35(2): 411-424.
ARNOLD J G, ALLEN P M, BERNHARDT G, t993. A comprehensive surface-ground water flow model [J]. Journal of
Hydrology, 33(1): 47-69.
ARNOLD J G, SRINIVASAN R, MUTTIAH R Set al., 1998.
Large area hydrologic modeling and assessment part I: model development [J]. Journal of American Water Resources
Association, 34(1): 73-89.
BAGNOLD R A, 1977. Bedload transport in natural rivers [J].
Water Resources Research, 13(2): 303-312.
GUO Jian-min, ZHENG Jin-liang. 1995. Yearbook of Yiluohe
River [M]. Beijing: China Science and Technology Press.
( in Chinese)
MOCKUS V, 1969. Hydrologic soil-cover complexes [A]. In:
SCS National Engineering Handbook, Section 4, Hydrology[Z]. Washington D C: USDA-Soil Conservation Service.
NASH J E, SUTTCLIFFE J V, 1970. River flow forecasting
through conceptual models, Part I. a discussion of principles
[J]. Journal of Hydrology, 10(3): 282-290.
NATHAN R J, MCMAHON T A, 1990. Evaluation of automated techniques for baseflow and recession analysis[J]. Water
Resources Research, 26(7): 1465-1473.
SANTHI C, ARNOLD J G, WILLIAMS J R et al., 2001. Validation of the SWAT model on large river basin with point
and non-point sources [J]. Journal of the American Water
Resources Association, 37(5): 1169-1188.
SRINIVASAN R, ARNOLD J G, 1994. Integration of
basin-scale water quality model with GIS [J]. Water Resources Bulletin, 30(3): 453-462.
USDA-SCS, 1972. National Engineering Handbook, Hydrology
Section 4, Chap. 4-10[M]. Washington D C: US Dept. of
Agriculture, Soil Conservation Service.
WALLING D E, WEBB B W, 1988. The reliability of rating
curve estimates of suspended sediment yield: some further
comments [A]. In: Sediment Budgets[M]. IAHS Publ. 337350.
WILLIAMS J R, 1975. Sediment routing for agricultural watersheds [J]. Water Resources Bulletin, 11(5): 965-974.
WINTER T C, 1981. Uncertainties in estimating the water balances of lakes [J]. Water Resources Research, 17(11): 825.
- Xem thêm -