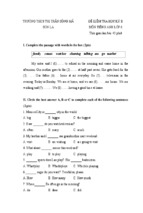
visit the link to get test
Website : https://1001dethi.com/ dt 0909265875 .thầy phúc
SÁCH STARTERS :
Cụ thể : 1 bộ sách Starters 9 cuốn +audio listening
Trọn gói : 50.000Đ.
SÁCH MOVERS :
Cụ thể : 1 bộ sách Movers 9 cuốn + audio listening
Trọn gói : 50.000Đ.
SÁCH FLYERS :
Cụ thể : 1 bộ sách Flyers 9 cuốn +audio listening
Trọn gói : 50.000Đ
SÁCH KET :
Cụ thể : 1 bộ sách KET 10 cuốn +audio listening
Trọn gói : 50.000Đ
SÁCH PET :
Cụ thể : 1 bộ sách PET 8 cuốn +audio listening
Trọn gói : 40.000Đ
SÁCH Longman New Real Toeic (Trọn bộ 3 cuốn RC,LC và Full)
Trọn gói : 30.000Đ
Nguyen Thuy Mi_07.1.e3_k41
*****************************************************************************
TABLE
I. Introduction
1. Definition
A table (table chart) is a set of data elements (values) that is organized using a model of vertical
columns (which are identified by their name) and horizontal rows. (is a set of facts and figures
arranged in columns and rows. A table is a very useful way of organizing numerical
information.)
A table has a specified number of columns,
Name of product
Number of Sales
but can have any number of rows.
A
10
A table with numerous variables can be
B
25
C
50
D
15
broken down into smaller tables that look at
each variable separately.
Using table is a very useful way of organizing numerical information.
Advantages
of table chart
A table helps organize information so it is easier to see patterns and relationships.
If a variable is continuous, the table reveals a lot more information. It may show the range,
interval, and number of readings.
Tables with multiple variables can provide a lot of information. They can be read by selecting
and controlling factors to search for patterns in the data.
2. Types of table chart
Name
1. Simple
table
Visual aid and features
Age table
First name
Last name
Age
Nancy
Davolio
33
Nancy
Klondike
43
Nancy
Obesanjo
23
Justin
Saunders
37
Justin
Timberlake
28
Paulo
Ilustre
11
♪ The following illustrates a simple table with three columns and six rows.
♪ The first row is not counted, because it is only used to display the column names.
Writing portfolio 74
**************************************************************************
Nguyen Thuy Mi_07.1.e3_k41
*****************************************************************************
This is traditionally called a "header row".
2. Multidimensional
table
II, Features of table chart
1, Objective/ Aim of table chart
A table is both a mode of visual communication and a means of arranging data.
The use of tables is pervasive throughout all communication, research and data analysis.
Tables appear in print media, handwritten notes, computer software, architectural
ornamentation, traffic signs and many other places.
As a communication tool, a table allows a form of generalization of information from an
unlimited number of different social or scientific contexts. It provides a familiar way to
convey information that might otherwise not be obvious or readily understood
Using a table to list information according to category is often much clearer than writing out
all the information in paragraph form.
Example
Some data first written up in a paragraph
During the 1995-1996 academic years, a survey of the holdings of university
research libraries and rank was done in the United States and Canada. It was found that
Syracuse University, in New York, had 2,692,147 holdings, and was figured to rank
eighty-first. Harvard University ranked first with 13,369,855 holdings. The University of
Writing portfolio 75
**************************************************************************
Nguyen Thuy Mi_07.1.e3_k41
*****************************************************************************
Connecticut was ranked fiftieth place, and reported 2,626,066 holdings. The
Massachusetts Institute of Technology reported 2,448,647 holdings, and was ranked in
seventy-third place. (Source: Association of Research Libraries)
The table below presents the same information as the paragraph above.
HOLDINGS AND RANK OF UNIVERSITY RESEARCH LIBRARIES IN
THE U.S. AND CANADA--1995-1996.
Institution
Rank
Holdings
Harvard Univ.
1
13,369,855
U. Connecticut
50
2,626,066
Mass. Inst. Tech.
73
2,448,647
Syracuse Univ.
81
2,692,147
2, Organization/ Structure of table chart
Table Title--A table title gives an overview
of the information displayed in the table. The title
is given at the top of the table.
Row/Column Labels--The label of each
row or column indicates what type of information
is contained in that row or column. The table
shown here has 2 columns of information, each
with a label.
Individual Cells--Each cell is defined by its row and column location. In the example above, the
cell outlined is in the fourth row, first column.
Relationship of cells within a row or column--Often we want to determine if there is a trend
within a row or column. Fore example, do the values increase as we move up or down a row or column?
Example
Given the table below, answer the following questions.
Writing portfolio 76
**************************************************************************
Nguyen Thuy Mi_07.1.e3_k41
*****************************************************************************
The Relationship Between
Ticket Prices and Attendance at First Union University
Ticket Prices
Attendance
(dollars)
(thousands)
0
20
5
16
10
12
15
9
20
5
25
0
1. What is the attendance when the ticket price is $15 dollars?
2. What is the relationship between ticket prices and attendance? (In other words, how does
attendance change as ticket prices change?)
3. What is the optimal ticket price? Give a reason for your answer
III. Guideline to table chart description
Outline for description table chart
1 Introductory sentence
Use two standard opening sentences to introduce the table and your report. These opening
sentences should make up the first paragraph.
Sentence one should define what the table is about; that is, the date, location, what
is being described in the graphs etc. For example:
The table shows how people in different age groups spend their leisure time in Someland
over the course of a year.
Notice that the sample opening sentence does not simply copy the words used on the graphic
material. Copied sentences will not be assessed by the examiner and so you waste your time
including them.
Sentence two (and possibly three) might sum up the overall trend. For example:
It can be clearly seen that the amount of leisure time available varies considerably across
the age groups and that people of different age levels have very different ways of
spending their free time.
2. Body paragraph (1-3)
Writing portfolio 77
**************************************************************************
Nguyen Thuy Mi_07.1.e3_k41
*****************************************************************************
When discussing the data presented in the task, identify significant trends and give example that
relate directly to the given information to support your statements. If you're explaining a process
or an object and how it works, you need to group your information so that it follows a definite
logical order.
Remember that the use of verbs expressed in the present passive voice is often
appropriate when giving a description of a process or procedure, for example:
Coffee beans are pulped to remove their easing. They are then soaked in water, rinsed
thoroughly and dried. After the beans are sorted, they are rousted in a kiln and blended.
Next, they are packed and dispatched to shops and supermarkets.
3. Concluding sentence
A simple concluding statement could include any of the following, where relevant:
+ Significant comments.
+ An overall summary of the ideas
+ A potential solution
+ Future implications.
IV. Useful tips and useful languages
1. Useful tips
DON'T copy any part of the question in your answer
Don't repeat yourself or the same ideas
If you are weak at English grammar, try to use short sentences. This allows you to control the
grammar and the meaning of your writing much more easily and contributes to a better
cohesion and coherence mark
Think about the tenses of your verbs.
If you're writing about something that happened in the past, your verbs will need to
be in the past tenses.
If you're describing the future, you will need to use the future tenses.
If it's a habitual action, you'll need the present simple tense and so on.
It is important that you cover all of the information given. However, this does not mean that
you should note every detail. In tables, there is invariably too much information for you to
Writing portfolio 78
**************************************************************************
Nguyen Thuy Mi_07.1.e3_k41
*****************************************************************************
mention each figure. You will therefore need to summarize the table in meaningful segments.
In other words, you will describe the significant trends in your report.
To see the trends in a table, start by finding patterns under the horizontal and vertical
headings
2. Useful languages
2. 1 Use reference structure
When referring to a table, use "reference" structures such as those given below. This will
assist the reader to know where your information comes from, and will effectively lead in
The table+ shows (that/how).../ describes (that/ how)/ illustrates (that/ how)...
According to the/ As (is) shown in the/ As can be seen from the/ It can be seen
from the/ We can see from the table+ that…
It is clear-apparent from the table that…
Be careful not to use these "reference" structures too frequently to avoid unnecessary
repetition.
2.2 Decline and increase
Decline
went down - fell - dropped - declined - decreased steeply
collapsed = suddenly decrease
plummeted/ plunged...=suddenly and quickly decrease
tumbled = to decrease quickly and by a significant amount = to fall
greatly in value in a short time without control.
suffered/ experienced/ saw a steep/ sharp decline/ decrease/ fall.
There was a plunge/ steep fall/ drop/ decline/ decrease in
Increase
sank to a new low/ go into free fall/ sank to a low point
increased/ grew/ went up/ rose rapidly
shot up
soared/ leaped/ climbed to a new peak/ hit a peak/ reach a peak/
reach a high
soared spectacularly more than nine times its value in the previous
year
Fluctuate
enjoyed/ saw a leap/ a steady rise/ a sharp increase
erratic.
Writing portfolio 79
**************************************************************************
Nguyen Thuy Mi_07.1.e3_k41
*****************************************************************************
fluctuated/ moved up and down.
fluctuated sharply/ wildly/ slightly
rose and fell over the period
went through/ experienced a period of erratic behaviors/ erratic
Recover
period/ a period of volatility/ a volatile/ wild fluctuation
recovered, regaining its previous level
regained its previous level
dropped/ fell back to
made a steady recovery
bounced back to
bounced back
Stable
shot up again to
... before stabilizing at.../ settling down to a more stable period
did not change over the period
leveled off
remain stable/ constant
Trend
steady
The trend was definitely/ obviously upward/ downward.
2.3 Making predictions
Occasionally a table showing trends predicts what may happen in future. In that case, you cannot
say that something will happen. Only that it may or could. The modals may, might, or could are
generally too vague and uncertain to be used, however. The most common expressions for
discussing possible future trends are:
+ It is predicted/ forecast/ projected/ expected/ suggested/ likely/ probable that...+ willclause.
+ It is predicted that A will-clause
+ A is predicted to increase/ decrease...
+ An increase/ decrease in A to...by 2020 is expected.
+ The prediction is that A will-clause
+ The prediction for A to increase...
+ By 2020, A will likely/ probably increase to...
Note: It is predicted that + ...might/ may/ could +... is too uncertain, too weak.
Reference List
http://en.wikipedia.org/wiki/Table_%28database%29
Writing portfolio 80
**************************************************************************
Nguyen Thuy Mi_07.1.e3_k41
*****************************************************************************
http://www.ielts-exam.net/index.php?option=com_content&task=view&id=212&Itemid=44
http://olympiavn.org/forum/index.php?topic=30485.0
http://www.khkt.net/chu-de/8133/Discribe-table-or-chart/
http://www.ielts-exam.net/index.php?option=com_content&task=view&id=212&Itemid=44
Writing portfolio 81
**************************************************************************
- Xem thêm -