MINISTRY OF EDUCATION AND TRAINING
UNIVERSITY OF ECONOMICS HOCHIMINH CITY
--------------------------------------------
FULBRIGHT ECONOMICS TEACHING PROGRAMME
HUỲNH THỊ KIỀU OANH
THE AUTOMOBILE INDUSTRY IN VIETNAM AND
THAILAND IN A COMPARATIVE PERSPECTIVE
MASTER’S THESIS ON ECONOMICS
MAJOR: PUBLIC POLICY
CODE: 603114
Supervisor: Jonathan R. Pincus
HOCHIMINH CITY, 2010
i
CERTIFICATION
I certify that the substance of the study has not already been submitted for any degree
and is not being currently submitted for any other degrees.
I certify that to the best of my knowledge any help received in preparing the study
and all sources used have been acknowledged in the study.
The study does not necessarily reflect the views of the Ho Chi Minh City Economics
University or Fulbright Economics Teaching Program.
Huynh Thi Kieu Oanh
ii
ACRONYMS AND ABBREVIATIONS
AFTA
ASEAN Free Trade Agreement
AICO
ASEAN Industrial Cooperation Organization
BBC
Brand-to-Brand Complementation
CEFT
Common Effective Preferential Tariff
CBU
Completely Built Unit
CKD
Completely Knocked Down
IEs
Industrial Estates
IL
Inclusion List
IKD
Incompletely Knocked Down
JVs
Joint ventures
LVCs
light commercial vehicles
Samco
Saigon auto-mechanics Corporation
TEL
Temporary Exclusion List
UK
United Kingdom
US
United States
VEAM
Vietnam Engine & Agriculture Machinery
Corporation
Vinacoal
Vietnam Coal Corporation
Vinamotor
Vietnam Motor Corporation
WTO
World Trade Organization
iii
ACKOWLEDGMENTS
To finish this paper, I have received many helps.
I am heartily grateful to Professor Jonathan R. Pincus for his supervision and
guidance. His support and guidance from the initial to the final level help me to
develop this subject. He also read and corrected my grammars very carefully and in
details.
Also I would like to thank FULBRIGHT teachers and staffs in helping me to broaden
my view and knowledge during my studying.
And I would like to express my deepest gratitude to my parents and friends in
supporting me.
I offer my regards and blessings to all of those who supported me in any respect
during the completion of the paper.
Huynh Thi Kieu Oanh
iv
CONTENTS
1. INTRODUCTION ............................................................................................... 1
2. THE AUTOMOBILE INDUSTRY.................................................................... 4
2.1. Performance .................................................................................................... 5
2.1.1. Thailand ................................................................................................ 5
2.1.2. Vietnam ................................................................................................. 9
2.2. Policies and development ............................................................................. 13
2.2.1. Thailand .............................................................................................. 13
Before the 1997 crisis: protectism, agglomeration and development.... 13
Tariff and tax policy ................................................................................. 14
Localization and other policies ................................................................ 15
Developments of the automobile cluster and supporting industries ........ 18
After the 1997 crisis: Trade and investment liberalization and global and
regional integration ................................................................................. 19
Abolishing local content requirements and restructuring tariffs and other
taxes .......................................................................................................... 19
Promoting the development of related and supporting industries and large
automobile cluster investments................................................................. 21
2.2.2. Vietnam............................................................................................... 22
Before 2004: High protection for agglomeration .................................... 23
After 2004: Protection decreasing, but remains high .............................. 25
2.3. Explaining the differences and learning ....................................................... 27
2.3.1. Differences .......................................................................................... 27
2.3.2. Explanation ......................................................................................... 28
The domestic market is shrunk by government’s policies, especially
current tariff and taxes ............................................................................. 28
Supporting industries in Vietnam have not developed, especially an
autoparts industry to be able to localize production................................ 31
v
Vietnam also has some policies, such as land, R&D, financing policies but they
are not clear and useful ............................................................................... 33
2.3.3. Lessons................................................................................................ 33
3. POLICY RECOMMENDATIONS.................................................................. 34
3.1. Changing the current tariff and tax policy ................................................... 35
3.2. Developing of related and supporting industries ......................................... 36
3.3. Development of infrastructure ...................................................................... 37
4. CONCLUSION .................................................................................................. 38
REFERENCES........................................................................................................ 39
APPENDIX 1 ........................................................................................................... 42
TABLES
Table 1. List of FDI automakers in Vietnam ........................................................... 10
Table 2. The production volume of 11 JVs (in units), 1996 – 2002 ........................ 11
Table 3. Tariff and tax rate (%) related to CBU and CKD vehicles, before 1992 –
present ...................................................................................................................... 14
Table 4. Regulations to Thailand’ zone ................................................................... 21
FIGURES
Figure 1. Major functions within the automobile industry ......................................... 1
Figure 2. Competitiveness Diamond........................................................................... 4
Figure 3. Thailand’s automobile production (in units), 1993 – 2008 ......................... 6
Figure 4. Thailand’s automobile sales (in units), 1993 – 2008................................... 7
Figure 5. Thailand’s automobile sales share by producers (%), 2005 ........................ 7
Figure 6. Thailand’s automobile exports (in units), 1996 – 2008............................... 8
Figure 7. The VAMA’s sales volume (in units), 2000 – 2009 ................................. 11
Figure 8. Vietnam’s automobile sales share by companies (%), 2005 ..................... 12
1
1. INTRODUCTION
The automobile industry was acknowledged as the “the industry of industries” in
the twentieth century and is considered one of the most globalised industries today
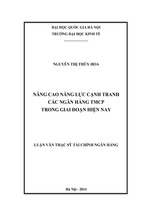
(Wad, 2009). From Figure 1, we see that the automobile industry is related closely
to many industries such as steel, electronics and textiles and contributes to the
development of many service industries such as finance, marketing, retailing and
banking. So a country that has a developed automobile industry will create good
conditions for promoting the development of other industries. This industry
contributes largely to socio - economic development and job creation. So, in the
ASEAN countries, such as the Philippines, Thailand, Indonesia, Vietnam and
Malaysia, it is one of the most important and supported industries. Development of
the automobile industry, covering car and component manufacturing, is usually
sought by policymakers in the developing and developed countries (Kohpaiboon,
2008).
Figure 1. Major functions within the automobile industry
BODIES
MAJOR
SUPPLYING
INDUSTRIES
Steel and other
metals
Rubber
Manufacture and
Stamping of body panels
COMPONENTS
a.
b.
Electronics
Body assembly
and painting
Manufacture of mechanical and electrical
components, e.g. instruments, braking system,
steering components
Manufature of wheels, types, seats, windscreens,
exhaust systems, etc
Final
assembly
CONSUMER
MARKET
Plastic
Glass
Textiles
ENGINES AND TRANSMISSIONS
Forging and casing of
engine and transmission
Machining and assembly of
engines and transmissions
Source: The changing nature of the Asian automobile industries (cited from
http://www.unescap.org/tid/publication/chap1_2212.pdf )
2
Vietnam’ automobile industry has begun since 1991. But up to now, it is small and
underdeveloped. Sales volume is very low, about 100,000 units per year. This
influences very much to generate economies of scale of assemblers and autoparts
companies. And now the local assembly industry in Vietnam is dominated by
foreign-invested joint ventures (JVs). It is focused solely on serving the domestic
market. In recent years, Vietnam has had many incentives to protect its automobile
industry with a view to increasing the local content and reducing the price of
vehicles. However, up to now, the local content rate is only about between 2% to
10%. So, local assembly products are heavily reliant on imported parts. In addition,
car price is very high. According to the survey of the Ministry of Finance, on
November 8th, 2008 the Toyota Corolla 1.8MT was sold in Vietnam with the price
of 19,532 USD while in other countries, it was sold 15,350 USD. Similarly, the
Toyota Camry 3.5 is 38,510 USD in Vietnam while the world price is from 24,215
USD and 28,695 USD. These results are against the government’s expectation and
also demonstrate that Vietnam’s policies have not worked in the automobile
industry.
As mentioned above, the automobile industry is supported and encouraged by many
countries in the ASEAN. The automobile industry in these countries generated
some achievements, especially Thailand. Now Thailand’s automotive industry is a
key sector in the overall economy that account for 11.3% of GDP in manufacturing
and employed 1.2 million workers in 2008 (Sirisuwanangkura, 2009). The local
content rate is between 60% and 80% depending on the type of vehicles. Since
2005, Thailand has become the largest production hub of ASEAN and rank number
14 in global production in 2008. To achieve these results, the government’s policies
contributed a large part.
The study chose Thailand as a comparative object because Thailand and Vietnam
are in the ASEAN region. In the past, present and future, the WTO and regional
commitments influence much to the automobile industries in Vietnam and Thailand.
3
Additionally, Thailand is an example of success in the development of the
automobile industry in the ASEAN.
As known, these results in the automobile depend in large part on government
policies. Thailand has been successful in building industrial policies such as tariff
and tax policies, local content requirements, supporting industrial development and
cluster – based automobile industry development, while Vietnam’s policies have not
promoted the domestic automobile industry.
This study does not focus on finding out these results in two countries. It
demonstrates the ways in which the policies have resulted in differences. So, the
study focuses on answering these following questions:
1. Which policies influenced the development of the automobile industry in Thailand
in the last years?
2. Which policies used to support the development of the automobile industry in
Vietnam?
3. Why are not Vietnam’s policies effective to the automobile industry in
comparison with the effect of Thailand’s policies?
About methodology and collecting data: Almost data of the study is secondary data.
It is collected from various sources, such as the reports of Vietnam’s Ministry of
Industry, the VAMA, the websites of automobile companies in Vietnam, the
available data of the TAIA from its website, the articles about Vietnam automobile
market information at Vietnam automobile Magazine and other sources.
About thesis restrictions: To write this paper, I put myself in the position of a policy
maker. And policy commendations only focus on the side of state and are to repair
the government failures.
4
This paper is organized as follows. The next section analyses the Vietnamese and
Thailand’s automobile industries and explains the differences described above.
Section 3 gives policy recommendations. The final section concludes and
summarizes.
2. THE AUTOMOBILE INDUSTRY
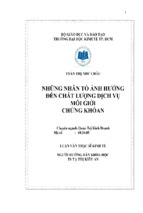
Using the diamond model of Michael Porter, there are four decisive factors in the
competitiveness of the industry as shown in Figure 2 (Porter, 1998). It includes firm
strategy, structure and rivalry, factor conditions, demand conditions and, related and
supporting industries.
The role of government policies in this model is to affect the other four factors with
a view to moving to higher levels of competitive performance. These main policies
include tariff and tax policy, localization, cluster-based development policy and
supporting industry development.
Figure 2: Competitiveness Diamond
Firm strategy,
structure and
rivalry
Demand
conditions
Factor
conditions
Related and
supporting
industries
Source: Porter, 1998
Government
policies
5
Over time, impact of these policies has contributed to differences between Vietnam
and Thailand. Based on this model, the study demonstrates the effect of the policies
through impact of the government’s policies to the other four factors.
2.1. Performance
It is difficult and complicated to compare to the auto industry in two countries
because of the differences in starting points and domestic conditions. The purpose
of this study is to demonstrate the ways in which the policies have resulted in
differences.
2.1.1. Thailand
Thailand launched its automobile industry in the 1960s. Based on government
policies, the country has developed a global and regional automobile industry. Over
40 years, this industry has grown from an import – substitution to an export –
oriented industry.
The Thai automobile industry supplier network is built as a pyramid, with 15 car
assemblers (see Appendix I), 648 tier – 1 suppliers and 1.641 tier – 2 suppliers
(Sirisuwanangkura, 2009). About 80% of the country’s overall automobile
assembling capacity belongs to Japanese companies. Most of these Original
Equipment Manufacturers (OEMs) are mainly members of Japanese keiretsu groups
supplying their own customer bases. The companies can be categorized into three
groups: members of a Japanese family of companies; joint ventures with Japanese
technology owners; and, companies that have technical assistance or licensing
agreements with Japanese firms (Royal Danish Embassy, 2006). Together with
Japanese firms, many new investments by non-Japanese tier-1 suppliers have
entered the country. Most Thai owned companies are in tier 2 or 3.
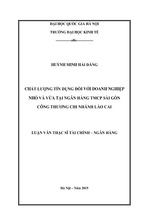
Figure 3 shows that the production of vehicles has picked up strongly after the post
– 1997 crisis. During the crisis, production fell rapidly, from 555,821 in 1996 to
6
143,250 in 1998. However, in 2005, production volume exceeded one millions units
and Thailand is the largest production hub of automobiles in ASEAN. In 2008, the
total production of vehicles was 1,391,728 units, compared with only 143,250
vehicles in 1998. About the structure of products in 2008, Thailand mainly
produced one-ton trucks and pick-up trucks. This matches domestic demand as
shown in Figure 4.
Figure 3. Thailand’s automobile production (in units), 1993 - 2008
Source: The Thailand Automobile Industry Association (retrieved data from
http://www.thaiauto.or.th/Records/eng/records_menu_eng.asp, 10/2009)
Sales can be classified into two types: passenger cars and commercial vehicles. In
Thailand, domestic demand is weighted towards light commercial vehicles,
especially one-ton vans and pick-up trucks. Commercial vehicles in total accounted
for around two – thirds of domestic demand. The tax regime has favored the
purchase of these vehicles rather than passenger cars. In 2008, 238,990 passenger
cars were sold, up by 30% from 182,767 units in 2007. More than 95% of local auto
demand was met by domestic production. Locally assembled one – ton pickups
7
account for about two-third of the total sector in Thailand. This makes Thailand the
second largest market for pickup trucks in the world, after the US.
Figure 4. Thailand’s automobile sales (in units), 1993 – 2008
Source: The Thailand Automobile Industry Association (retrieved data from
http://www.thaiauto.or.th/Records/eng/records_menu_eng.asp, 10/2009)
Figure 5. Thailand’s automobile sales share by producers (%), in 2005
Source: The Thailand Automobile Industry Association, 2005
8
As shown in Figure 5, vehicle sales were dominated by two brands: Toyota and
Isuzu. Toyota has the largest market share, with 39.8% in 2005. Isuzu has greatly
increased its market share and accounted for 25.4%. Honda, Mitsubishi and Nissan
follow with market shares of 7.7%, 6.8% and 5.9%, respectively. United States
automobile companies have also increased their presence in the market. Japanese
manufacturers controlled nearly 90% of the market.
After meeting domestic demand, the automobile companies export vehicles.
Thailand has become more export oriented since 1996. Exports have increased
gradually from 1999. In 2008, a total of 775,652 units were exported with a value of
516,244 million THB. Major car export markets were Australia, Indonesia and the
UK while vehicle components and parts were exported to Japan, the US and
Malaysia.
Figure 6. Thailand’s automobile export (in units), 1996 - 2008
Source: The Thailand Automobile Industry Association (retrieved data from
http://www.thaiauto.or.th/Records/eng/records_menu_eng.asp, 10/2009)
9
2.1.2. Vietnam
Before 1991, cars in Vietnam were mainly imported from the socialist countries.
Domestic companies had not invested in auto assembling, and were only focused on
repairing imported vehicles.
Since 1991 the automobile industry has begun to change dramatically as Vietnam
opened its economy to international trade and investment. In 1991, the first jointventure with the Philippines was formed in Vietnam, a company called Vietnam
Motors Corporation (VMC).
At present, Vietnam has 12 automobile joint-ventures (see Table 1), more than 40
foreign autopart companies and 100 domestic companies, including 20 Completely
Knocked Down (CKD) kits assemblers and repairers, 20 body-trailer-barrel builders
and 60 parts manufacturers. Joint-ventures (JVs) consist of seven Japanese
automakers (Daihatsu, Hino, Isuzu, Mitsubishi, Suzuki, Toyota and Honda), one
Korean automaker (Daewoo), one Korean-backed licensed assembler (Mekong),
one Philippine-backed licensed assembler (VMC), one German automaker
(Mercedes), and one American automaker (Ford). JVs are capable of manufacturing
any kind of vehicle demanded by the domestic market, but Hino Motors specializes
in heavy trucks.
Most of the JVs were established before 1996. They play an important role in the
Vietnam’s automobile industry. The total registered investment capital of JVs is
574.7 million USD and total real investment capital to the year 2002 was 419.85
millions USD (74% of registered capital). In 2005, Honda invested in producing
cars. As of 2005, total real investment capital was about 536 million USD.
By 2002, the total registered capacity of eleven JVs was 148,200 units per year.
However, these JVs used just 30% of total registered capacity and focused on
assembling. Before 2004, the activities of eleven JVs dominated the Vietnamese
10
automobile industry. The production volume of the eleven JVs accounted for more
than 90% of the domestic market. Products were diversified in many models. They
produced mainly cars to satisfy domestic market demand. Only Hino Motors
Company specialized in heavy duty trucks.
Table 1. List of FDI automakers in Vietnam
S
T
T
1
2
Company
MEKONG
CORPORATION
VIETNAM MOTOR
CORP.
Home
Country
Korea
Philippine
Company
Type
License
Assembler
License
Assembler
Registered
Capacity
capital
(units/year)
(million $)
Start
Date
Location
1992
HCMC
60
5,000
1992
Hanoi
35
20,000
3
VIDAMCO
Korea
Automaker
1993
Hanoi
32
10,500
4
VINASTAR
Japan
Automaker
1994
HCMC
50
5,000
5
MERCEDES BENZ VN
Germany
Automaker
1995
HCMC
70
10,000
6
VISUCO
Japan
Automaker
1995
HCMC
21
12,400
7
VINDACO
Japan
Automaker
1995
HCMC
10
3,600
8
FORD VIETNAM
US
Automaker
1995
Hanoi
102
14,000
9
TOYOTA VIETNAM
Japan
Automaker
1995
Hanoi
89
20,000
10 ISUZU VIETNAM
Japan
Automaker
1995
HCMC
50
10,000
11 HINO VIETNAM
Japan
Automaker
1996
Hanoi
17
1,760
12 HONDA VIETNAM
Japan
Automaker
2005
Hanoi
70
20,000
Source: Compiled from websites of automobile companies
Table 2 shows the production volume of 11 JVs from 1996 to 2002. We see that in
this period, the eleven JVs had assembled a total of 84,585 vehicles, achieved USD
1,976.6 million in sales and earned profits of USD 24.4 million. The production
volume of vehicles remains low, but is increasing annually. In 1996, total
production volume was only 5,538 vehicles. However in 2000, automobile
companies produced 13,955 units, up by 155%. Production volume in 2002 was
about 26,706 vehicles, a two fold increase over 2000.
11
Table 2. The production volume of 11 JVs (in units), 1996 - 2002
Company
1996
TOYOTA
1997
1998
1999
2000
2001
2002
201
1.277
1.836
2.179
4.600
5.759
7.335
1.014
689
465
1.097
1.750
2.906
3.719
11
362
325
1.195
1.915
3.685
71
359
252
183
547
1.874
2.622
2.090
1.341
950
1.250
2.222
1.800
2.358
VINASTAR
482
622
702
650
858
1.612
2.440
VISUCO
161
489
386
320
948
1.508
2.122
MEKONG CORPORATION
964
527
417
281
414
866
907
57
148
200
483
744
870
556
345
434
779
469
492
12
64
44
81
103
156
5.940
5.927
6.963
13.955
19.556
26.706
VIDAMCO
FORD VIETNAM
MERCEDES BENZ VN
VIETNAM MOTOR CORP.
ISUZU VIETNAM
VINDACO
555
HINO VIETNAM
Total
5.538
Source: Compiled from report of the Ministry of Industry in order to use for the
Master Plan for Developing Vietnam’s Automobile Industry, 10/2004
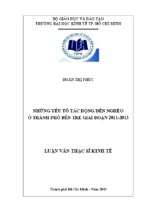
Figure 7. The VAMA’s sales volume (in units), 2000 – 2009
120000
110184
110000
2008
2009 (e)
100000
80392
80000
60000
42557
40138
40277
40897
2004
2005
2006
40000
26635
20000
18960
13239
0
2000
2001
2002
2003
2007
Source: The Vietnam Automobile Manufacturers’ Association, 12/2009
12
VAMA is a non-profit organization founded in 2000, started with 11 JVs and today
has 17 members. The sales volume of VAMA represents that of Vietnam’s auto
market. Figure 7 shows that sales have risen rapidly since 2007, but are still low,
only about 100,000 units per year. Compared with sales of 13,239 units in 2000,
volume has increased to 110,184 vehicles in 2008, nearly ninth times.
In 2005, Toyota Vietnam sold nearly 12,000 units, up 29% year on year and
accounting for 33.3% of VAMA’s overall sales. Following Toyota is Ford, Vinastar
and Vidamco with 14.3%, 11.9% and 11.9%, respectively. The 12 JVs used only
3.7% of capacity in 1996, rising to 13.2%, 18% and 28.8% in 2001, 2002 and 2003
respectively. It is very clear that capacity utilization rates in Vietnam’s automobile
industry are extremely low and JVs are counting on an increase in the size of the
domestic market as the country becomes more prosperous (Nguyen Bich Thuy,
2009).
Figure 8. Vietnam’s automobile sales share by companies (%), in 2005
Source: The Vietnamese Automobile Manufactures Association, 12/2005
Domestic Vietnamese automobile and autopart companies were mostly established
in the 1960s. By 2003, Vietnam had more than 160 domestic companies in
13
assembly and manufacture of autoparts. These included four state owned enterprises
supported largely by the government. They are Vietnam Motor Corporation
(Vinamotor), Saigon auto-mechanics Corporation (Samco), Vietnam Engine and
Agriculture Machinery Corporation (VEAM) and Vietnam Coal Corporation
(Vinacoal). Recently, and especially since 2004, many 100% domestic investment
companies, including private and state own enterprises, have been launched. For
example, Truong Hai auto company invested in producing Kia, Hyundai, Daewoo
and Foton with investment capital of USD 330 million, and TMT corporation
invested USD 250 million in manufacturing pickup trucks. A majority of these
companies import production lines and technology from China, and competition
among enterprises is increasing.
2.2. Policies and development
2.2.1. Thailand:
Before the 1997 crisis: protectism, agglomeration and development
The government’s support and promotion of this industry can be traced back to
1961 when the Thai Motor Industry Company, the first automobile assembly plant,
was established. Only a limited number of auto parts were domestically produced.
These included rubber parts, batteries and leaf springs. In 1969, the Ministry of
Industry formed the Automotive Industry Development Committee under a Cabinet
Resolution of August 26th, 1969, in order to impose policies and measures with an
aim to develop the local auto industry. Policies and procedures were put in place to
facilitate the process of moving from assembly to production. The objective of
production was import substitution and reducing the trade deficit. Before 2000, the
assembly companies and parts producers in Thailand were protected through five
main policies: high rate of import tariff and taxes; restricted and limited use of
imported auto parts; protected and controlled imports; no new operating plants; and,
investment promotion.
14
Tariff and tax policy:
Table 3. Tariff and Tax rate (%) related to CBU and CKD Vehicles,
before 1992 – present
Before
1992
1992
2000 –
present
1999
Completely built-up (CBU) vehicles
Passenger cars over 2,400 cc1
Tariff rate
Excise tax
300
44-55
68.5
41.8
80
43-50
80
41-48
Tariff rate
180
42
80
80
Excise tax
44-55
35.75
41.25
38.5
Tariff rate
120
60
60
80
Excise tax
Completely knocked-down (CKD)
vehicles
Passenger cars over 2,400 cc
9.9
n.a
5.5
3.3
112
44-55
42
41.8
20
43-50
33 (30)4
41-48
Tariff rate
112
42
20
33
Excise tax
44-55
41.8
41.25
38.5
72
20
20
33
9.9
3
5.5
3.3-19.83
Passenger cars under 2,400 cc
Pick-up truck
Tariff rate
Excise tax
Passenger cars under 2,400 cc
Pick-up truck
Tariff rate
Excise tax
2
Notes:
1. Before 1992, the classification of passenger vehicle was 2,300 cc engines
2. Excise taxes include municipal taxes
3. Excise taxes for one-ton pick-up trucks was 3.3% whereas for the so called
“pick-up passenger vehicle” is 19.8%
4. Numbers in parentheses are tariffs in 2005
Source: Kohpaiboon, 2008
Thailand used tariffs as a tool to protect the automobile industry. Before 1992, tariff
rates on most vehicles, except CKD kits of pick up trucks, were over 100%.
However, in 1990 the Ministry of Industry called off the limitation on the number of
- Xem thêm -