Mô tả:
Statistics
Technical Service Field Service Quality Assurance
Statistical Sampling
Variable
• Figures
Attribute
• Yes or No
Technical Service Field Service Quality Assurance
Sampling
Samples are divided into two groups.
•
Random Samples
– Drawn from a lot giving every sample the same
chance to get picked.
•
Aimed Samples
– Drawn in direct connection to an event.
NEVER MIX THE TWO!
Technical Service Field Service Quality Assurance
Sampling
Aimed Samples, objective.
•
Used to monitor the influence of an event in a
production lot.
•
Accumulated results can be used to improve
specific production steps, operational and
technical.
Technical Service Field Service Quality Assurance
Sampling
Random Samples, objective.
•
Used to give an estimation of the average defect
rate in a production lot.
•
Accumulated results can be used to estimate the
average performance level of a plant.
Technical Service Field Service Quality Assurance
Sampling
Random Sampling,
•
•
•
•
The size of a production lot does not matter.
Only the sample size determines the accuracy.
Percentage is not a good measurement.
Applying statistics is necessary due to limited
amount of sampling (cost reasons).
•
For rare events we use the Poisson Distribution
Technical Service Field Service Quality Assurance
Sampling
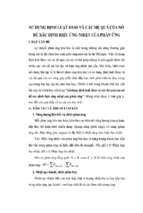
Defect rates detected at a certain sample size
Technical Service Field Service Quality Assurance
Sampling
Calculating sample size depending on AQL
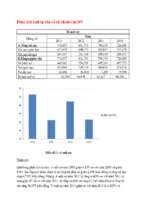
4.6
Technical Service Field Service Quality Assurance
Sampling
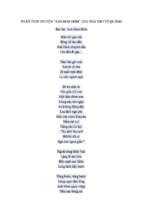
Calculating sample size depending on AQL
Formula: n =
100 x z
AQL (%)
Example: AQL = 1:10,000 = 0.01%
Defect detected (C) = 1 at a Probability of 99%
In the chart follow the 99-line to the C=1 curve,
then go to the y-axis to get the z-value. In this case 4.6.
From the formula we get:
100 x 4.6
= 46,000
0.01
If we take 46.000 samples from a lot with a assumed defect rate of
1 : 10.000, we have 99% chance to find one defect. If we find < 1, we know with 99% probability
that the actual defect rate is < 1 : 10.000
Technical Service Field Service Quality Assurance
Sampling
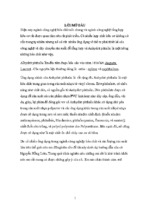
Calculating sample size depending on AQL
2.3
Technical Service Field Service Quality Assurance
Sampling
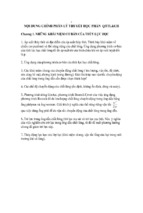
Calculating sample size depending on AQL
Formula: n =
100 x z
AQL (%)
Example: AQL = 1:10,000 = 0.01%
Defect detected (C) = 1 at a Probability of 90%
In the chart follow the 90-line to the C=1 curve,
then go to the y-axis to get the z-value. In this case 2.3.
From the formula we get:
100 x 2.3
= 23,000
0.01
If we take 23.000 samples from a lot with a assumed defect rate of
1 : 10.000, we have 90% chance to find one defect. If we find < 1, we know with 90% probability
that the actual defect rate is < 1 : 10.000
Technical Service Field Service Quality Assurance
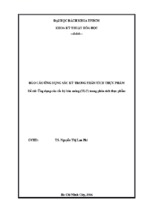
Sampling
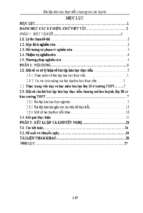
Probability of detecting defects (%)
Defect level
Sample size
Technical Service Field Service Quality Assurance
Designing a QC System
•
•
•
•
•
The AQL must be determined by the Management
Definitions of Defectives must be made
Limits for Raw Materials must be set (calculated)
Determine Evaluation methods based on defect type and
accuracy
Determine Sampling plans based on confidence and
verification frequency required
Technical Service Field Service Quality Assurance
The confidence level
•
The probability is an expression of the degree of likelihood that the
conclusions drawn from the results obtained by testing a certain
number (quantity) of material are correct
•
The risk is an expression of the degree of the likelihood that the
conclusions drawn from the result of testing a certain sample are
incorrect
•
% Probabilty + % Risk = 100%
Probabilities are usually expressed as the ratio: % Probability/100
Technical Service Field Service Quality Assurance
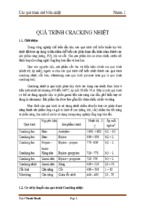
Simulation of uncertainty
Throw a dice 30 times and register the number of sixes. On a average
we get 5 sixes, but there is a considerable variation
m =n x p = 30 x 1/6 = 5
Notation:
n = number of times
p = probability each time to get a six
m = mean or average number of sixes among n:
m=nxp
Technical Service Field Service Quality Assurance
Statistics
•
•
•
•
Examine 2400 packages from a production. Assume defect rate is
0.1% (1 : 1000). How many defects will be found? Repeat.
M = n x p = 2400 x 0.1% = 2400 * 0.001 = 2.4
On a average we will find 2.4 defects, but there is a considerable
variation
Estimate of defect rate if …defects are found:
– 1 : 1/2400 = 0.04%
– 2 : 2/2400 = 0.17%
Technical Service Field Service Quality Assurance
Poisson distribution
•
•
•
•
Unsterility is a rare event
It is an attribute
p is small (less than 0.1)
Poisson distribution:
P (x=k) = mk x e-m
k!
•
this formula allows us to calculate the chance of finding ‘k’ elements
with a certain characteristic in a sample with size ‘n’ in a population
that contains 100 p% elements with that characteristic
Technical Service Field Service Quality Assurance
Poisson distribution: examples
Example 1:
• 4% of the Dutch population is more than 70 years old.
• What is the chance to find three persons in a group of 100 persons that are
older than 70 years?
– M = n x p = 100 x 0.04 = 4
– P(x=3) = 43 x e-4 = 64/6 x 0.0183 = 0.1952 = 19.52%
3!
Example 2:
• Assumed defect rate in production is 1:1000 = 0.1% (p=0.001)
• QC takes 100 samples from each production
• What is the chance to find 1 defect?
– M = n x p = 100 x 0.001 = 0.1
– P(x=1) = 0.11 x e-0.1 = 0.1 x 0.90 = 0.09 = 9.1%
1!
Technical Service Field Service Quality Assurance
Poisson distribution: examples
Example 3:
• Assumed defect rate in production is 1:1000 = 0.1% (p=0.001)
• QC takes 200 samples from each production
• What is the chance to find 1 defect?
– M = n x p = 200 x 0.001 = 0.2
– P(x=1) = 0.21 x e-0.2 = 0.2 x 0.82 = 0.164 = 16.4%
1!
Example 4:
• Accepted defect rate in production is 1:1000 = 0.1% (p=0.001)
• QC takes 2303 samples from a commissioning run
• What is the chance to find zero defects?
– M = n x p = 2303 x 0.001 = 2.303
– P(x=0) = 2.3030 x e-2.303 = 1 x 0.0999 = 0.0999 = 9.99% (10%)
0!
Technical Service Field Service Quality Assurance
Probability
Example 4 (cont’d) :
• Accepted defect rate in production is 1:1000 = 0.1% (p=0.001)
• QC takes 2303 samples from a commissioning run
• What is the chance to find zero defects?
– M = n x p = 2303 x 0.001 = 2.303
– P(x=0) = 2.3030 x e-2.303 = 0.1= 10%
0!
• The chance to find 1 or more defects is 100 - 10 = 90%
• If the outcome of the sterility test is that zero defects are found in 2303
samples, we know that with 90% probability the defect rate will be less than
1:1000
Technical Service Field Service Quality Assurance
- Xem thêm -