SEVENTH EDITION
SPECTROMETRIC
IDENTIFICATION OF
ORGANIC COMPOUNDS
ROBERT M. SILVERSTEIN
FRANCIS X. WEBSTER
DAVID J. KIEMLE
Stale University of New York
College of Environmental Science & Foreslry
JOHN WILEY 8« SONS, INC.
Acquisitions Editor
Debbie Brennan
Project Editor
Jennifer Yee
Production Manager
Pamela Kennedy
Production Editor
Sarah Wolfman-Robichaud
Marketing Manager
Amanda Wygal
Senior Designer
Madelyn Lesure
Senior Illustration Editor
Sandra Rigby
Project Management Services
Penny Warner/Progressive Information Technologies
'Ibis book was set in 10112 Times Ten by Progressive Information Technologies and printed
and bound by Courier Westford. The cover was printed by Lehigh Press.
This book is printed on acid free paper.
00
Copyright © 2005 John Wiley & Sons. Inc. All rights reserved.
No part of this publication may be reproduced, stored in a retrieval system or transmitted in
any form or by any means, electronic, mechanical, photocopying, recording, scanning or
otherwise, except as permitted under Sections 107 or 108 of the 1976 United States
Copyright Act, without either the prior written permission of the Publisher, or authorization
through payment of the appropriate per-copy fee to the Copyright Clearance ('~nter, Inc.
222 Rosewood Drive, Danvers, MA 01923, (978)750-8400, fax (978)646·8600.
Requests to the Publisher for permission should be addressed to the Permissions
Department, John Wiley & Sons, In.::., 111 River Street, Hoboken, NJ 07030-5774,
(201 )748-6011, fax (201 )748-6008.
To order books or for eustomer service please, call I-S00-CALL WILEY (225-5945).
ISBN 0-471-39362-2
WIE ISBN 0-471-42913-9
Printed in the United States of America
10987654321
PREFACE
The first edition of this problem-solving textbook was
published in 1963 to teach organic chemists how to
identify organic compounds from the synergistic information afforded by the combination of mass (MS), infrared (IR), nuclear magnetic resonance (MNR), and
ultraviolet (UV) spectra. Essentially, the molecule is
perturbed by these energy probes, and the responses
are recorded as spectra. UV has other uses, but is now
rarely used for the identification of organic compounds. Because of its limitations, we discarded UV in
the sixth edition with our explanation.
The remarkable development of NMR now demands four chapters. Identification of difficult compounds now depends heavily on 2-D NMR spectra, as
demonstrated in Chapters 5,6,7, and 8.
Maintaining a balance between theory and practice
is difficult. We have avoided the arcane areas of electrons and quantum mechanics, but the alternative
black-box approach is not acceptable. We avoided
these extremes with a pictorial, non-mathematical approach presented in some detail. Diagrams abound and
excellent spectra are presented at every opportunity
since interpretations remain the goal.
Even this modest level of expertise will permit solution of a gratifying number of identification problems. Of course, in practice other information is usually
available: the sample source, details of isolation, a synthesis sequence, or information on analogous material.
Often, complex molecules can be identified because
partial structures are known, and specific questions can
be formulated; the process is more confirmation than
identification. In practice, however, difficulties arise in
physical handling of minute amounts of compound:
trapping, elution from adsorbents, solvent removal,
prevention of contamination, and decomposition of unstable compounds. Water, air, stopcock greases, solvent
impurities, and plasticizers have frustrated many investigations. For pedagogical reasons, we deal only with
pure organic compounds. "Pure" in this context is a relative term, and all we can say is the purer, the better. In
many cases, identification can be made on a fraction of
a milligram, or even on several micrograms of sample.
Identification on the milligram scale is routine. Of
course, not all molecules yield so easily. Chemical manipulations may be necessary, but the information obtained from the spectra will permit intelligent selection
of chemical treatments.
To make all this happen, the book presents relevant material. Charts and tables throughout the text
are extensive and are designed for convenient access.
There are numerous sets of Student Exercises at the
ends of the chapters. Chapter 7 consists of six compounds with relevant spectra, which are discussed in
appropriate detail. Chapter 8 consists of Student Exercises that are presented (more or less) in order of increasing difficulty.
Ine authors welcome this opportunity to include
new material, discard the old, and improve the presentation. Major changes in each chapter are summarized
below.
Mass Spectrometry (Chapter 1)
Ine strength of this chapter has been its coverage of
fragmentation in EI spectra and remains so as a central
theme. The coverage of instrumentation has been
rewritten and greatly expanded, focusing on methods
of ionization and of ion separation. All of the spectra in
the chapter have been redone; there are also spectra of
new compounds. Fragmentation patterns (structures)
have been redone and corrected. Discussion of EI frag~
mentation has been partially rewritten. Student Exercises at the end of the chapter are new and greatly expanded.
The Table of Formula Masses (four decimal places)
is convenient for selecting tentative, molecular formulas, and fragments on the basis of unit-mass peaks. Note
that in the first paragraph of the Introduction to Chapter 7, there is the statement: "Go for the molecular formula."
Infrared Spectrometry (Chapter 2)
It is still necessary that an organic chemist understands
a reasonable amount of theory and instrumentation in
IR spectrometry. We believe that our coverage of
"characteristic group absorptions" is useful, together
with group-absorption charts, characteristic spectra,
references, and Student Exercises. This chapter remains
essentially the same except the Student Exercises at
the end of the chapter. Most of the spectra have been
redone.
Proton NMR Spectrometry (Chapter 3)
In this chapter, we lay the background for nuclear magnetic resonance in general and proceed to develop proton NMR. The objective is the interpretation of proton
iii
iv
PREFACE
spectra. From the beginning, the basics of NMR spectrometry evolved with the proton, which still accounts
for most of the NMR produced.
Rather than describe the 17 Sections in this chapter. we simply state that the chapter has been greatly
expanded and thoroughly revised. More emphasis is
placed on FT NMR, especially some of its theory. Most
of the figures have been updated, and there are many
new figures including many 600 MHz spectra. The number of Student Exercises has been increased to cover
the material discussed. 'The frequent expansion of proton multiplets will be noted as students master the concept of "first-order multiplets." This important concept
is discussed in detail.
One further observation concerns the separation
of IH and BC spectrometry into Chapters 3 and 4. We
are convinced that this approach, as developed in earlier editions, is sound, and we proceed to Chapter 4.
cal correlations and include several 2-D spectra. The
nuclei presented are:
15N, 19F, 29Si, and 31p
Solved Problems (Chapter 7)
Chapter 7 consists of an introduction followed by six
solved "Exercises." Our suggested approaches have
been expanded and should be helpful to students. We
have refrained from being overly prescriptive. Students
are urged to develop their own approaches, but our
suggestions are offered and caveats posted. The six exercises are arranged in increasing order of difficulty.
Two Student Exercises have been added to this chapter, structures are provided, and the student is asked to
make assignments and verify the structures. Additional
Student Exercises of this type are added to the end of
Chapter 8.
Carbon-13 NMR Spectrometry
(Chapter 4)
Assigned Problems (Chapter 8)
This chapter has also been thoroughly revised. All of
the Figures are new and were obtained either at
75.5 MHz (equivalent to 300 MHz for protons) or 150.9
MHz (equivalent to 600 MHz for protons). Many of the
tables of BC chemical shifts have been expanded.
Much emphasis is placed on the DEPT spectrum.
In fact, it is used in all of the Student Exercises in place
of the obsolete decoupled BC spectrum. The DEPT
spectrum provides the distribution of carbon atoms
with the number of hydrogen atoms attached to each
carbon.
Chapter 8 has been completely redone. 'The spectra are
categorized by structural difficulty, and 2-D spectra
are emphasized. For some of the more difficult examples, the structure is given and the student is asked to
verify the structure and to make all assignments in the
spectra.
Answers to Student Exercises are available in PDF
format to teachers and other professionals, who can receive the answers from the publisher by letterhead request. Additional Student Exercises can be found at
http://www.wiley.com/colle ge/sil verstein.
Correlation NMR Spectrometry;
2-D NMR (Chapter 5)
Final Thoughts
Chapter 5 still covers 2-D correlation but has been reorganized, expanded, and updated, which reflects the
ever increasing importance of 2-D NMR. The reorganization places all of the spectra together for a given
compound and treats each example separately: ipsenol,
caryophyllene oxide, lactose, and a tetrapeptide. Pulse
sequences for most of the experiments are given. The
expanded treatment also includes many new 2-D experiments such as ROESY and hybrid experiments
such as HMQC-TOCSY. There are many new Student
Exercises.
NMR Spectrometry of Other Important
Nuclei Spin 1/2 Nuclei (Chapter 6)
Chapter 6 has been expanded with more examples,
comprehensive tables, and improved presentation of
spectra. The treatment is intended to emphasize chemi-
Most spectrometric techniques are now routinely accessible to organic chemists in walk-up laboratories.
The generation of high quality NMR, lR, and MS data
is no longer the rate-limiting step in identifying a
chemical structure. Rather, the analysis of the data has
become the primary hurdle for the chemist as it has
been for the skilled spectroscopist for many years. Software tools are now available for the estimation and
prediction of NMR, MS, and IR spectra based on a
structural input and the dream solution of automated
structural elucidation based on spectral input is also
becoming increasingly available. Such tools offer both
the skilled and non-skilled experimentalist muchneeded assistance in interpreting the data. There are a
number of tools available today for predicting spectra,
(see http://www.acdlabs.com for more explicit details),
which differ in both complexity and capability.
In summary, this textbook is designed for upper-division undergraduates and for graduate students. It will
PREFACE
also serve practicing organic chemists. As we have reiterated throughout the text, the goal is to interpret spectra by utilizing the synergistic information. Thus, we
have made every effort to present the requisite spectra
in the most "legible" form. This is especially true of the
NMR spectra. Students soon realize the value of firstorder multiplets produced by the 300 and 600 MHz
spectrometers, and they will appreciate the numerous
expanded insets. As will the instructors.
ACKNOWLEDGMENTS
We thank Anthony Williams, Vice President and Chief
Science Officer of Advanced Chemistry Development
(ACD), for donating software for IRIMS processing,
which was used in four of the eight chapters; it allowed
us to present the data easily and in high quality. We
also thank Paul Cope from Bruker BioSpin Corporation for donating NMR processing software. Without
these software packages, the presentation of this book
would not have been possible.
V
We thank Jennifer Yee, Sarah WolfmanRobichaud, and other staff of John Wiley and Sons for
being highly cooperative in transforming the various
parts of a complex manuscript into a handsome Seventh Edition.
The following reviewers offered encouragement
and many useful suggestions. We thank them for the
considerable time expended: John Montgomery, Wayne
State University; Cynthia McGowan, Merrimack College; William Feld, Wright State University; James S.
Nowick, University of California, Irvine; and Mary
Chisholm, Penn State Erie, Behrend College.
Finally, we acknowledge Dr. Arthur Stipanovic Director of Analytical and Technical services for allowing
us the use of the Analytical facilities at SUNY ESE
Syracuse.
Our wives (Olive, Kathryn, and Sandra) offered
constant patience and support. There is no adequate
way to express our appreciation.
From left to right: Robert M. Silverstein, Francis X. Webster, and David 1. Kiemle.
Robert M. Silverstein
Francis X. Webster
David J. Kiemle
PREFACE TO FIRST EDITION
During the past several years, we have been engaged in
isolating small amounts of organic compounds from
complex mixtures and identifying these compounds
spectrometrically.
At the suggestion of Dr. A. 1. Castro of San Jose
State College, we developed a one unit course entitled
"Spectrometric Identification of Organic Compounds,"
and presented it to a class of graduate students and industrial chemists during the 1962 spring semester. This
book has evolved largely from the material gathered
for the course and bears the same title as the course. *
We should first like to acknowledge the financial
support we received from two sources: The PerkinElmer Corporation and Stanford Research Institute.
A large debt of gratitude is owed to our colleagues
at Stanford Research Institute. We have taken advantage of the generosity of too many of them to list them
individually, but we should like to thank Dr. S. A.
Fuqua, in particular, for many helpful discussions of
NMR spectrometry. We wish to acknowledge also the
cooperation at the management level, Dr. C. M. Himel,
chairman of the Organic Research Department, and
Dr. D. M. Coulson, chairman of the Analytical Research Department.
Varian Associates contributed the time and talents
of its NMR Applications Laboratory. We are indebted
to Mr. N. S. Bhacca, Mr. L. F. Johnson, and Dr. J. N.
Shoolery for the NMR spectra and for their generous
help with points of interpretation.
The invitation to teach at San Jose State College
was extended to Dr. Bert M. Morris, head of the Department of Chemistry, who kindly arranged the administrative details.
The bulk of the manuscript was read by Dr. R. H.
Eastman of the Stanford University whose comments
were most helpful and are deeply appreciated.
Finally, we want to thank our wives. As a test of a
wife's patience, there are few things to compare with an
author in the throes of composition. Our wives not only
endured, they also encouraged, assisted, and inspired.
* A brief description of the methodology had been published: R M.
Silverstein and G. C. Bassler, 1 Chem. Educ. 39,546 (1962).
R. M. Silverstein
G. C. Bassler
vi
Menlo Park, California
April 1963
CONTENTS
CHAPTER 1
MASS SPECTROMETRY
1.6.5.2
1
1.6.6
1.1
Introduction
1.2
Instrumentation 2
1.3
Ionization Methods 3
1.3.1
Gas-Phase Ionization Methods 3
1.3.1.1
1.3.1.2
1.3.2
1.3.2.1
1.3.2.2
1.3.2.3
1.3.2.4
1.3.3
1.3.3.1
1.3.3.2
1
Electron Impact Ionization
Chemical Ionization 3
Aromatic Aldehydes
1.6.6.1
1.6.6.2
1.6.7
Aliphatic Acids 28
Aromatic Acids 28
Carboxylic Esters 29
1.6.7.1
1.6.7.2
1.6.7.3
3
1.6.8
Desorption Ionization Methods 4
1.6.9
Aliphatic Estcrs 29
Benzyl and Phenyl Esters 30
Esters of Aromatic Acids 30
Lactones 31
Amines 31
1.6.9.1
1.6.9.2
1.6.9.3
Aliphatic Amines 31
Cyclic Amines 32
Aromatic Amines (Anilines)
1.6.10
Amides 32
1.6.10.1
Aliphatic Amides 32
1.6.10.2 Aromatic Amides 32
1.6.11
Aliphatic Nitriles 32
Field Desorption Ionization 4
Fast Atom Bombardment Ionization 4
Plasma Desorption Ionization 5
Laser Desorption Ionization 6
Evaporative Ionization Methods 6
Thermospray Mass Spectrometry 6
Electrospray Mass Spectrometry 6
1.6.12
1.4
1.5
Mass Analyzers 8
1.4.1
Magnetic Spector Mass Spectrometers 9
1.4.2
Quadrupole Mass Spectrometers 10
1.4.3
Ion Trap Mass Spectrometers 10
1.4.4
Time-of-Flight Mass Spectrometer 12
1.4.5
Fourier Transform Mass Spectrometer' 12
1.4.6
Tandem Mass Spectrometry 12
1.6.13
1.6.14
1.6.15
15
Mass Spectra of Some Chemical Classes 19
Hydrocarbons 19
1.6.1
1.6.1.1
L6.1.2
1.6.1.3
1.6.2
1.6.2.1
1.6.2.2
1.6.3
L6.3.1
1.6.3.2
Saturated Hydrocarbons 19
Alkenes (Oletins) 20
Aromatic and Aralkyl Hydrocarbons
Hydroxy Compounds 22
Alcohols 22
Phenols 24
1.6.17
24
34
Heteroaromatic Compounds 37
References 38
Student Exercises 39
Appendices 47
A Formulas Masses 47
B
Common Fragment Ions 68
C
Common Fragments Lost 70
CHAPTER 2
Ethers 24
Aliphatic Ethers (and Acetals)
Aromatic Ethers 25
1.6.4
Ketones 26
1.6.4.1
Aliphatic Ketones 26
1.6.4.2 Cyclic Ketones 26
1.6.4.3 Aromatic Ketones 27
1.6.5
Aldehydes 27
1.6.5.1 Aliphatic Aldehydes 27
21
Aliphatic Nitrites 33
Aliphatic Nitrates 33
Sulfur Compounds 33
Aliphatic Mercaptans (Thiols)
Aliphatic Sulfides 34
Aliphatic Disulfides 35
1.6.16
Halogen Compounds 35
1.6.16.1
Aliphatic Chlorides 36
1.6.16.2 Aliphatic Bromides 37
1.6.16.3
Aliphatic Iodides 37
1.6.16.4
Aliphatic Fluorides 37
1.6.16.5
Benzyl Halides 37
1.6.16.6 Aromatic Halides 37
1.5.3
1.6
Aliphatic Nitro Compounds 33
Aromatic Nitro Compounds 33
1.6.15.1
1.6.15.2
1.6.15.3
Interpretation of EI Mass Spectra 13
Recognition of the Molecular Ion Peak 14
1.5.2
Determination of a Molecular Formula 14
Use of the Molecular Formula. Index of
Hydrogen Deficiency 16
1.5.4
Fragmentation 17
1.5.5
Rearrangements 19
32
Nitro Compounds 33
1.6.12.1
1.6.12.2
1.5.1
1.5.2.1
Unit-Mass Molecular Ion and
Isotope Peaks 14
1.5.2.2 High-Resolution Molecular Ion
28
Carboxylic Acids 28
INFRARED SPECTROMETRY
2.1
Introduction 72
2.2
Theory 72
2.2.1
Coupled Interaction 75
2.2.2
Hydrogen Bonding 76
2.3
72
Instrumentation 78
Dispersion IR Spectrometer 78
2.3.2
Fourier Transform Infrared Spectrometer
(Interferometer) 78
2.3.1
vii
viii
2.4
CONTENTS
Sample Handling
2.6.17.5
C=O Stretching Vibrations of Lactams 101
Amines 101
2.6.18.1
N-H Stretching Vibrations 101
2.6.18.2 N-H Bending Vibrations 101
2.6.18.3 C-N Stretching Vibrations 102
2.6.19
Amine Salts 102
2.6.19.1
N- H Stretching Vibrations 102
2.6.19.2 N-H Bending Vibrations 102
2.6.20
Amino Acids and Salts of Amino Acids 102
2.6.21
Nitriles 103
2.6.22
lsonitriles (R-N=C), Cyanates
(R-O-C=N), Isocyanates (R-N=C=O),
Thiocyanates (R-S-C=N), lsothiocyanates
(R-N=C=S) 104
2.6.23
Compounds Containing -N=N 104
2.6.24
Covalent Compounds Containing NitrogenOxygen Bonds 104
2.6.24.1
N=O Stretching Vibrations Nitro
Compounds 104
2.6.25
Organic Sulfur Compounds 105
2.6.25.1 S=H Stretching Vibrations Mercaptans 105
2.6.25.2 C-S and C=S Stretching Vibrations 106
2.6.26
Compounds Containing Sulfur-Oxygen
Bonds 106
2.6.26.1 S=O Stretching Vibrations Sulfoxides 106
2.6.27
Organic Halogen Compounds 107
2.6.28
Silicon Compounds 107
2.6.28.1 Si-H Vibrations 107
2.6.28.2 SiO-H and Si-O Vibrations 107
2.6.28.3 Silicon-Halogen Stretching Vibrations 107
2.6.29
Phosphorus Compounds 107
2.6.29.1
p=o and p-o Stretching Vibrations 107
2.6.30
Heteroaromatic Compounds 107
2.6.30.1
C-H Stretching Vibrations 107
2.6.30.2 N-H Stretching Frequencies 108
2.6.30.3
Ring Stretching Vibrations
(Skeletal Bands) 108
2.6.30.4 C~H Out-of-Plane Bending 108
79
2.5
Interpretations of Spectra
2.6
Characteristic Group Absorption of Organic
Molecules 82
2.6.1
Normal Alkanes (Paraffins) 82
2.6.1.1 C-H Stretching Vibrations 83
2.6.1.2 c~ H Bending Vibrations Methyl Groups 83
2.6.2
Branched-Chain Alkanes 84
2.6.2.1 C-H Stretching Vibrations Tertiary C-H
Groups 84
2.6.2.2 C-H Bending Vibrations gem-Dimethyl
Groups 84
2.6.3
Cyclic Alkanes 85
2.6.3.1 C-H Stretching Vibrations 85
2.6.3.2 C-H Bending Vibrations 85
2.6.4
Alkenes 85
2.6.4.1 C-C Stretching Vibrations Unconjugated Linear
Alkenes 85
2.6.4.2 Alkene C-H Stretching Vibrations 86
2.6.4.3 Alkene C-H Bending Vibrations 86
2.6.5
Alkynes 86
2.6.5.1 C-C Stretching Vibrations 86
2.6.5.2 C-H Stretching Vibrations 87
2.6.5.3 C-H Bending Vibrations 87
2.6.6
Mononuclear Aromatic Hydrocarbons 87
2.6.6.1
Out-of-Plane C-H Bending Vibrations 87
2.6.7
Polynuclear Aromatic Hydrocarbons 87
2.6.8
Alcohols and Phenols 88
2.6.8.1 O-H Stretching Vibrations 88
2.6.8.2 C-O Stretching Vibrations 89
2.6.8.3 O-H Bending Vibrations 90
2.6.9
Ethers. Epoxides, and Peroxides 91
2.6.9.1 C-O Stretching Vibrations 91
2.6.10
Ketones 92
2.6.10.1 C- 0 Stretching Vibrations 92
2.6.10.2 C-C(=O)--C Stretching and Bending
Vibrations 94
2.6.11
Aldehydes 94
2.6.11.1 C=O Stretching Vibrations 94
2.6.11.2
C~-H Stretching Vibrations
94
2.6.12
Carboxylic Acids 95
2.6.12.1
O-H Stretching Vibrations 95
2.6.12.2 c=o Stretching Vibrations 95
2.6.12.3 C-O Stretching and O-H Bending
Vibrations 96
2.6.13
Carboxylate Anion 96
2.6.14
Esters and Lactones 96
2.6.14.1
C=O Stretching Vibrations 97
2.6.14.2 C~-O Stretching Vibrations 98
2.6.15
Acid Halides 98
2.6.15.1
C=O Stretching Vibrations 98
2.6.16
Carboxylic Acid Anhydrides 98
2.6.16.1 c=o Stretching Vibrations 98
2.6.16.2 C-O Stretching Vibrations 98
2.6.17
Amides and Lactams 99
2.6.17.1
N-H Stretching Vibrations 99
2.6.17.2 C=O Stretching Vibrations
(Amide I Band) 100
2.6.17.3 N-H Bending Vibrations
(Amide II Band) 100
2.6.17.4 Other Vibration Bands 101
2.6.18
80
References
108
Student Exercises
110
Appendices 119
A
Transparent Regions of Solvents and Mulling Oils
119
B Characteristic Group Absorptions 120
C Absorptions for Alkenes 125
D Absorptions for Phosphorus Compounds 126
E
Absorptions for Heteroaromatics 126
CHAPTER 3
PROTON MAGNETIC RESONANCE
SPECIROMETRY 127
3.1
3.2
Introduction
Theory
3.2.1
3.2.2
3.2.3
3.3
127
127
Magnetic Properties of Nuclei 127
Excitation of Spin 112 Nuclei 128
Relaxation 130
Instrumentation and Sample Handling 135
Instrumentation 135
3.3.2
Sensitivity of NMR Experiments 136
Solvent Selection 137
3.3.3
3.3.1
CONTENTS
3.4
Chemical Shift
3.5
Spin Coupling, Multiplets, Spin Systems 143
3.5.1
Simple and Complex First Order
Multiplets 145
3.5.2
First Order Spin Systems 146
3.5.3
Pople Notions 147
3.5.4
Further Examples of Simple. First-Order Spin
Systems 147
3.5.5
Analysis of First-Order Patterns 148
3.6
137
Protons on Oxygen, Nitrogen, and Sulfur Atoms.
Exchangeable Protons 160
3.6.1
Protons on an Oxygen Atom 150
3.6.1.1
3.6.1.2
3.6.1.3
3.6.1.4
3.6.1.5
Alcohols 150
Water 153
Phenols 153
Enols 153
Carboxylic Acids
3.11.2.1
3.11.2.2
3.11.2.3
3.11.2.4
3.11.3.1
3.12 Chirality
3.12.1
3.12.2
168
169
One Chiral Center. Ipsenol
Two Chiral Centers 171
3.13 Vicinal and Geminal Coupling
169
171
172
3.15 Selective Spin Decoupling. Double
Resonance 173
153
Coupling of Protons to Other Important Nuclei (19 F,
D, 31p, 29Si, and 13C) 155
3.7.1
Coupling of Protons to 19F 155
3.7.2
Coupling of Protons to D 155
3.7.3
Coupling of Protons to 31p 156
3.7.4
Coupling of Protons to 29Si 156
3.7.5
Coupling of Protons to
156
Chemical Shift Equivalence 157
Determination of Chemical Shift Equivalence
by Interchange Through Symmetry Operations 157
3.8.1
3.8.1.1
Interchange by Rotation Around a Simple Axis of
Symmetry (en) 157
3.8.1.2
Interchange by Refiectionlbrough a Plane of
Symmetry (iT) 157
3.8.1.3
Interchange by Inversion "Ibrough a Center of
Symmetry (i) 158
3.8.1.4
No Interchangeability by a Symmetry
Operations 158
Determination of Chemical Shift Equivalence
by Tagging (or Substitution) 159
3.8.3
Chemical Shift Equivalence by Rapid
Interconversion of Structures 160
3.8.2
3.S.3.1
Keto-Enollnterconversion 160
3.8.3.2
Interconversion Around a "Partial Double Bond"
(Restricted Rotation) 160
3.S.3.3
Interconversion Around the Single Bond
of Rings 160
3.8.3.4 Interconversion Around the Single Bonds
of Chains 161
3.9
3·Methylglutaric Acid
3.14 Low-Range Coupling
Protons on Nitrogen 153
Protons on Sulfur 155
3.6.3
3.6.4
Protons on or near Chlorine, Bromine, or
Iodine Nuclei 155
3.8
Dimethyl Succinate 167
Dimethyl Glutarate 167
Dimethyl Adipate 167
Dimethyl Pimelate 168
Less Symmetrical Chains 168
3.11.3
3.16 Nuclear Overhauser Effect, Difference
Spectrometry, 1 H 1H Proximity Through
Space 173
3.6.2
3.7
Symmetrical Chains 167
3.11.2
3.17 Conclusion
References
176
Student Exercises
177
Appendices 188
A Chemicals Shifts of a Proton 188
B
Effect on Chemical Shifts by Two or Three
Directly Attached Functional Groups 191
C
Chemical Shifts in Alicyclic and Heterocyclic
Rings 193
D
Chemical Shifts in Unsaturated and Aromatic
Systems 194
E
Protons on Heteroatoms 197
F
Proton Spin-Coupling Constants 198
G
Chemical Shifts and Multiplicities of Residual
Protons in Commercially Available Deuterated
Solvents 200
H
IH NMR Data 201
I
Proton NMR Chemical Shifts of Amino Acids in
D 20 203
CHAPTER 4
CARBON·13 NMR
SPECTROMETRY 204
4.1
Introduction
4.2
Theory 204
4.2.1
IH Decoupling Techniques 204
4.2.2
Chemical Shift Scale and Range 205
4.2.3
T j Relaxation 206
4.2.4
Nuclear Overhauser Enhancement
(NOE) 207
4.2.5
13C_1H Sping Coupling (J Values) 209
4.2.6
Sensitivity 210
4.2.7
Solvents 210
4.3
Interpretation of a Simple 13C Spectrum: Diethyl
Phthalate 211
4.4
Quantitative 13C Analysis
4.5
Chemical Shift Equivalence 214
Magnetic Equivalence (Spin-Coupling
Equivalence) 162
3.10 AMX, ABX, and ABC Rigid Systems with Three
Coupling Constants 164
3.11 Confirmationally Mobile, Open-Chain Systems.
Virtual Coupling 165
3.11.1
Unsymmetrical Chains 165
3.11.1.1
I-Nitropropane 165
3.11.1.2
I·Hexanol 165
175
204
213
ix
X
4.6
4.7
CONTENTS
DEPT 215
5.7
Chemical Classes and Chemical Shifts 217
Alkanes 218
4.7.1
4.7.1.1
4.7.1.2
4.7.1.3
Linear and Branched Alkanes 218
Effect of Substituents on Alkenes 218
Cycloalkanes and Saturated Heterocyclics
4.7.2
Alkenes 220
4.7.3
Alkynes 221
4.7.4
Aromatic Compounds 222
4.7.5
Heteroaromatic Compounds 223
4.7.6
Alcohols 223
4.7.7
Ethers, Acetals, and Epoxides 225
4.7.8
Halides 225
4.7.9
Amines 226
4.7.10
'Ibiols, Sulfides, and Disulfides 226
Lactose 267
DQF-COSY: Lactose 267
HMQC: Lactose 270
5.7.3
HMBC: Lactose 270
5.7.1
5.7.2
5.8
220
Functional Groups Containing Carbon 226
4.7.11.1
Ketones and Aldehydes 227
4.7.11.2
Carboxylic Acids, Esters, Chlorides, Anhydrides,
Amides, and Nitriles 227
4.7.11.3
Oximes 227
Relayed Coherence Transfer: TOCSY 270
2-D TOCSY: Lactose 270
5.8.2
l-D TOCSY: Lactose 273
5.8.1
5.9
HMQC
5.9.1
5.10 ROESY
5.10.1
5.11 VGSE
5.11.1
5.11.2
4.7.11
5.11.3
5.11.4
5.11.5
TOCSY 275
HMQC TOCSY: Lactose 275
275
ROESY: Lactose 275
278
COSY:VGSE 278
TOCSY:VGSE 278
HMQC:VGSE 278
HMBC:VGSE 281
ROESY:VGSE 282
5.12 Gradient Field NMR
References 228
References 285
Student Exercises 229
Student Exercises 285
Appendices 240
A The 13C Chemical Shifts, Couplings and
Multiplicities of Common NMR Solvents 240
B
BC Chemical Shift for Common Organic
Compounds in Different Solvents 241
C
The l3C Correlation Chart for Chemical
Classes 242
D
BC NMR Data for Several Natural
Products (8) 244
CORRELATION NMR
SPECTROMETRY; 2-D NMR 245
CHAPTER 5
282
NMR SPECTROMETRY OF OTHER
IMPORTANT SPIN 112 NUCLEI 316
CHAPTER 6
6.1
Introduction 316
6.2
15N Nuclear Magnetic Resonance 317
6.3
19F Nuclear Magnetic Resonance 323
6.4
29Si Nuclear Magnetic Resonance 326
6.5
31p Nuclear Magnetic Resonance 327
6.6
Conclusion 330
References 332
5.1
Introduction 245
Student Exercises 333
5.2
Theory 246
Appendices 338
A Properties of Magnetically Active Nuclei 338
5.3
Correlation Spectrometry 249
IH _I H Correlation: COSY 250
5.3.1
5.4
5.5
5.6
Ipsenol: lH_1H COSY 251
5.4.1
Ipsenol: Double Quantum Filtered IH-IH
COSY 251
5.4.2
Carbon Detected 13C-1H COSY:
HECTOR 254
5.4.3
Proton Detected IH_13C COSY:
HMQC 254
5.4.4
Ipsenol: HECTOR and HMQC 255
5.4.5
Ipsenol: Proton-Detected, Long Range
IH_13C Heteronuclear Correlation: HMBC 257
CHAPTER 7
7.1
SOLVED PROBLEMS
341
Introduction 341
Problem 7.1 Discussion 345
Problem 7.2 Discussion 349
Problem 7.3 Discussion 353
Problem 7.4 Discussion 360
Problem 7.5 Discussion 367
Problem 7.6 Discussion 373
Caryophyllene Oxide 259
5.5.1
Caryophyllene Oxide: DQF-COSY 259
5.5.2
Caryophyllene Oxide: HMQC 259
5.5.3
Caryophyllene Oxide: HMBC 263
Student Exercises 374
13C_13C Correlations: Inadequate 265
5.6.1
Inadequate: Caryophyllene Oxide 266
8.1
CHAPTER 8
ASSIGNED PROBLEMS
Introduction 381
Problems 382
381
CHAPTER
1
MASS SPECTROMETRY
1.1
INTRODUCTION
The concept of mass spectrometry is relatively
simple: A compound is ionized (ionization method),
the ions are separated on the basis of their
mass/charge ratio (ion separation method), and the
number of ions representing each mass/charge "unit"
is recorded as a spectrum. For instance, in the commonly used electron-impact (EI) mode, the mass
spectrometer bombards molecules in the vapor phase
with a high-energy electron beam and records the
result as a spectrum of positive ions, which have been
separated on the basis of mass/charge (m/ z). *
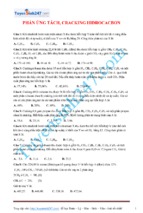
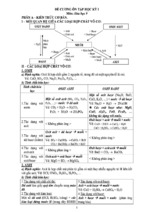
To illustrate, the EI mass spectrum of benzamide is
given in Figure 1.1 showing a plot of abundance (vertical peak intensity) versus m/z. The positive ion peak at
m/z 121 represents the intact molecule (M) less one
electron, which was removed by the impacting electron
beam; it is designated the molecular ion, M·+. The en-
ergetic molecular ion produces a series of fragment
ions, some of which are rationalized in Figure 1.1.
It is routine to couple a mass spectrometer to some
form of chromatographic instrument, such as a gas
chromatograph (GC-MS) or a liquid chromatograph
(LC-MS). The mass spectrometer finds widespread use
in the analysis of compounds whose mass spectrum is
known and in the analysis of completely unknown
compounds. In the case of known compounds, a
computer search is conducted comparing the mass
spectrum of the compound in question with a library of
mass spectra. Congruence of mass spectra is convincing
evidence for identification and is often even admissible
in court. In the case of an unknown compound, the
molecular ion, the fragmentation pattern, and evidence
from other forms of spectrometry (e.g., IR and NMR)
can lead to the identification of a new compound. Our
focus and goal in this chapter is to develop skill in the
latter use. For other applications or for more detail,
oII
Benzamide
C7H 7 NO
6
Mol. Wt: 121
771
--co
miz77
105
1
M+
121l
51l
44l
o
20
30
40
50
60 mlz 70
80
90
100
110
120
FIGURE 1.1 The EI mass spectrum of benzamide above which is a fragmentation pathway to explain some of
the important ions.
* The unit of mass is the Dalton (Da), defined as 1112 of the mass of
an atom of the isotope
which is arbitrarily 12.0000 ... mass units.
1
2
CHAPTER 1 MASS SPECTROMETRY
mass spectrometry texts and spectral compilations are
listed at the end of this chapter.
1.2
INSTRUMENTATION
This past decade has been a time of rapid growth and
change in instrumentation for mass spectrometry.
Instead of discussing individual instruments, the type of
instrument will be broken down into (1) ionization
methods and (2) ion separation methods. In general,
the method of ionization is independent of the method
of ion separation and vice versa, although there are
exceptions. Some of the ionization methods depend on
a specific chromatographic front end (e.g., LC-MS),
while still others are precluded from using chromatography for introduction of sample (e.g., "FAB and
MALDI). Before delving further into instrumentation,
let us make a distinction between two types of mass
spectrometers based on resolution.
The minimum requirement for the organic chemist
is the ability to record the molecular weight of the
compound under examination to the nearest whole
number. Thus, the spectrum should show a peak at, say,
mass 400, which is distinguishable from a peak at mass
399 or at mass 401. In order to select possible molecular formulas by measuring isotope peak intensities (see
Section 1.5.2.1), adjacent peaks must be cleanly
separated. Arbitrarily, the valley between two such
peaks should not be more than 10% of the height of
the larger peak. This degree of resolution is termed
"unit" resolution and can be obtained up to a mass of
approximately 3000 Da on readily available "unit resolution" instruments.
Mm
Mn--------------
H
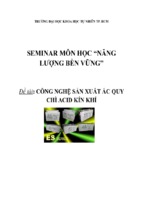
FIGURE 1.2
(:r)100" 10%
To determine the resolution of an instrument, consider
two adjacent peaks of approximately equal intensity. These
peaks should be chosen so that the height of the vaHey
between the peaks is less than 10% of the intensity
of the peaks. The resolution (R) is R M,/(Mn Mill),
where Mn is the higher mass number of the two adjacent
peaks. and Mm is the lower mass number.
There are two important categories of mass
spectrometers: low (unit) resolution and high resolution.
Low-resolution instruments can be defined arbitrarily
as the instruments that separate unit masses up to mlz
3000 [R = 3000/(3000 - 2999) = 3000]. A high-resolution
instrument (e.g., R 20,000) can distinguish between
CI6H2602 and ClsH24N02 [R 250.1933/(250.1933
250.1807) = 19857]. This important class of mass
spectrometers, which can have R as large as 100,000,
can measure the mass of an ion with sufficient accuracy to' determine its atomic composition (molecular
formula).
All mass spectrometers share common features.
(See Figure 1.2) Some sort of chromatography usually
accomplishes introduction of the sample into the mass
spectrometer, although many instruments also allow
for direct insertion of the sample into the ionization
chamber. All mass spectrometers have methods for
ionizing the sample and for separating the ions on the
basis of mlz. These methods are discussed in detail
below. Once separated, the ions must be detected and
quantified. A typical ion collector consists of collimating slits that direct only one set of ions at a time into
the collector, where they are detected and amplified by
an electron multiplier. The method of ion detection is
dependent to some extent on the method of ion
separation.
Nearly all mass spectrometers today are interfaced
with a computer. Typically, the computer controls the
operation of the instrument including any chromatography, collects and stores the data, and provides either
graphical output (essentially a bar graph) or tabular
lists of the spectra.
Block diagram of features of a typical mass spectrometer.
1.3 IONIZATION METHODS
1.3
IONIZATION METHODS
The large number of ionization methods, some of
which are highly specialized, precludes complete coverage. The most common ones in the three general areas
of gas-phase, desorption, and evaporative ionization
are described below.
1.3.1
Gas-Phase Ionization Methods
Gas-phase methods for generating ions for mass spectrometry are the oldest and most popular methods. They
are applicable to compounds that have a minimum vapor
pressure of ca. 10- 6 Torr at a temperature at which the
compound is stable; this criterion applies to a large
number of nonionic organic molecules with MW < 1000.
1.3. 1. 1 ElectTon Impact Ionization.
Electron
impact (EI) is the most widely used method for generating ions for mass spectrometry. Vapor phase sample
molecules are bombarded with high-energy electrons
(generally 70 e V), which eject an electron from a
sample molecule to produce a radical cation, known as
the molecular ion. Because the ionization potential of
typical organic compounds is generally less than 15 e V,
the bombarding electrons impart 50 e V (or more) of
excess energy to the newly created molecular ion,
which is dissipated in part by the breaking of covalent
bonds, which have bond strengths between 3 and 10 e V.
Bond breaking is usually extensive and critically,
highly reproducible, and characteristic of the
compound. Furthermore, this fragmentation process
is also "predictable" and is the source of the powerful
structure elucidation potential of mass spectrometry.
Often, the excess energy imparted to the molecular
ion is too great, which leads to a mass spectrum with
no discernible molecular ion. Reduction of the ionization voltage is a commonly used strategy to obtain
a molecular ion; the strategy is often successful
because there is greatly reduced fragmentation. The
disadvantage of this strategy is that the spectrum
changes and cannot be compared to "standard" literature spectra.
To many, mass spectrometry is synonymous with
EI mass spectrometry. This view is understandable for
two reasons. First, historically, EI was universally available before other ionization methods were developed.
Much of the early work was EI mass spectrometry.
Second, the major libraries and databases of mass spectral data, which are relied upon so heavily and cited so
often, are of EI mass spectra. Some of the readily
accesible databases contain EI mass spectra of over
390,000 compounds and they are easily searched by
efficient computer algorithms. The uniqueness of the
EI mass spectrum for a given organic compound, even
for stereoisomers, is an almost certainty. This uniqueness, coupled with the great sensitivity of the method, is
3
what makes GC-MS such a powerful and popular
analytical tool.
1.3. 1.2 Chemical Ionization. Electron impact
ionization often leads to such extensive fragmentation
that no molecular ion is observed. One way to avoid this
problem is to use "soft ionization" techniques, of which
chemical ionization (CI) is the most important. In CI,
sample molecules (in the vapor phase) are not SUbjected
to bombardment by high energy electrons. Reagent gas
(usually methane, isobutane, ammonia, but others are
used) is introduced into the source, and ionized. Sample
molecules collide with ionized reagent gas molecules
(CHs +, C4H 9 , etc) in the relatively high-pressure CI
source, and undergo secondary ionization by proton
transfer producing an [M + 1 ion, by electrophilic
addition producing [M + 15]+, [M + 24]+, [M + 43]+, or
[M + 18]' (with NH/) ions, or by charge exchange
(rare) producing a [M]+ ion. Chemical ionization spectra
sometimes have prominent [M - 1]+ ions because of
hydride abstraction. The ions thus produced are even
electron species. The excess energy transfered to the
sample molecules during the ionization phase is small,
generally less than 5 e V, so much less fragmentation
takes place. There are several important consequences.
the most valuable of which are an abundance of molecular ions and greater sensitity because the total ion
current is concentrated into a few ions. 'There is
however, less information on structure. The quasimolecular ions are usually quite stable and they are readily
detected. Oftentimes there are only one or two fragment
ions produced and sometimes there are none.
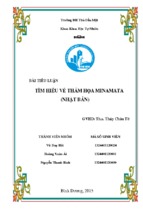
For example, the EI mass spectrum of 3, 4-dimethoxyacetophenone (Figure 1.3) shows, in addition to
the molecular ion at mlz 180, numerous fragment peaks
in the range of mlz 15 167; these include the base peak
at mlz 165 and prominent peaks at mlz 137 and mlz 77.
The CI mass spectrum (methane, C~, as reagent gas)
shows the quasimolecular ion ([M + 1]+. mlz 181) as the
base peak (100%), and virtually the only other peaks,
each of just a few percent intensity, are the molecular
ion peak. mlz 180, mlz 209 ([M + 29] + or M + C2HS +).
and mlz 221 ([M + 41]+ or M + C3HS +). These last two
peaks are a result of electrophilic addition of car bocalions and are very useful in indentifing the molecular
ion. The excess methane carrier gas is ionized by electron impact to the primary ions CH 4 and CH/. These
react with the excess methane to give secondary ions.
r
CH3 + + CH4
~
CH 4 + C2H S+
~
The energy content of the various secondary ions
(from, respectively, methane, isobutane. and ammonia)
decrease in the order: CHs+ > t-C 4H q > NH 4 -. Thus,
4
CHAPTER 1 MASS SPECTROMETRY
;j-\
H3 CO- {
!
/P
\-\
CH
)=J
3
H3CO
3, 4-Dimethoxy acetophenone
C lOH 120 3
Mol. Wt.: 180
o
50
100
50
100
CI Reagent Gas Methane
mlz
150
200
150
200
100
50
o
FIGURE 1.3
mlz
1be EI and CI mass spectra of 3,4-dimethoxyacetophenone.
by choice of reagent gas, we can control the tendency
of the CI produced [M + 1]+ ion to fragment. For
example, when methane is the reagent gas, dioctyl
phthalate shows its [M + 1]+ peak (mlz 391) as the
base peak; more importantly, the fragment peaks (e.g.,
mlz 113 and 149) are 30-60% of the intensity of the
base beak. When isobutane is used, the [M + 1] peak
is still large, while the fragment peaks are only roughly
5% as intense as the [M + 1]+ peak.
Chemical ionization mass spectrometry is not useful
for peak matching (either manually or by computer) nor
is it particularly useful for structure elucidation; its main
use is for the detection of molecular ions and hence
molecular weights.
1.3.2
Desorption Ionization Methods
Desorption ionization methods are those techniques in
which sample molecules are emitted directly from a condensed phase into the vapor phase as ions. The primary
use is for large, nonvolatile, or ionic compounds. There
can be significant disadvantages. Desorption methods
generally do not use available sample efficiently. Oftentimes, the information content is limited. For unknown
compounds, the methods are used primarily to provide
molecular weight, and in some cases to obtain an exact
mass. However, even for this purpose, it should be used
with caution because the molecular ion or the quasimolecular ion may not be evident. The resulting spectra are
often complicated by abundant matrix ions.
1.3.2.1 Field Desorption Ionization. In the
field desorption (FD) method, the sample is applied to a
metal emitter on the surface of which is found carbon
microneedles. The microneedles activate the surface,
which is maintained at the accelerating voltage and functions as the anode. Very high voltage gradients at the tips
of the needles remove an electron from the sample, and
the resulting cation is repelled away from the emitter.
The ions generated have little excess energy so there is
minimal fragmentation, i.e., the molecular ion is usually
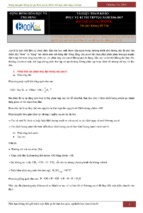
the only significant ion seen. For example with
cholesten-5-ene-3,16,22,26-tetrol the EI and CI do not
see a molecular ion for this steroid. However, the FD
mass spectrum (Figure 1.4) shows predominately the
molecular ion with virtually no fragmentation.
Field desorption was eclipsed by the advent of
FAB (next section). Despite the fact that the method is
often more useful than FAB for nonpolar compounds
and does not suffer from the high level of background
ions that are found in matrix-assisted desorption methods, it has not become as popular as FAB probably
because the commercial manufacturers have strongly
supported FAB.
1.3.2.2 Fast Atom Bombardment Ionization.
Fast atom bombardment (FAB) uses high-energy
xenon or argon atoms (6-10 keV) to bombard samples
dissolved in a liquid of low vapor pressure (e.g., glycerol). The matrix protects the sample from excessive
radiation damage. A related method, liquid secondary
1.3 IONIZATION METHODS
5
EI
991
.;.:
c:l
~
100
...
'"c:l
'S
00
*
551
441
50
0
50
82
1
100
150
250
200 mlz
300
400
350
CI reagent gas Iso butane
I
.;.:
c:l
~
991
100
399
283
2711 1
...
'"c:l
1
00
'5
*
255
50
o
50
100
150
200
381
1
250
300
350
r417
1
400
mlz
FD (18 MA)
OH
434
CH3
M+/
CH2
I
OH
ChoIest-5-ene-3.16.22,26-tetrol
Cn H46 0 4
Mol. wt.: 434
HO
o
50
100
1
150
200
250
300
350
400
mlz
FIGURE 1.4 The electron impact (EI), chemical ionization (el), and field desorption (FD) mass spectra of
cholest-5-ene-3, 16, 22, 26-tetrol.
ionization mass spectrometry, LSIMS, is similar except
that it uses somewhat more energetic cesium ions
(10-30 keY).
In both methods, positive ions (by cation attachment ([M + 1]+ or [M + 23, Na]+) and negative ions
(by deprotonation [M - 1]+) are formed; both types of
ions are usually singly charged and, depending on the
instrument, FAB can be used in high-resolution mode.
FAB is used primarily with large nonvolatile molecules, particularly to determine molecular weight. For
most classes of compounds, the rest of the spectrum is
less useful, partially because the lower mass ranges
may be composed of ions produced by the matrix
itself. However, for certain classes of compounds that
are composed of "building blocks," such as polysaccharides and peptides, some structural information may
be obtained because fragmentation usually occurs at
the glycosidic and peptide bonds, respectively, thereby
affording a method of sequencing these classes of
compounds.
The upper mass limit for FAB (and LSIMS) ionization is between 10 and 20 kDa, and FAB is really most
useful up to about 6 kDa. FAB is seen most often with
double focusing magnetic sector instruments where it
has a resolution of about 0.3 mlz over the entire mass
range; FAB can, however, be used with most types of
mass analyzers. The biggest drawback to using FAB is
that the spectrum always shows a high level of matrix
generated ions, which limit sensitivity and which may
obscure important fragment ions.
1.3.2.3 Plasma Desorption Ionization. Plasma
desorption ionization is a highly specialized technique
used almost exclusively with a time of flight mass
6
CHAPTER 1 MASS SPECTROMETRY
analyzer (Section 1.4.4). The fission products from
Californium 252 (mCf), with energies in the range of
80-100 Me V, are used to bombard and ionize the sample.
Each time a
splits, two particles are produced
moving in opposite directions. One of the particles hits
a triggering detector and signals a start time. The other
particle strikes the sample matrix ejecting some
sample ions into a time of flight mass spectrometer
(TOF-MS). The sample ions are most often released as
singly, doubly, or triply protonated moieties. These ions
are of fairly low energy so that structurally useful
fragmentation is rarely observed and, for polysaccharides
and polypeptides, sequencing information is not available. The mass accuracy of the method is limited by the
time of flight mass spectrometer. The technique is useful
on compounds with molecular weights up to at least
45 kDa.
1.3.2.4 Laser Desorption Ionization. A pulsed
laser beam can be used to ionize samples for mass
spectrometry. Because this method of ionization is
pulsed, it must be used with either a time of flight or a
Fourier transform mass spectrometer (Section 1.4.5). Two
types of lasers have found widespread use: A CO 2 laser,
which emits radiation in the far infrared region, and
a frequency-quadrupled neodymiumlyttriumaluminumgarnet (NdfYAG) Jaser, which emits radiation in the
UV region at 266 nm. Without matrix assistance, the
method is limited to low molecular weight molecules
«2 kDa).
The power of the method is greatly enhanced by
using matrix assistance (matrix assisted laser
desorption ionization, or MALDI). Two matrix materials, nicotinic acid and sinapinic acid. which have
absorption bands coinciding with the laser employed,
have found widespread use and sample molecular
weights of up to two to three hundred thousand Da
have been successfully analyzed. A few picomoles of
sample are mixed with the matrix compound fol-
lowed by pulsed irradiation, which causes sample ions
(usually singly charged monomers but occasionally
multiply charged ions and dimers have been
observed) to be ejected from the matrix into the mass
spectrometer.
The ions have little excess energy and show little
propensity to fragment. For this reason, the method is
fairly useful for mixtures. The mass accuracy is low when
used with a TOF-MS. but very high resolution can be
obtained with a Fr-MS. As with other matrix-assisted
methods, MALDI suffers from background interference
from the matrix material, which is further exacerbated by
matrix adduction. Thus, the assignment of a molecular
ion of an unknown compound can be uncertain.
1.3.3
Evaporative Ionization Methods
There are two important methods in which ions or, less
often, neutral compounds in solution (often containing
formic acid) have their solvent molecules stripped by
evaporation, with simultaneous ionization leaving
behind the ions for mass analysis. Coupled with liquid
chromatography instrumentation, these methods have
become immensely popular.
1.3.3.1 Thermospray Mass Spectrometry. In
the thermospray method, a solution of the sample is
introduced into the mass spectrometer by means of
a heated capillary tube. The tube nebulizes and partially
vaporizes the solvent forming a stream of fine droplets,
which enter the ion source. When the solvent completely
evaporates, the sample ions can be mass analyzed. This
method can handle high flow rates and buffers; it was an
early solution to interfacing mass spectrometers with
aqueous liquid chromatography. The method has largely
been supplanted by electrospray.
1.3.3.2 Electrospray Mass Spectrometry.
The electrospray (ES) ion source (Figure 1.5) is operated at or near atmospheric pressure and, thus is also
called atmospheric pressure ionization or API. The
ESI Spray Droplets with
Excess Charge on SUrfaCe
Nebulizer gas §~§§~~~§§~~~
Nebulizer needl-.J
Solvent/sample
Nebulizer gas l~~~~§§~~§~>~~~~~
~
v
FIGURE 1,5
instrument.
~wO
- Xem thêm -