Những bài văn mẫu đạt điểm 9 task 1 & Task 2
Kiểm tra trình độ IELTS Online
IELTS TEST NOW is a website that provides
authentic IELTS test through an online
platform. Established and supervised by the
Admin team who are IELTS high achievers (8.59.0), IELTS TEST NOW presents not only trusted
self-study materials such as IELTS Cambridge 1
– 11, IELTS Recent Actual Tests (Listening,
Reading, Writing), IELTS Simulation Test… but
also exclusive tests of 4 skills composed by the
Admin team and IELTS ex-examiners.
Website:
http://ieltstestnow.com
With the hope to bring useful studying
resources to IELTS learners, we will
continuously update latest news and resources
about IELTS.
Like and Follow our fanpage to be kept up-todate with news from IELTS TEST NOW !
Mục lục
IELTS WRITING TASK 1…………………………………………………………………………………………….. 1
IELTS WRITING TASK 2…………………………………………………………………………………………….. 61
Kiểm tra trình độ IELTS Online
TASK 1
Kiểm tra trình độ IELTS Online
1
Kiểm tra trình độ IELTS Online
Some advice to help you avoid common mistakes in IELTS writing
task 1:
1. Don't copy the question for your introduction. You
should paraphrase the question (i.e. rewrite it using some
different words).
2. Don't forget to separate your paragraphs clearly.
3. Don't forget to write a good summary/overview of the information.
A quick one-sentence conclusion is not good enough. I prefer
to put the overview straight after the introduction, and I try to
write 2 sentences describing the information in general. You
won't get a high score if you don't write a good overview.
4. Don't describe items separately (e.g. 2 lines on a graph). You
should always try to compare things if it is possible to do so.
Instead of describing 2 lines separately, compare the 2 lines at
key points.
5. Don't try to describe every number on a chart or graph (unless
there are only a few numbers). A key skill in task 1 is being able
to select the key information and describe or compare it well. I
usually mention around 6 or 7 numbers in my main paragraphs.
6. Don't spend longer than 20 minutes on task 1. Practise spending
5 minutes on each of your 4 paragraphs. Stop yourself after 20
minutes; remember that task 2 is worth more marks.
Kiểm tra trình độ IELTS Online
2
Kiểm tra trình độ IELTS Online
The overview / summary is a very important part of your task 1 report.
Many people have no trouble describing specific details, but they find it
difficult to describe the general features of a graph, chart or diagram. So
here are my tips on how to write a good overview:
1. Always try to write two sentences. This forces you to
describe two main or general features of the graph, chart or
diagram.
2. Don't put any numbers in your overview. Save specific numbers
for the 'details' paragraphs.
3. If the graph or chart shows a time period (e.g. years), look for the
overall change from the beginning to the end of the period (e.g.
from the first year to the last year).
4. Look for overall trends, and ignore individual figures that don't fit
the trend. For example, if a graph shows a rising trend overall,
you can ignore a specific year when the figures decreased save that year for your 'details' paragraphs.
5. If no time period is shown, you can't look for trends. Instead, look
for differences and similarities between items.
6. Don't look for individual 'highest' or 'lowest' figures such as a
'peak' on a line graph. Instead, describe the highest and lowest
items overall (e.g. which line on the graph was the highest for
the whole or most of the period?).
7. Start your overview with a simple phrase that clearly shows the
examiner that this is your summary paragraph e.g. It is clear
that... , It is noticeable that... , Overall we can see that...
8. If there are two different charts, write one overview sentence
about each chart.
9. If there are more than two charts, they must be connected in
some way, so look for two main features overall.
10. If the task is to describe a diagram or map that compares things,
you can mention the main differences and maybe the number
of differences and / or similarities between the two diagrams.
11. If the task is to describe a process diagram, you can mention
the total number of stages in the process and say where or how
the process begins and ends.
Kiểm tra trình độ IELTS Online
3
Kiểm tra trình độ IELTS Online
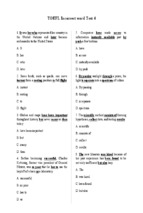
The first chart below gives information about the money spent by
British parents on their children’s sports between 2008 and 2014.
The second chart shows the number of children who participated in
three sports in Britain over the same time period.
Here's my full answer:
The line graphs show the average monthly amount that parents in Britain
spent on their children’s sporting activities and the number of British
children who took part in three different sports from 2008 to 2014.
It is clear that parents spent more money each year on their children’s
participation in sports over the six-year period. In terms of the number of
children taking part, football was significantly more popular than athletics
and swimming.
In 2008, British parents spent an average of around £20 per month on
their children’s sporting activities. Parents’ spending on children’s sports
increased gradually over the following six years, and by 2014 the average
monthly amount had risen to just over £30.
Looking at participation numbers, in 2008 approximately 8 million British
children played football, while only 2 million children were enrolled in
swimming clubs and less than 1 million practised athletics. The figures
Kiểm tra trình độ IELTS Online
4
Kiểm tra trình độ IELTS Online
for football participation remained relatively stable over the following 6
years. By contrast, participation in swimming almost doubled, to nearly 4
million children, and there was a near fivefold increase in the number of
children doing athletics.
(185 words, band 9)
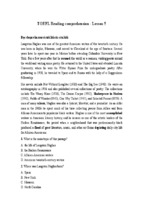
The diagram below shows the life cycle of a salmon, from egg to
adult fish.
...
The diagram illustrates the stages in the life of the salmon, from birth to
maturity.
It is clear that there are six* main stages as the salmon develops from
egg to mature adult. We can also see that salmon spend time in three
distinct locations during the cycle, moving from river to estuary to ocean
and then back upstream.
Salmon begin their lives in rivers where the adult fish lay and incubate
their eggs. After emerging from eggs, the young salmon spend the next
stage of their lives being reared in freshwater areas. Then, at some point
in their development, the fish swim downstream to river estuaries where
rearing continues.
Kiểm tra trình độ IELTS Online
5
Kiểm tra trình độ IELTS Online
Following the estuary rearing period, the maturing salmon migrate to the
ocean, where they eventually become fully grown adults. Finally, the
adult fish travel back upstream to spawning areas of rivers; here they
reproduce and lay their eggs, and the life cycle begins anew.
(154 words, band 9)
* I wrote "six" main stages because these are the stages that I describe
in paragraphs 3 and 4.
Kiểm tra trình độ IELTS Online
6
Kiểm tra trình độ IELTS Online
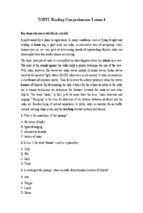
The chart below shows the results of a survey of people who visited
four types of tourist attraction in Britain in the year 1999.
...
...
The pie chart compares figures for visitors to four categories of tourist
attraction and to five different theme parks in Britain in 1999.
It is clear that theme parks and museums / galleries were the two most
popular types of tourist attraction in that year. Blackpool Pleasure Beach
received by far the highest proportion of visitors in the theme park sector.
Looking at the information in more detail, we can see that 38% of the
surveyed visitors went to a theme park, and 37% of them went to a
museum or gallery. By contrast, historic houses and monuments were
visited by only 16% of the sample, while wildlife parks and zoos were the
least popular of the four types of tourist attraction, with only 9% of visitors.
In the theme park sector, almost half of the people surveyed (47%) had
been to Blackpool Pleasure Beach. Alton Towers was the second most
popular amusement park, with 17% of the sample, followed by
Pleasureland in Southport, with 16%. Finally, Chessington World of
Adventures and Legoland Windsor had each welcomed 10% of the
surveyed visitors.
(181 words, band 9)
Kiểm tra trình độ IELTS Online
7
Kiểm tra trình độ IELTS Online
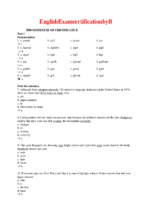
The graph below shows the amounts of waste produced by three
companies over a period of 15 years.
The line graph compares three companies in terms of their waste output
between the years 2000 and 2015.
It is clear that there were significant changes in the amounts of waste
produced by all three companies shown on the graph. While companies
A and B saw waste output fall over the 15-year period, the amount of
waste produced by company C increased considerably.
In 2000, company A produced 12 tonnes of waste, while companies B
and C produced around 8 tonnes and 4 tonnes of waste material
respectively. Over the following 5 years, the waste output of companies
B and C rose by around 2 tonnes, but the figure for company A fell by
approximately 1 tonne.
From 2005 to 2015, company A cut waste production by roughly 3
tonnes, and company B reduced its waste by around 7 tonnes. By
contrast, company C saw an increase in waste production of
approximately 4 tonnes over the same 10-year period. By 2015, company
C’s waste output had risen to 10 tonnes, while the respective amounts of
waste from companies A and B had dropped to 8 tonnes and only 3
tonnes.
(192 words, band 9)
Kiểm tra trình độ IELTS Online
8
Kiểm tra trình độ IELTS Online
The tables below give information about sales of Fairtrade*-labelled
coffee and bananas in 1999 and 2004 in five European countries.
*Fairtrade: a category of products for which farmers from developing
countries have been paid an officially agreed fair price.
The tables show the amount of money spent on Fairtrade coffee and
bananas in two separate years in the UK, Switzerland, Denmark, Belgium
and Sweden.
It is clear that sales of Fairtrade coffee rose in all five European countries
from 1999 to 2004, but sales of Fairtrade bananas only went up in three
out of the five countries. Overall, the UK saw by far the highest levels of
spending on the two products.
In 1999, Switzerland had the highest sales of Fairtrade coffee, at €3
million, while revenue from Fairtrade bananas was highest in the UK, at
€15 million. By 2004, however, sales of Fairtrade coffee in the UK had
risen to €20 million, and this was over three times higher than
Switzerland’s sales figure for Fairtrade coffee in that year. The year 2004
also saw dramatic increases in the money spent on Fairtrade bananas in
the UK and Switzerland, with revenues rising by €32 million and €4.5
million respectively.
Sales of the two Fairtrade products were far lower in Denmark, Belgium
and Sweden. Small increases in sales of Fairtrade coffee can be seen,
but revenue remained at €2 million or below in all three countries in both
years. Finally, it is noticeable that the money spent on Fairtrade bananas
actually fell in Belgium and Sweden.
Kiểm tra trình độ IELTS Online
9
Kiểm tra trình độ IELTS Online
Note:
This report is a bit longer (216 words) than necessary, but I think it's a
useful model answer in terms of its structure and the language used.
The diagrams below show the site of a school in 2004 and the plan
for changes to the school site in 2024.
(Source: Official IELTS Practice Materials 2)
The two pictures compare the layout of a school as it was in the year
2004 with a proposed site design for the year 2024.
It is clear that the main change for 2024 involves the addition of a new
school building. The school will then be able to accommodate a
considerably larger number of students.
In 2004, there were 600 pupils attending the school, and the two school
buildings were separated by a path running from the main entrance to the
sports field. By 2024, it is expected that there will be 1000 pupils, and a
third building will have been constructed. Furthermore, the plan is to join
Kiểm tra trình độ IELTS Online
10
Kiểm tra trình độ IELTS Online
the two original buildings together, creating a shorter path that links the
buildings only.
As the third building and a second car park will be built on the site of the
original sports field, a new, smaller sports field will need to be laid. A new
road will also be built from the main entrance to the second car park.
Finally, no changes will be made to the main entrance and original car
park.
(183 words, band 9)
Kiểm tra trình độ IELTS Online
11
Kiểm tra trình độ IELTS Online
The charts below show the results of a questionnaire that asked
visitors to the Parkway Hotel how they rated the hotel's customer
service. The same questionnaire was given to 100 guests in the
years 2005 and 2010.
The pie charts compare visitors’ responses to a survey about customer
service at the Parkway Hotel in 2005 and in 2010.
It is clear that overall customer satisfaction increased considerably from
2005 to 2010. While most hotel guests rated customer service as
satisfactory or poor in 2005, a clear majority described the hotel’s service
as good or excellent in 2010.
Looking at the positive responses first, in 2005 only 5% of the hotel’s
visitors rated its customer service as excellent, but this figure rose to 28%
in 2010. Furthermore, while only 14% of guests described customer
service in the hotel as good in 2005, almost three times as many people
gave this rating five years later.
With regard to negative feedback, the proportion of guests who
considered the hotel’s customer service to be poor fell from 21% in 2005
to only 12% in 2010. Similarly, the proportion of people who thought
customer service was very poor dropped from 15% to only 4% over the
5-year period. Finally, a fall in the number of ‘satisfactory’ ratings in 2010
reflects the fact that more people gave positive responses to the survey
in that year.
(193 words, band 9)
Kiểm tra trình độ IELTS Online
12
Kiểm tra trình độ IELTS Online
The pie charts below compare water usage in San Diego, California
and
the
rest
of
the
world.
mm
mm
The pie charts give information about the water used for residential,
industrial and agricultural purposes in San Diego County, California, and
the world as a whole.
It is noticeable that more water is consumed by homes than by industry
or agriculture in the two American regions. By contrast, agriculture
accounts for the vast majority of water used worldwide.
In San Diego County and California State, residential water consumption
accounts for 60% and 39% of total water usage. By contrast, a mere 8%
of the water used globally goes to homes. The opposite trend can be
seen when we look at water consumption for agriculture. This accounts
for a massive 69% of global water use, but only 17% and 28% of water
usage in San Diego and California respectively.
Such dramatic differences are not seen when we compare the figures for
industrial water use. The same proportion of water (23%) is used by
industry in San Diego and worldwide, while the figure for California is 10%
higher, at 33%.
(168 words, band 9)
Kiểm tra trình độ IELTS Online
13
Kiểm tra trình độ IELTS Online
The chart below shows the amount of time that 10 to 15-year-olds
spend chatting on the Internet and playing on games consoles on
an
average
school
day
in
the
UK.
...
The bar chart compares the time spent by 10 to 15-year-olds in the UK
on two activities, namely chatting online and playing computer games.
Overall, we can see that playing computer games is marginally more
popular than chatting on the Internet. However, completely different
trends can be seen if we look at the specific figures for boys and girls.
Boys aged between 10 and 15 clearly favour playing on games consoles
over chatting online. According to the chart, while 85% of boys play
computer games every day, only 55% chat online daily. Furthermore, the
majority of boys play on their consoles for more than one hour each day,
and 10% do this activity for four hours or more.
By contrast, girls prefer chatting online. Close to 70% of 10 to 15-yearold girls engage in online conversation each day, compared to about 50%
of this cohort who play computer games. Of the girls who do play on
consoles, most of them play for less than an hour, whereas most girls
who chat online do so for more than one hour, and nearly 10% chat for
four hours or more.
Note:
I decided to write about boys in one paragraph and girls in the other.
However, it would also be fine to write paragraphs about chatting on the
Internet and playing on consoles.
Kiểm tra trình độ IELTS Online
14
Kiểm tra trình độ IELTS Online
The line graph compares the percentage of people in three countries who
used the Internet between 1999 and 2009.
It is clear that the proportion of the population who used the Internet
increased in each country over the period shown. Overall, a much larger
percentage of Canadians and Americans had access to the Internet in
comparison with Mexicans, and Canada experienced the fastest growth
in Internet usage.
In 1999, the proportion of people using the Internet in the USA was about
20%. The figures for Canada and Mexico were lower, at about 10% and
5% respectively. In 2005, Internet usage in both the USA and Canada
rose to around 70% of the population, while the figure for Mexico reached
just over 25%.
By 2009, the percentage of Internet users was highest in Canada. Almost
100% of Canadians used the Internet, compared to about 80% of
Americans and only 40% of Mexicans.
Kiểm tra trình độ IELTS Online
15
Kiểm tra trình độ IELTS Online
The following bar chart has a total of 24 bars. It's impossible to describe
24 pieces of information in only 20 minutes, so you need to select.
A simple rule is to select at least one key thing about each country. Here
are some examples:
Britain: highest spending on all 6 products, give the figure for
photographic
film.
France: second highest for 3 products, but lowest for the other 3.
Italy: Italians spent more money on toys than on any other product.
Germany: lowest spending overall, similar figures for all 6 products.
The bar chart compares consumer spending on six different items in
Germany, Italy, France and Britain.
It is clear that British people spent significantly more money than people
in the other three countries on all six goods. Of the six items, consumers
spent the most money on photographic film.
People in Britain spent just over £170,000 on photographic film, which is
the highest figure shown on the chart. By contrast, Germans were the
lowest overall spenders, with roughly the same figures (just under
£150,000) for each of the six products.
Kiểm tra trình độ IELTS Online
16
- Xem thêm -