1
ABSTRACTS
In Red River Delta, there are many important economic regions located on the
coastal areas. The growth of both the economy and the population in these areas
during the last decades, which is based on the availability of water resources, and
the extensive exploitation have strongly increased the pressure on this finite and
vulnerable resource. Since surface water is unevenly distributed and increasingly
affected by human activities, groundwater has become the major source of potable
water.
This thesis therefore focused on contributing to the improvement of groundwater
management in RRD by determining groundwater safe yield using modelling
method. Nam Dinh Province was selected to be the study area.
In the northern areas of Nam Dinh Province, due to the the high concentration of
contamination in the groundwater aquifers, surface water is used as the main source
of water for the region. Groundwater usage in these areas is mainly for other
purposes than domestic use. Small scale groundwater extraction can be found near
the main rivers with shallow wells in the uppermost aquifer due to the high level of
contamination. Deeper aquifers are the main subject for extensive extraction in the
province. Significant extractions are found in the south of Nam Dinh, where large
freshwater lens in Pleistocene aquifer are located. Therefore in this thesis, the
Pleistocene aquifer is the main area of interest.
It was decided to use the Visual MODFLOW for the setting up of a numerical
model of the Nam Dinh Area. The 3D hydrogeological structure for the model was
created from strata data of 83 boreholes, including 27 boreholes from Nam Dinh, 15
boreholes from Ha Nam, 17 boreholes from Ninh Binh, 23 boreholes from Thai
Binh and 1 from Thanh Hoa. Natural neighbors method was used to interpolate the
elevation of surface and bottom of the layers.
The 3D structural model was built with 5 layers, representing 4 aquifers and 1
aquitard, including Upper Holocene aquifer (qh2), Lower Holocene aquifer (qh1),
Pleistocene aquitard (qp2), Pleistocene aquifer (qp1) and Neogen aquifer (n) with
2
the order from top to bottom respectively. The finite difference grid used for the
model has the size of 181 x 160 (181 columns x 160 rows, the size of each cell is
approximate 400m x 400m).
Observed water heads from 19 wells were used to calibrate and verify the
model. The normalize root mean squared of the calibrated model is 6.296%, which
is considered to be good enough to simulate the future uses of groundwater for the
study area.
To show the impacts of groundwater utilization on the qp aquifer in Nam Dinh
Province, scenarios of future situations were simulated using the calibrated model.
Extraction rates were extrapolated until 2050 and three versions were considered: 1)
Extraction rises constantly until 2050 in the same manner than from 1994 to 2012;
2) Extraction stays on a 2012 level, which means that no additional water is going
to be extracted; 3) Extraction gradually declines to 0 by 2050.
The simulation results of these scenarios were used to estimate the groundwater
safe yield for Nam Dinh Province. It showed that the safe yield for the area is
estimated to be 70300 m3/day.
3
DECLARATION
I hereby certify that the work which is being presented in this thesis entitled,
“Numerical simulation for the assessment of groundwater safe yield in Red
River Delta, Viet Nam” in partial fulfillment of the requirement for the award of
the Master of Science in Integrated Water Resource Management, is an authentic
record of my own work carried out under supervision of Associate Professor Dr. Vu
Minh Cat and Dr. Bui Du Duong.
The matter embodied in this thesis has not been submitted by me for the award
of any other degrees or diplomas.
Date: 28th November 2014
4
ACKNOWLEDGEMENTS
This thesis was completed at Faculty of Water Resources Engineering, Thuy Loi
University.
First and foremost, I would like to thank my advisor, Assoc. Prof. Dr. Vu Minh
Cat for his invaluable guidance. I am deeply grateful that I had the opportunity to
learn from his knowledge.
I would like to thank Dr. Bui Du Duong for his helpful contribution to the
hydrogeology field and his supervision of my study.
I am very grateful to Assoc. Prof. Dr. Pham Quy Nhan, MSc. Dang Tran Trung
and MSc. Tran Thanh Le for their valuable advices and help with the preparation of
spreadsheet data for the boreholes and well logs.
To Ms. Mariette van Tilburg, I am very thankful for the English corrections,
suggestions for my thesis and for providing me useful writing resources.
Lastly, a word of thanks is extended to NICHE-VNM-106 project team for
providing a 18 months MSc scholarship.
Again, I would like to express my sincere gratitude for all these valuable help!
5
TABLE OF CONTENTS
ABSTRACTS
1
DECLARATION
3
ACKNOWLEDGEMENTS
4
LIST OF ABBREVIATIONS
7
LIST OF FIGURES
8
LIST OF TABLES
11
CHAPTER I – INTRODUCTION
12
1.1. Background information
12
1.2. Objective & scope of study
14
1.3. Previous studies & state of knowledge
15
1.3.1. In the world
15
1.3.2. In Viet Nam
16
1.4. Methodology
18
1.5. Structure of thesis
20
CHAPTER II – CHARACTERISTICS OF NAM DINH PROVINCE
21
2.1. Physical settings of Nam Dinh Province
21
2.1.1. Geographical location
21
2.1.2. Topography
22
2.1.3. Climate conditions
22
2.1.4. Surface water bodies
24
2.1.5. Soils and land use
25
2.1.6. Population & Socio-Economy
26
2.1.7. Water supply and groundwater utilization
26
2.2. Geological characteristics of study area
28
2.2.1. Structural characteristics
28
2.2.2. Stratigraphy characteristics
32
2.3. Hydrogeological characteristics
2.3.1. Hydrogeological units
37
37
6
2.3.2. Groundwater dynamics
39
2.3.3. Groundwater salinity
42
CHAPTER III – CONSTRUCTION OF NUMERICAL MODEL TO ASSESS
GROUNDWATER SAFE YIELD IN NAM DINH PROVINCE
44
3.1. Introduction of MODFLOW model
44
3.2. Model setup
47
3.2.1. Construction of 3D structural model
47
3.2.2. Model parameters
52
3.2.3. Boundaries conditions
54
3.2.4. Groundwater extraction
57
3.3. Model calibration
60
CHAPTER IV – SIMULATED RESULTS AND RECOMMENDATIONS
66
4.1. Scenario simulation
66
4.1.1. Extraction rises constantly
66
4.1.2. Extraction remains constant
67
4.1.3. Extraction gradually reduces
69
4.1.4. Estimation of groundwater safe yield
70
4.2. Discussion of model results
72
CONCLUSIONS AND RECOMMENDATIONS
74
REFERENCES
76
APPENDICES
78
7
LIST OF ABBREVIATIONS
Generral abbreviations
MONRE
Ministry of Natural Resources and Environment
NAWAPI
National Center for Water Resources Planning and
Investigation
NDWRPI
Northern Division of the National Center for Water Resources
Planning and Investigation
N, S, E, W
North, South, East, West
RRD
Red River Delta
UNICEF
United Nations International Children’s Emergency Fund
Technical abbraviations
m bgl
Meter below ground level
m asl
Meter above modern sea level
TDS
Total dissolved solids (mg/L)
8
LIST OF FIGURES
Figure 1.1: Steps of study.............................................................................................19
Figure 2.1: The outline map of Nam Dinh Province ......................................................21
Figure 2.2: Monthly averaged data for temperature, precipitation and potential evaporation
in period from 1959 to 2007, measured at Van Ly station, coastal area of Nam Dinh ......23
Figure 2.3: Land use distribution in Nam Dinh province, status 2007. ............................25
Figure 2.4: Bar chart showing official data for communal and private water supply (ws) in
Nam Dinh from 2005 to 2009 ......................................................................................27
Figure 2.5: Quaternary geology and topography of the Red River delta and adjacent
areas (Source: Tanabe et al. 2006) ............................................................................29
Figure 2.6: Geological Sketch map including major structural features and basis
boundaries of the Holocene, Pleistocene and Neogene sediments (Source: NAWAPI) ....30
Figure 2.7: Sketch map showing location (orange line) of typical hydrogeological
cross section of Nam Dinh Province .........................................................................31
Figure 2.8: Cross section from Vu Ban to Hai Hau (140x vertical exaggeration,
modified after Hoc et al., 2003) ................................................................................31
Figure 2.9: Time-series of monthly averaged Groundwater level of Holocene (qh),
Pleistocene (qp) and Neogene (n) aquifers. ...................................................................41
Figure 2.10: Contour map of the hydraulic groundwater heads (m asl) in Pleistocene (qp1)
aquifer in the Nam Dinh province in May 2010 (left) and November 2010 (right) (Source:
NDWRPI)...................................................................................................................41
Figure 2.11: Salinity distribution map (TDS) in qp pore water. ...............................43
Figure 3.1: Three-dimensional finite difference grid used in MODFLOW ......................45
Figure 3.2: Sketch map showing locations of boreholes used to construct the 3D
structural model .........................................................................................................48
Figure 3.3: Finite difference grid and extent border of the model ............................48
Figure 3.4: 3D hydrogeological structure of Nam Dinh Province ............................49
9
Figure 3.5: Sketch map showing bottom elevation contours of 5 layers: a) Upper
Holocene aquifer, b) Lower Holocene aquifer, c) Pleistocene aquitard, d)
Pleistocene aquifer, e) Neogen aquifer .....................................................................52
Figure 3.6: Hydraulic conductivity (m/day) for each aquifer: a) Upper Holocene, b)
Lower Holocene, c) Upper Pleistocene, d) Lower Pleistocene, e) Neogene ............53
Figure 3.7: Distribution of artificial well locations in study area .............................58
Figure 3.8: Estimated groundwater withdrawal rate from 1994 to 2009 in Nam Dinh
Province .....................................................................................................................59
Figure 3.9: Sketch map showing the locations of groundwater monitoring wells in
Nam Dinh Province ...................................................................................................61
Figure 3.10: Calculated versus measured water heads in Q108, 109 and 110..........62
Figure 3.11: Best fit simulation water level contour in qp aquifer (December 2012)
...................................................................................................................................63
Figure 3.12: Calibration residuals histogram ............................................................63
Figure 3.13: Calculated versus measured water heads in Q221-Q229 from 2010 to
2012 ...........................................................................................................................64
Figure 3.14: Scattered plot showing the relation between calculated and observed
head ...........................................................................................................................65
Figure 4.1: Estimated groundwater level until 2050 at Q109 with a constant rise of
extraction as postulated until 2012 ............................................................................66
Figure 4.2: Sketch map showing the groundwater level contour in qp aquifer in
December 2050 with a constant rise of extraction as postulated until 2012 .............67
Figure 4.3: Estimated groundwater level until 2050 at Q109 with a constant level of
extraction as in 2012 .................................................................................................68
Figure 4.4: Sketch map showing the groundwater level contour in qp aquifer in
December 2050 with a constant level of extraction as 2012 ....................................68
Figure 4.5: Estimated groundwater level until 2050 at Q109 with a constant decline
of extraction...............................................................................................................69
10
Figure 4.6: Sketch map showing the groundwater level contour in qp aquifer in
December 2050 with a constant decline of extraction ..............................................70
Figure 4.7: Estimated groundwater level until 2050 at Q109 in different scenario ..72
11
LIST OF TABLES
Table 2.1: Stratigraphy and Hydrostratigraphy of the strata in the Nam Dinh area. 32
Table 3.1: Amount of water wells in Nam Dinh in 1999 and 2009 ..........................57
Table 3.2: Table for statistic parameters of calibrated model result .........................65
Table 4.1: Estimated safe pumping rate in Nam Dinh Province ...............................71
12
CHAPTER I – INTRODUCTION
1.1.
Background information
In Red River Delta, there are many important economic regions located on the
coastal areas. The growth of both the economy and the population in these areas
during the last decades, which is based on the availability of water resources, and
the extensive exploitation have strongly increased the pressure on this finite and
vulnerable resource. Since surface water is unevenly distributed and increasingly
affected by human activities, groundwater has become the major source of potable
water [1].
Understanding and quantifying groundwater resources, especially in coastal
areas, is a very complex and difficult task, considerably more problematic and
uncertain than surface water hydrology. Various studies have been conducted using
different types of models, including empirical, probabilistic and deterministic
models. Since empirical models are limited in scope and probabilistic models
require large data sets and cannot be used to solve many problems in practice (e.g.,
effects of a future pumping)
[11]
, numerical deterministic models are increasingly
applied, especially within GIS environments. However, in contrast to the developed
countries (e.g., Europe, Australia, Japan, and North America), where a vast majority
of projects have been carried out due to the availability of a wide range of
information and where technical and financial resources are available
[12]
, few
projects have been in Viet Nam with very limited results. This has led to an
inadequate understanding of the aquifer system characteristics as well as to unwise
groundwater management in Viet Nam, especially in RRD.
This thesis therefore focused on contributing to the improvement of groundwater
management in RRD by determining groundwater safe yield using modelling
method. However, within the limited time, it is not feasible to construct the model
for the whole Delta. In this study, Nam Dinh Province was selected to be the case
study. There are 3 reasons for this selection:
13
Nam Dinh province is located in the south of the Red River flood plain. In
general, the physical settings of the province are quite in common with that
of the Red River Delta: 1) Adjacent to the ocean in the SE border; 2) The
SW border is where clastic sediments of the Cenozoic meet the Mesozoic
graben shoulders of the elongated Red River graben; and 3) Agriculture
dominated land use with an extensive system of dykes and canals constructed
to irrigate the paddy fields with river water.
Nam Dinh Province is facing the same groundwater problems with RRD,
including: 1) Continuous declining of groundwater tables on a regional scale;
2) Potential salinization of coastal groundwater resources by seawater
intrusion; 3) Potential pollution by unsuitable handling of domestic,
agricultural and industrial waste, waste water and sewage; and 4) Unwise
management and inadequate understanding of the aquifer system
characteristics leaded to serious problems, such as the drying up of shallow
wells, land subsidence, etc.
Nam Dinh is the province which has the highest groundwater drawdown rate
compare to the other provinces/cities in Red River Delta [14].
(For more details, see Chapter 2)
Nam Dinh Province is principally endowed with a subtropical climate and
abundant surface water resources. However, economic and social developments,
combined with the population growth over the last decades, have strongly increased
pressure on available water resources. Surface water is the traditional water source
and still used in Northern and Eastern areas of Nam Dinh. In South and West of
Nam Dinh deeper groundwater resources has been increasingly exploited for
domestic as well as economic utilization.
Monitoring data since 1995 showed that the groundwater extraction exceeded
the recharge resulting in drawdown of groundwater levels in Pleistocene and
Neogene aquifers up to 0.6 m/year. A regional abstraction cone has developed in
Pleistocene as well as the underlying Neogene aquifer. In this area, the natural
14
coastward directed groundwater flow has turned towards the centre of the
abstraction cone with horizontal apparent velocities of 0.6 m/year. This results in
migration of brackish and saline groundwater from East of Nam Dinh as well as
from the ocean towards the fresh groundwater area. The consequences are that
nowadays hand pumps must be replaced by electric pumps in order to pump the
groundwater to the surface and, thus, increasing the costs for water supply.
Groundwater will be increasingly important for Nam Dinh’s future water supply
strategy, since surface water is vulnerable and increasingly affected by climate
change, untreated sewage water and industrial waste water. Thus, sustainable
groundwater exploitation and management is crucial for life, development and the
environment in Nam Dinh.
1.2.
Objective & scope of study
The overall goal of this thesis is to provide a rough assessment on the safe yield
of groundwater for Nam Dinh Province on the basis of numerical modeling method.
To achieve the overall goal of the research, these following specific objectives have
been addressed:
Clarify the spatial characteristics of groundwater in Nam Dinh.
Investigate the impacts of pumping activities on the flows and hydraulic
heads of groundwater in Nam Dinh.
Roughly estimate the safe groundwater yield for Nam Dinh.
Proposing recommendations to improve groundwater management for the
province by analyzing the simulation results.
In the northern areas of Nam Dinh Province, due to the the high concentration of
contamination in the groundwater aquifers, surface water is used as the main source
of water for the region. Groundwater usage in these areas is mainly for other
purposes than domestic use. Small scale groundwater extraction can be found near
the main rivers with shallow wells in the uppermost aquifer due to the high level of
contamination. Deeper aquifers are the main subject for extensive extraction in the
province. Significant extractions are found in the south of Nam Dinh, where large
15
freshwater lens in Pleistocene aquifer are located. Therefore in this study, the
Pleistocene aquifer was selected as the main area of interest. This study examines
certain groundwater-related items in great details for the whole province, in which,
groundwater pollution and salinization process were not taken into account due to
the limitation of time and collected data. Furthermore, detailed evaluation of
alternative groundwater management strategies was also included in this research.
1.3.
Previous studies & state of knowledge
1.3.1. In the world
Worldwide applying of modelling methods to study the subjects of groundwater
began in the 19th century, especially in industrialized countries like the former
Soviet Union (Russia and others Republic countries now), the US, France, Canada,
Denmark ... History of groundwater modelling can be divided into two stages:
The first stage lasted from the 19th century to the late 50s of the 20th century. At
this stage, modelling method was applied to study the basic seepage problem.
Several laboratories, which studied soil permeability, were formed in the Soviet
Union as VNIIG, VODGEO, MGRI. This stage is characterized by a strong
development of EGDA method (Analogue EGDA), which was developed and used
predict groundwater dynamics, balance of groundwater in irrigated areas in
Davogia, Dovongie, North Keprad, Central Asia, Ukraine.
The second stage extended from the 60s of the 20th century to the present. In
this stage, modelling method was strongly developed and applied to interpret many
complex problems as: Assessment of exploitable reserves of underground water,
Prediction of groundwater dynamics in irrigated areas, etc. Developed countries like
the United States, Russia (former USSR), Denmark, Canada, Australia... have used
numerical models to serve the integrated management of water resources. Countries
in Asia, Southeast Asia have also applied the model to assess and manage water
resources in their territory.
For the last decades, several methodologies for groundwater management and
vulnerability assessment have been developed to deal with groundwater problems.
16
These issues include: groundwater depletion, groundwater contamination, land
subsidence, and seawater intrusion.
Thomsen et al. (2004) presented a highly advanced approach which included
spatially dense geophysical/hydrogeological mapping, dense perforation grids as
well as numerical modelling, GIS and advanced database technology for
groundwater management and protection in Denmark
[17]
. Other advanced
approaches include quantitative aquifer modelling for entire catchment areas using
numerical groundwater flow modelling as a basis for sustainable aquifer
exploitation and vulnerability assessment
[1], [9]
. However, in contrast to the
availability of data in developed countries, the reduced availability of the necessary
input data in developing countries require that a significant part of the basic input
variables has to be estimated. As a result, these approaches lean towards a growing
uncertainty [12].
1.3.2. In Viet Nam
In Vietnam, several studies have dealt with groundwater problems. Minh, (2004)
used weak Galerkin finite element method to simulate the movement of saltwater
wedges into the coastal aquifer in Hoa Khanh, Tien Giang [13]. Postma’s research in
2007 under the Danida Enreca Project provided a set of sources as well as
mitigations for arsenic contamination in the groundwater of the Red River Delta [15].
Nguyen (2011) used finite element modelling for the assessment of seawater
intrusion into the ground aquifer in Thai Binh province. Erban (2013) provided an
extensive study on arsenic releasing into deep groundwater in the Mekong Delta,
which is linked to pumping-induced land subsidence
[8]
. However, there has been
less improvement in groundwater management in Vietnam, since groundwater
problems were still reported to happen in many areas of Vietnam according to
MONRE, 2013 [14].
Previous studies in Nam Dinh Province:
Since the 1990s, groundwater resources in the Red River Delta (RRD) including
Nam Dinh area were subject of mapping and exploration projects carried out by
17
governmental authorities. Moreover, Vietnamese universities have published
several scientific studies about groundwater related issues in Nam Dinh and
upstream areas, partly in cooperation with international partners. The most relevant
studies and information sources are namely:
“Characteristics of geology, natural resources and geochemical environment of
sediment on tidal estuary of Xuan Thuy and Nghia Hung, Ha Nam Province” –
report by staffs at Hanoi University of Mining and Geology, 1995.
"Geological mapping for Nam Dinh area ratio 1:50.000" – project by Division
47 of Hydrogeology – Geology Engineering, 1996. In this project, 27 boreholes
were drilled, including 8 boreholes in Holocene aquifer (qh), 17 boreholes in
Pleistocene aquifer (qp) and 2 boreholes in Neogene aquifer (n). Strata data
collected from the boreholes was used for the mapping process. Slug tests were also
conducted in 26 boreholes to determine the hydrogeological parameters of the
aquifers and the chemical composition of water [6].
"Planning of water supply and sanitation in Nam Dinh province in 1999 – 2010
period" – report by the Center for Water and Sanitation, Nam Dinh Department of
Agriculture and Rural Development, 1999.
"Assessment of groundwater potential and prediction of depletion and salinity
instrusion in Hai Hau – Giao Thuy, coastal areas of Nam Ding Province" – report
by the Department of Water Management and Irrigation Works, Ministry of
Agriculture and Rural Development, 2000.
"Evaluation on characteristics of natural conditions and non-biological resources
in coastal areas of Nam Dinh province" – report by Marine Natural Resources &
Environment Survey Center, 2001.
"Assessing the sustainability of the exploitation of groundwater resources in
Vietnam territory. Strategic orientation for rational utilization and protection of
groundwater resources by 2020" – state project by Bui Hoc et al, 2003 [10].
"General survey of groundwater resources in Nam Dinh province: planning for
rational and sustainable uses" – report by Doan Van Canh and Le Thi Lai, 2003 [2].
18
"Research and application of combinatorial methods of geology, geophysics,
numerical modelling to investigate, assess salinity intrusion and search for fresh
groundwater lenses or aquifers in coastal areas of Nam Dinh” – report by Nguyen
Van Dan - NDWRPI, 2009 [4].
In 2010, within the framework of the project “Improvement of Groundwater
Protection in Viet Nam” in Nam Dinh Province, 10 additional groundwater
monitoring points were constructed. In total of 23 new monitoring wells, there are 4
wells in Holocene aquifer, 14 wells in Pleistocene aquifer, 4 wells in Neogene
aquifer, and 1 well in Triassic aquifer. Slug tests were conducted in 2011 by
National Center for Water Resources Planning and Investigation (NAWAPI) to
determine the hydrogeological parameters of the Pleistocene aquifer in Nam Dinh
Province.
Many of these documents have proven to be very useful secondary data sources,
which contributed vast important information for the construction, calibration and
validation of the model (see Chapter 3).
1.4.
Methodology
Based on principle of water balance this research used the water balance
equation to determine the groundwater safe yield. Numerical simulation of a
hypothetical case was used to demonstrate the natural groundwater balance, effects
of pumping and the dynamic development of the capture.
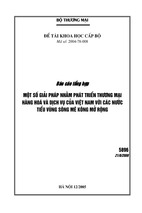
In this thesis, as a systematic evaluation tool for groundwater flow, GIS program
and the groundwater modeling program MODFLOW were integrated and used
(Figure 1.1).
At first, related information available in print or published on the internet were
gathered and analyzed. To simulate the groundwater flow, regional hydrogeology,
topography, hydrology, soil, land use and well data during the period of 1995-2012
were collected from NAWAPI under the Ministry of Natural Resources and
Environment (MONRE), Vietnam. The aquifer system was identified and
characterized to construct the 3D structural model.
19
Boreholes
strata data
Boundary
conditions
Geological
maps
3D structural model construction
Extraction
Aquifer
parameters
2D crosssections
MODFLOW inputs
Model set up
Model Calibration & Verification
MODFLOW outputs
Scenarios simulation
Groundwater safe yield
determination & assessment
Figure 1.1: Steps of study
In order to use MODFLOW, initial conditions, hydraulic properties, and stresses
were specified for every model cell in the finite-difference grid. Measured heads
from the field were assigned directly to inland constant-head boundaries.
After setting up the model as well as calibrating and verifying, different
pumping schemes were used, based on which, corresponded simulations were
executed. The results were analyzed to determine groundwater safe yield for
different areas of Nam Dinh Province. Finally, recommendations were given to
improve the groundwater management in the area.
20
1.5.
Structure of thesis
This thesis consists of 4 chapters:
Chapter I - Introduction: This chapter is the introduction which contains the
background, importance, objectives of the study and short description of the study
area. A comprehensive review of literature and a description of study scope were
also presented in this chapter.
Chapter II - Characteristics of Nam Dinh Province: This chapter provides a
comprehensive description on the natural conditions as well as socio-economic
characteristics of the study area. This chapter also describes the current status of
groundwater and the utilization of groundwater in Nam Dinh Province.
Chapter III - Construction of numerical model to assess groundwater safe
yield in nam dinh province: In this chapter, the numerical model set up will be
presented. The simulation results will then be analyzed to estimate the impacts of
pumping activities on groundwater flow and hydraulic head.
Chapter IV - Simulated results and recommendations: This chapter presents
the results of several pumping variations. Finally, overall conclusions,
recommendations were given for improving groundwater management in the study
area as well as possible works for the future studies.
- Xem thêm -