Meissner's corpuscle
Tactile discs Free nerve endings
Sebaceous gland Smooth
Dermis
Epidermis
muscle
Hair
End bulbs of Krause
Nerve ending Subcutaneous Padnian
fat
corpuscle
wound hair
Duct of Ruffini
ItNMt gland ending
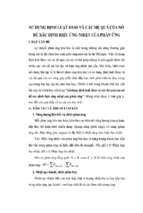
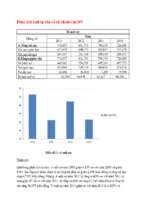
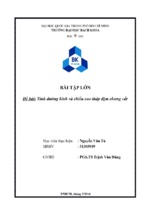
Figure 3.8 Composite diagram of the skin in cross-section. Tactile sensations are transmitted
from the variety of nerve endings, for example, the free nerve endings and the tactile discs
in the epidermis, and the meissner corpuscles, end bulbs of Krause, Ruffini endings, and
pacinian corpuscles in the dermis. (Reproduced with permission from ref. 35.)
Swiss style strawberry yogurt were added. With the exception of a few war years,
the contest has been held annually. Fifty-nine schools have fielded teams with as
many as 33 participating in 1956. 5 ' 37 Several regional collegiate contests are also
held each year. At the high school level, the Future Farmers of America conducts
an annual state and national dairy foods evaluation contest. These have served to
give thousand of students training in the recognition of dairy product defects, their
causes, and control.
Many other food industries have developed their *'expert" tasters resources.
These experts obtained experience through the years and were charged wih the responsibility of determining the material blend or judging the quality of raw materials.
They also judge the quality of finished product and identify sources of problems and
suggestions for correction when the products are less than perfect. These experts
include the perfumers, flavorists, brew masters, wine makers, and coffee and tea
tasters. In most of these industries, such as the dairy industry, scorecards and point
systems have been developed to help set standards.38
With the growth of the food industry and the expansion of product lines within
companies, it has become almost impossible to have dependable expert judges of all
products. It has been necessary to develop sensory evaluation systems that are more
universally applicable. Sensory evaluation of foods in general with methodology
appropriate for either consensus or statistically sound evaluation of foods began to
develop in the 1940s and 1950s at the U.S. Army Quartermaster Food and Container
Institute in Chicago.39'40 Development began also in the private sector. The Arthur
D. Little Company pioneered descriptive analysis by developing a Flavor Profile
Method that uses a consensus of a small group of people who are trained to the
product in a way that is universally applicable. The single expert was replaced with
five or six trained people.41 The University of California at Davis began to offer
courses on sensory evaluation in the 1950s. The literature at that time reflects significant development in the application of sensory evaluation. Discrimination tests
were developed by Boggs and Hansen,42 Girardot et al.,43 and Peryam et al.39 Ranking and hedonic scales began to be used for consumer acceptance information. Committee E-18 of the American Society for Testing Materials, the Food and Agriculture
Section of the American Chemical Society, the European Chemoreception Organization, and the Sensory Evaluation Division of the Institute of Food Technologists
got involved by organizing activities focusing attention on sensory evaluation and
measurement of flavor and publishing information assisting the food industry in
application of the new techniques.40 These methods are all applicable to dairy product evaluation.
3.2.2 Affective Testing
Affective testing is acceptance testing. Its objective is to determine the degree of
consumer acceptance or preference for a product. Usually it is determined relative
to a product such as an existing product, or an acceptable successful product. The
ideality of certain easily understood attributes can be judged by consumers using
their concept of ideal as the standard.
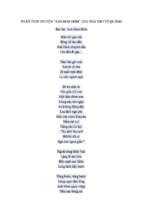
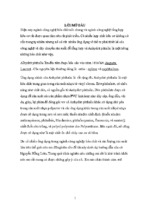
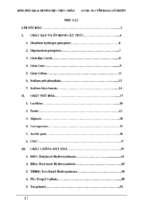
Hedonic scales are used to rate the degree of liking of products. An example of
a nine-point hedonic scale is shown in Figure 3.9. There are a wide variety of hedonic
or liking scales that can be and have been used. Recommended scales are balanced
with an odd number of choices, with the middle choice being neutral "Neither like
nor dislike." Choices above neutral are positive, with the top being "Like extremely" and the choices below neutral being negative and balanced with those
above and the bottom being "Dislike extremely." The data can be treated parametrically, yielding means and standard deviations. Liking of products can be compared using the t test or analysis of variance (ANOVA). Parametric treatment assumes that data are distributed normally and that intervals on the scale are equal.
There has been considerable discussion about the validity of these assumptions but
the practical value of this approach continues to be demonstrated. The data can be
converted to preference or ranking and analyzed binomially.40'44'45
Another affective tool is preference testing. Panelists have the opportunity in
preference testing to tell which of two samples they prefer (paired comparison) or
Please check a box indicating your feeling about this product.
Like extremely
Like very much
Like moderately
Like slightly
Neither like nor dislike
Dislike slightly
Dislike moderately
Dislike very much
Dislike extremely
Figure 3.9 An example of the nine-point hedonic scale. The subjects indicate to what extent
they like or dislike the sample by checking a box by the most correct statement.
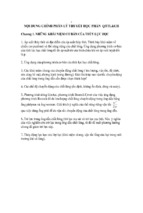
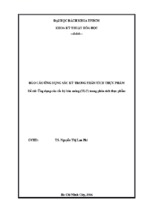
Please check a box indicating your feeling about
the moistness/dryness of this product
Much too moist
Slightly too moist
Just about right
Slightly too dry
Much too dry
Figure 3.10 An example of a Just-about-right scale. The purpose of the judgment is to
establish how close to ideal a product is in an easily understood attribute. The subject checks
the box by the statement that best describes his or her feelings about the correctness of the
level of that attribute.
to rank more than two samples in order of preference. It is important that each sample
is tasted first and last its share of the time to avoid order bias. Analysis of the paired
comparison test utilizes binomial statistics. Tables are available giving the number
of subjects that must prefer one sample given a certain number of participants for
the preference to be significant.46 When ranking is used, tables and formulas are
available showing the rank sum difference required for significantly different ranking
given the number of samples compared and number of panelists used. 47
An effective tool to determine the ideality of easily understood attributes is the
Just-about-right scale. This is the three- or five-point scale with "Just about right"
being the middle response with balanced descriptors of the attribute extremes going
up and down from ideal (Fig. 3.10). Stone suggests two methods of analyzing the
data to determine if each product deviates significantly from ideal and one method
to determine if the samples deviate from one another in ideality.40 One involves
using the binomial table of Roessler et al. (p = 0.5, two-tailed) to determine if the
number of judgments on one side of ideal is more than can be explained by chance.46
The number of nonideal judgments is n and the number on one side of ideal is found
in the column under the appropriate confidence level.
The appropriate type of panelist for all affective tests is a "naive" consumer, one
who has no knowledge of the objective of the comparison or the technology involved
in making the products. The subjects may be screened to be representative of the
demographics of a certain target consumer group. Trained panelists who are used in
descriptive or discrimination tests should not be used because of their analytical
approach which may bias affective judgments.40
3.2.3 Discrimination Testing
Discrimination testing is a very useful sensory evaluation tool that enables one to
determine if a perceived difference exists between two products. Often it is preliminary to other types of testing. If no perceived difference exists, it is not necessary
to determine which one is preferred or what the difference in the descriptive characteristics are.40 If a development objective is to have no perceived difference, this
test can establish that the objective has been met and subsequent sensory testing may
not be necessary. There are several methods that may be used to establish whether
there is a perceived difference. Methods include paired-comparison, duo-trio, and
triangle tests.
The paired comparison test is a two-sample test with the task being to determine
whether the products are the same or different, or it may be to choose which of the
two samples has more of a particular attribute. When the subject is asked if the
products are the same or different, it is important that half the panelists receive
samples that are the same and half receive samples that are different. In interpreting
the data, the number of correct choices are compared with the number of correct
selections that can be explained by chance. When the assignment is to indicate which
sample has more or less of a certain attribute, it is assumed that the subject recognizes
that attribute in the product. It is important that the attributes be simple and easily
recognizable. If the number of correct selections if greater than can be explained by
chance, one can conclude that the samples are different. Interpretation involves binomial statistics. A table and formula for the significant number of correct judgments
is published by Roessler et al.46 The correct table and formula would be those where
the probability of being right by chance in one selection is one in two (p = 0.5). It
is a one-tailed test. The tail of interest is being correct more frequently than can be
explained by chance. The other tail not of interest is being wrong more frequently
than can be explained by chance. Protection against a type I error (finding difference
when none exists) is selected by selecting the column with the appropriate a. An a
of 0.05 would allow for a 5% chance of a type I error.48
The duo-trio test was developed by Peryam and Swartz as a way to minimize
the number of comparisons that have to be made.39 The subject is given a reference
sample and two coded samples. One of the coded samples is the same as the reference
sample. The subject is asked to indicate which sample is the same as (or different
from) the reference. In variations of the test, the reference sample may be removed
after it is tasted to force the use of memory for comparison. Reliance on memory
decreases the sensitivity of the test. The same sample may be used as the reference
through the entire test, or each sample may take its turn as the reference. It is important that the order of tasting the two samples be rotated so that each sample is
tasted immediately after the reference with equal frequency. The data are evaluated
using the same formula and tables as for paired comparisons.46 The probability of
being correct on one decision is one in two (p = 0.5) and interest is in one tail
(being right more frequently than can be explained by chance).
The most frequently used discrimination test is the triangle test. It was initially
developed by a beer company.49 In this test, the panelist is presented three coded
samples. Two are the same and one is different. The panelist evaluates all three and
determines which one is different or which two are most alike. This test requires
more tasting than the others. Three pairs are compared in making the judgment.
Again binomial statistics are used to evaluate the results. The probability of being
right by chance (p) in one selection is one in three and it is a one-tailed test (the
probability of being wrong more frequently than is explained by chance is the tail
that is not of interest).40 The table and formula provided by Roessler et al. are used
to determine when the frequency of correct selection exceeds chance.46
Subjects for discrimination tests should like the product, be familiar with the test
procedure, have frequent practice with the test, have a record of exceeding chance
in choosing correctly in previous tests, and have no specific knowledge about the
samples.40 The number of panelists used should be no more than 40 and may be as
few as 12 to 15. Too many panelists will result in significant differences when the
differences are very subtle and of no practical importance. Too few will allow for a
large type II error (finding no difference when difference exists).30'48
It is important to guard against unintended differences. For example, it is easy to
have slight temperature, serving amount, piece shape or size, or color differences
that are not intended. Panelists are playing a game and will look for any clues that
will reveal the different sample. If a conclusion is reached, due to inadvertent hints
that samples are different when they are not, the results can be misleading and
expensive. Further development or costly consumer or descriptive testing may be
mandated.
3.2.4 Descriptive Analysis
Descriptive analysis is the process of developing a total sensory description of a
product. In its complete form it involves identifying each flavor, aroma, and textural
quality detectable in the product and quantifying each. The time sequence of the
detection of the qualities can also be included in the profile. Affective judgments as
to the desirability of the sensory qualities are generally not a part of descriptive
analysis. It is important that the panel members are highly trained to recognize all
of the qualities of the product and to use a standardized terminology to describe
them. Developing and proving a descriptive panel requires skill on the part of the
leaders, and dedication, time, patience, and attention to detail on the part of panel
leaders and panelists. 30 ' 40 Several methods of descriptive analysis have been developed. Three that represent the development of descriptive analysis and slightly different philosophies are the Flavor Profile, Texture Profile, and Quantitative Descriptive Analysis (QDA).
The Flavor Profile method was developed by Arthur D. Little, Inc. in the late
1940s. A small panel of four to six trained judges analyze a product's perceived
aroma and flavor qualities, and their order of detection, intensity, and aftertaste. They
also assess the degree to which various flavor or aroma characteristics fit together
and their appropriateness in the product and call this characteristic amplitude.41'50
Prospective panelists are screened for their ability to detect and discriminate tastes
and odors. Their interest and availability and ability to work with a group are assessed in a personal interview. Selected panelists are trained with product examples
that represent the extremes of the different qualities that may be encountered. Product
is made with a variety of ingredients and processes to produce a wide variety of
product. In the actual evaluation session, trained panelists first evaluate a product
individually while seated together around a table. The results are reported to the
panel leader who leads a discussion that results in a consensus profile. More than
one sample can be profiled in a session but they are done one at a time without
tasting back and forth. Once a panel is trained, profiles can be obtained easily. 10 ' 40
General Foods developed the Texture Profile method to do for texture analysis
what the Flavor Profile method had done for flavor and aroma. 51 " 53 It was different
from flavor profiling in that the terminology for different texture qualities was
standardized (Table 3.2). The anchors used to standardize the scales were also predefined. Odd numbered categorical scales for each quality were developed. Later
quality descriptors were added for semisolid foods, beverages, 54 ' 55 and skin-feel
products.56 Prospective panelists are screened based on interest, availability, and
attitude. They are further selected on the basis of ability to discriminate known
textural differences in the product to be tested. They are introduced to the principles
involved in the product to be tested. An evaluation of a product after the panel is
trained involves independent evaluation by each panelist using one of a number of
possible scales, then the generation of a panel verdict. The verdict may be obtained
by discussion and group consensus similar to the method for obtaining a flavor profile
or by statistical analysis of the data.
Quantitative Descriptive Analysis was developed to overcome weaknesses in the
descriptive test previously described. It was designed to be responsive to flavor,
aroma, and texture simultaneously, to be applicable to a broad range of products, to
be quantitative in evaluation of panelists' qualifications and in development of profiles, to use a small number of panelists, and to have flexible panel-generated terminology. Subjects are qualified before participation. They must be available and be
users of the product class. They must demonstrate ability to perceive differences
within the class of products and to articulate those differences. The terms used to
describe qualities may be available from previous work. If so, the panel learns and
experiences the definitions of all the qualities. If not, the terms describing the qual-
Table 3,2
RELATIONSHIP BETWEEN TEXTURAL PARAMETERS AND
POPULAR NOMENCLATURE
Mechanical Characteristics
Primary Parameters
Hardness
Cohesiveness
Popular Terms
Secondary Parameters
Brittleness
Chewiness
Gumminess
Viscosity
Elasticity
Adhesiveness
Soft, firm, hard
Crumbly, crunchy, brittle
Tender, chewy, tough
Short, mealy, pasty, gummy
Thin, viscous
Plastic, elastic
Sticky, tacky, gooey
Geometrical characteristics
Class
Examples
Particle size and shape
Particle shape and orientation
Gritty, grainy, coarse, etc.
Fibrous, cellular, crystalline, etc.
Other Characteristics
Primary Parameters
Moisture content
Fat content
Popular Terms
Secondary Parameters
Oiliness
Greasiness
Dry, moist, wet, watery
Oily
Greasy
Reproduced with permission from ref. 52.
P l e a s e m a r k this line in a position that indicates how
w e a k / f i r m you feel this yogurt body to b e .
Extremely
weak
Extremely
firm
Figure 3.11 An example of a horizontal line scale used by descriptive panelists to indicate
the strength of a particular flavor or aroma quality. The subjects marks the position of the line
that describes the intensity of the quality.
ities are selected and defined by the panelist as they train. Reference materials that
are examples of the qualities are used to aid in definition of qualities. When evaluating actual product, if new qualities are found, the panel reconvenes to define and
train on that quality. Scales used are horizontal lines of a consistent length with word
descriptors at or near the ends (Fig. 3.11). Intensity always increases from left to
right and the subject marks the line at a position that is appropriate for the intensity
of the quality. Evaluation during training and on actual product is done individually
Aftertaste
Bitterness
Aroma
Malt Flavor
Sweet
Crunch
(final)
Sour
Crunch
(initial)
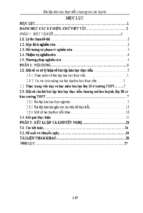
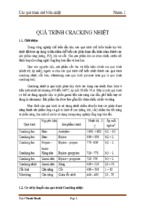
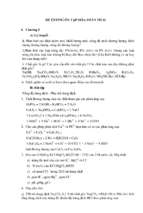
Figure 3.12 Visual display of the sensory characteristics based on the results of a Quantitiative Descriptive Analysis (QDA) test. For each characteristic, the relative intensity increases
as it goes further from the center. (Reproduced with permission from ref. 40.)
and usually in isolated sensory booths to ensure independent analysis. Replicate
samples are included so that ANOVA can be applied to evaluate the panelists' consistency as well as to statistically compare the intensity of qualities of the different
samples. The panelists who are best able to replicate themselves on all the qualities
and who agree best with the rest of the panel on each of the qualities are best qualified
to evaluate product. Usually between 8 and 12 qualified subjects constitute a panel.
The product QDA profile is a listing of the qualities and the means for each of those
qualities. Significance of difference between samples in each quality is obtained by
ANOVA.40 Multiple-range tests are applied to establish the significance of differences between multiple samples. Profiles of individual samples can be shown in a
number of formats. A "spider web" format is shown in Figure 3.12. Each quality
is depicted as a "spoke" of a wheel with its length being indicative of the intensity
of the quality. With the ends of the "spokes" connected, a shape is formed that is
distinct. A change of intensity in one attribute produces a readily distinguishable
difference in shape.
3.3 Application of Sensory Analysis to Dairy Products
The system for evaluating dairy products for defects was developed long before the
generally applicable tools of affective, difference, and descriptive analysis. These
Next Page
newer generally applicable tools are as useful for dairy products as they are for other
foods and are essential when sensory information needs to be quantified for research
purposes. Any treatment of sensory analysis of dairy products without their mention
would be incomplete. The remainder of this chapter, however, will focus on evaluation of dairy products for defects or judging of dairy products. This ability, although
not designed for statistical analysis or research, is still very useful to dairy product
manufacturers, enabling them to recognize defects, identify causes and take corrective action.
3.3.1 The Philosophy of Judging of Dairy Products
Judging of dairy products is related to descriptive analysis. It is similar in that flavor
(including aroma), texture, and appearance can all be evaluated. It is similar too in
that the names of the qualities and their definitions are standardized. The quality
terms and definitions have evolved over the years with USDA and industry "experts" involved and a committee of collegiate coaches, who serve as the American
Dairy Science Committee on Dairy Product Evaluation, periodically modifying the
terms and definitions. It is different from descriptive analysis in that normal ideal
base qualities of the products are not identified and only the defects are noted. The
judges score the products on flavor, texture, and appearance. Score ranges are established for each defect. Defects that are indicative of serious problems have lower
score ranges than less serious defects. Higher scores in that range are given if the
defect is slight and scores at the lower end of the range are given when defects are
pronounced. In the event of multiple defects, the score is based on the defect that
would result in the lowest score. In that way, scoring takes into account the magnitude and seriousness of the defects as determined by these "experts." No attempt
has been made to tie the scores to consumer acceptance of the products.
3.4 Descriptive Sensory Defects of Dairy Products
3.4.1 Fluid Milk and Cream
3.4.1.1 Introduction
Fluid milk is the material from which all other dairy products are made. Defects in
milk will cany over into those products so it is important that these defects be
recognized first. Coaches of collegiate judging teams spend a generous amount of
time on fluid milk because the defects of milk are closely related to the resulting
defects in products, and because "doctoring" milk to simulate the defects is relatively easy. 5 A wide variety of fluid milk and cream products are available. A listing
of products is shown in Table 3.3. Complete evaluation of fluid milk can include
examination and scoring of a sediment disk, evaluation of the package, storage temperature, and bacteria count.5 Table 3.4 shows flavor defects that can be found in
milk and the range of scores that can be assigned. A score card that includes all these
important defect descriptors is shown in Figure 3.13. It is based on a possible 25
Previous Page
newer generally applicable tools are as useful for dairy products as they are for other
foods and are essential when sensory information needs to be quantified for research
purposes. Any treatment of sensory analysis of dairy products without their mention
would be incomplete. The remainder of this chapter, however, will focus on evaluation of dairy products for defects or judging of dairy products. This ability, although
not designed for statistical analysis or research, is still very useful to dairy product
manufacturers, enabling them to recognize defects, identify causes and take corrective action.
3.3.1 The Philosophy of Judging of Dairy Products
Judging of dairy products is related to descriptive analysis. It is similar in that flavor
(including aroma), texture, and appearance can all be evaluated. It is similar too in
that the names of the qualities and their definitions are standardized. The quality
terms and definitions have evolved over the years with USDA and industry "experts" involved and a committee of collegiate coaches, who serve as the American
Dairy Science Committee on Dairy Product Evaluation, periodically modifying the
terms and definitions. It is different from descriptive analysis in that normal ideal
base qualities of the products are not identified and only the defects are noted. The
judges score the products on flavor, texture, and appearance. Score ranges are established for each defect. Defects that are indicative of serious problems have lower
score ranges than less serious defects. Higher scores in that range are given if the
defect is slight and scores at the lower end of the range are given when defects are
pronounced. In the event of multiple defects, the score is based on the defect that
would result in the lowest score. In that way, scoring takes into account the magnitude and seriousness of the defects as determined by these "experts." No attempt
has been made to tie the scores to consumer acceptance of the products.
3.4 Descriptive Sensory Defects of Dairy Products
3.4.1 Fluid Milk and Cream
3.4.1.1 Introduction
Fluid milk is the material from which all other dairy products are made. Defects in
milk will cany over into those products so it is important that these defects be
recognized first. Coaches of collegiate judging teams spend a generous amount of
time on fluid milk because the defects of milk are closely related to the resulting
defects in products, and because "doctoring" milk to simulate the defects is relatively easy. 5 A wide variety of fluid milk and cream products are available. A listing
of products is shown in Table 3.3. Complete evaluation of fluid milk can include
examination and scoring of a sediment disk, evaluation of the package, storage temperature, and bacteria count.5 Table 3.4 shows flavor defects that can be found in
milk and the range of scores that can be assigned. A score card that includes all these
important defect descriptors is shown in Figure 3.13. It is based on a possible 25
Table 3.3 A USTING OF FRESH MILK AND CREAM
PRODUCTS WITH FAT CONTENT IN
PARENTHESES57
Half and half (10.5-18%)
Light cream (18-30%)
Light whipping cream (30-36%)
Heavy cream (s*36%)
Whole milk (2*3.25%)
Skim milk (<0.5%)
l%Milk(l%)
2% Milk (2%)
Table 3.4
THE ADSA SCORING GUIDE FOR OFF-FLAVORS
ON MILK AND CREAM
Intensity of Defect
Flavor Criticisms3
Acid
Bitter
Cooked
Feed
Fermented/fruity
Flat
Foreign
Garlic/onion
Lacks freshness
Light induced (oxidized)
Malty
Metallic (oxidized)
Rancid
Salty
Unclean
Slight
Definite
Pronounced
3
5
8
6
5
9
5
5
8
6
5
5
4
8
3
1
3
8
4
3
8
3
3
7
4
3
3
1
6
1
0b
1
6
1
1
7
1
1
6
1
1
1
0
4
0
Source: American Dairy Science Association, 1990.
a
"No criticisms'' is assigned a score of 10. Normal range is 1 -10 for salable product.
b
An assigned score of 0 (zero) is indicative of unsalable product.
points with 10 possible on flavor, three on sediment, five on package, five on bacteria
count, and two on temperature. The electronic score card now used in collegiate
competition in which only flavor is judged is shown in Figure 3.14. The flavor of
milk is usually judged after sediment, closure, and container are judged. This treatment will cover only flavor. For information on how the other factors are judged see
Bodyfelt.5 To best judge flavor, the milk or cream should be tempered to 12.8 to
18°C. The judge should swirl the bottle and then smell the milk or cream. Swirling
serves to mix the sample and to spread a fine film on the inside of the container
which gives maximum opportunity for volatiles to fill the headspace. A small amount
of sample should be poured into a clean odorless container. Glass is preferred but
plastic or paper is acceptable. The judge should then take a sample into his or her
mouth, and move it around in the mouth making sure to coat all the surfaces of the
SCORE CARD FOR MILK QUALITY
Product:
Date:
1
Flavor 10
No criticism
10
Unsalable
0
Normal range
1-10
Sediment 3
Package 5
No criticism
5
Unsalable
0
Normal range
1-5
Bacteria
2
3
SAMPLE NO.
4
6
5
7
8
Criticism
Score
Acid
Astringent
Barny
Bitter
Cooked
Cowy
Feed
Fermented/fruity
Flat
Foreign
Garlic/onion
Lacks freshness
Malty
Oxidized light induced
Oxidized metal induced
Rancid
Salty
Unclean
Score
Score
Container bulging/distorted
Dented/defective
Dirty inside
Dirty outside
Leaky
Not full
Closure defective
Coating flaky/cracked
Heat seal defective
Illegiblejjrinting
Labeling/code incorrect
Lip chipped
Cover not waterproof
Unprotected
5
Score
Standard plate count
Coliform count
Keeping quality
Temperature 2
Temperature (0F or 0C)
Total score of
each sample
Desired
% Fat content (%)
Desired
% Solids not fat (%)
Under/over filled
Titratable acidity
Functional
and other
tests performe:d
on samples
Score
Score
Signatures of evaluators
Figure 3.13 A modified and expanded version of the ADSA milk score card. (Reproduced
from ref. 5, with permission of the ADSA, Champaign, IL.)
MARKING INSTRUCTIONS
M
I PROPER
MARKS
PROPER
MARK
ERASE CHANGES CLEANLY AND
COMPLETELY
OO NOT MAKE ANY STRAY MARKS
MILK
NCS Tm
i e-Opcti* MP30-73629-321 A2400
SAMPLE NUMBER
WTTER
NO
CRT
IC
IS
I M FE£O
10
FLAT
NORMAL
RANGE
1-10
GARUC/0NI0N
MALTY
waomo - Mm*, Mouotft
SAtTY
BODY AND
TEXTURE
NO
CRITICISM
5
NORMAL
RANGE
1-5
APPEARANCE
AND COLOR
NO
CRITICISM
5
NORMAL
RANGE
1-5
Figure 3.14 Collegiate contest milk score card. (Reproduced from ref. 5, with permission
of the ADSA, Champaign, IL.)
mouth from the front to deep in the back down to the throat, noting any off-flavors.
While the sample is in the mouth, airis moved up through the nose to enhance odor
detection. The sample should then be expectorated and a few moments allowed to
observe aftertaste. Aftertaste and aroma sensation are enhanced by exhaling slowly
through the nose. Swallowing sample is not advised. According to Bodyfelt,5 the
flavor of whole milk should be pleasant and sweet and with neither a foretaste nor
an aftertaste other than that imparted by the natural richness. A listing of flavor
criticisms with a scoring guide is shown in Table 3.4. A list of these defects, and
their verbal descriptions, causes, and methods of preparing training samples follows.
3.4.1.2 Flavor Defects
Acid or Sour Milk
Description. Acid or sour is detected by both the senses of taste and smell. The
tip of the tongue is sensitive to the "peeling" or "tingling" sensation. A general
feeling of "cleanliness" and enhanced ability to taste is part of the sensation. Other
flavors such as diacetyl may accompany acid as byproducts of fermentation.5
Cause. Acid or sour milk is a result of bacterial action on lactose converting it to
lactic acid. It can be produced by culture organisms such as Lactococcus lactis ssp.
lactis, or Lactococcus lactis ssp. cremoris or by any other lactic acid fermenting
organism that purposely or accidentally is present in milk and is allowed to grow.
Training Sample Preparation. Small amounts of lactic acid can be dissolved in
milk until the desired intensity of acid is obtained. Addition of 25 ± 5 to 10 ml of
fresh cultured buttermilk can be added to 575 ml of fresh milk. It should be prepared
1 or 2 days before tasting and held refrigerated until use.5 Usually a diacetyl flavor
accompanies the acid flavor.
Astringent
Description. This sensory defect is actually a tactile sensation. Other descriptive
words used are mouth coating, dry, puckery, chalky, and powdery. It is classified
here with flavor because it is sensed when the product is taken into the mouth. It is
not a common defect in beverage milk. After expectoration, the lining of the mouth
may feel shriveled or puckered.
Cause. Not all the causes are known but it is usually associated with high heat
treatment of milk that has caused some aggregation of milk proteins. A specific
particle size of milk proteins or other milk constituents is thought to be responsible
for the sensation.
Training. Green persimmon or alum are extreme examples of astringency. They
may be used to demonstrate the sensation.
Barny
Description. The flavors ' 'cowy," ' 'barny," and * 'unclean'' seem to be quite alike
but differ in intensity and cause. The descriptive term "barny" is quite accurate,
referring to the typical smell of a poorly maintained bam atmosphere. It is noticed
immediately after the milk is expectorated.5
Cause. The smells of the barn are thought to be transmitted to the milk through
the cow's respiratory system when cows are stabled and milked in a foul smelling
barn environment.
Training. Trainees could be taken to some milking operations and the atmospheric
aroma noted. Milk could be collected from cows that are kept in this type of closed
environment, lab pasteurized, and used soon after as training samples.
Bitter
Description. Bitter is a taste sensation with no associated aroma. It is detected at
the base of the tongue. The reaction time is fairly slow so it is most strongly sensed
after the milk is expectorated. The intensity builds and it is hard to rinse away and
refresh the tongue. It seems to be a component of "rancid" and "soapy" flavors.5
Cause. It is generally acknowledged that some protein fragments taste bitter. These
fragments can be produced by enzymatic breakdown of milk proteins. Enzyme
sources in milk are likely psychrotrophic microorganisms that have grown in the
cool milk. Milk that is stored at temperatures at or slightly above 4°C for several
days will become bitter if these contaminating organisms are present. Under those
conditions they will grow to large populations and release proteases. Certain weeds
consumed by the cow will also impart bitterness to the milk. Conditions that produce
rancidity may be to blame for bitterness that is a component of rancidity.
Preparation of Training Samples. Traces of quinine dihydrochloride or quinine
sulfate added to milk will give a clean bitter flavor. A 1 % stock milk or water solution
can be made and added at the rate of 1 to 2 ml per 600 ml of milk.5
Cooked
Description. Four kinds of heat-induced flavors have been recognized: sulfurous,
rich, caramelized, and scorched. All are easily identified.58 They are detected immediately as the sample is placed in the mouth and are usually considered to be
pleasant. The sulfurous and rich descriptors are common in milk. The detection of
a cooked egg white smell is characteristic of this defect.
Cause. The mild sulfurous flavor develops when milk reaches 76°C to 78°C.59 This
is slightly above HTST pasteurization temperatures. Its development is associated
with the breaking of disulfide bonds and the development of conditions that discourage oxidation. The more severe flavors of scorched and caramelized develop at
higher temperatures and by a different mechanism and are not normal in beverage
milk. The heated flavor is what remains after cooked milk is stored cold for a period
of time. Caramelized flavor frequently intensifies and becomes more objectionable
with age.5
Preparation of Training Samples. Fresh pasteurized/homogenized milk is heated
to 800C and held for 1 min and then cooled.5 This can be done on a plate pasteurizer,
in a water bath, or in a pan on a stove top with continual stirring.
Cowy
Description. Usually a "cowy" flavor suggests a cows-breath-like odor and a
chemical aftertaste. It seems to be associated with the presence of acetone bodies in
milk.5
Cause. Cows that have acetonemia or ketosis will give milk with this off-flavor
defect.
Feed
Description. A "feed" flavor is aromatic and sometimes pleasant. After the milk
is expectorated a mild aftertaste of "cleanliness" can be present that disappears
rather quickly, leaving the mouth free of off flavors. Cowy, barny, and unclean
flavors by contrast persist with an accompanying unpleasant or "dirty" aftertaste.
Feed flavor varies with the type of feed consumed. The odor is characteristic of
the feed.5
Cause. High-volume roughage feeds consumed within 3 h of milking impart flavors
and aromas to the milk.5 Silage, some hays, and brewery waste are particularly
notable for this. A change of feed from dry hay to fresh green pasture often initiates
a strong feed flavor in the milk. If 3 h is allowed to pass between consumption and
milking, almost all feed flavors are absent from the milk.5
Preparation of Training Samples. An alfalfa flavor can be simulated by adding
and placing 2 to 3 g of alfalfa hay in 100 ml of fresh pasteurized and homogenized
milk and holding for 20 min. The milk is then strained through a cheesecloth or
paper towel and used as a stock solution. To 575 ml of fresh pasteurized and homogenized milk, add 20 to 35 ml of this stock milk solution. Grass or corn silage
can be used to prepare feed flavored milks in the same manner.5
Fermented/Fruity
Description. This defect is detected by its odor which resembles the odor of sauerkraut, vinegar, pineapple, or apple. There will also be an unpleasant flavor that will
linger long after the sample has been expectorated.
Cause. This flavor is often found in bulk raw milk after lengthy storage. Certain
microorganisms such as Pseudomonas fragi and other Pseudomonas species are
among those that produce aromatic fermentation products.60
Preparation of Training Samples. Bodyfelt suggests the preparation of a stock
solution of 1% ethyl hexanoate. About 1.0 to 1.25 ml of this solution is added to
600 ml of fresh pasteurized and homogenized milk.5
Flat
Description. Flat milk gives a watery sensation or a lack of flavor richness. No
aroma is associated with flat flavor but the lack of sweet and salty notes becomes
apparent immediately as the milk enters the mouth and the subtle thinner mouth feel
may also be notable.5
Cause. Flat flavor is generally caused by dilution with water. It can happen at the
farm or in the plant by allowing too much rinse water to pass into the milk before
it is diverted. Purposeful dilution with water is also possible.
Preparation of Training Samples. To prepare slightly flat samples add 75 to 100
ml of good quality tap water to 500 ml of fresh pasteurized and homogenized milk.
For definite flat use 110 to 120 ml of water to 485 ml of milk.5
Foreign
Description. The term *'foreign" is used to describe a number of flavors that are
imparted by addition of detergents, disinfectants, and sanitizers to milk. The flavor
is characteristic of the chemical that has been added. The flavors are atypical of milk
and do not develop in milk. In some cases the chemical may be detected by smell
but in others it may not be detected until it is tasted.
Cause. Adding milk to a vat or running milk through piping that has been washed
or sanitized but not rinsed can cause a foreign flavor especially if allowed to comingle
with a considerable amount of liquid containing the chemical. Other possible causes
include treating the udder with ointments or medication, contamination with insecticides, and drenching the cow with chemical treatments.
Preparation of Training Samples. Bodyfelt et al. suggests that a foreign flavor
may be created by adding 3 to 4 ml of twofold vanilla extract to 600 ml of milk and
that a foreign flavor caused by sanitizer can be produced by adding 1.0 ml of a 5%
sodium hyperchloride solution to 600 ml of good quality milk.5 Samples can be
made by adding traces of other nontoxic chemical cleaners and sanitizers to milk at
low concentrations.
Garlic/Onion (Weedy)
Description. These flavors are identified by their characteristic pungent flavor and
aroma and persistent after taste.
Cause. Milk is tainted with these flavors during the warm months when cows are
feeding in pastures that are infested with onion, garlic, or other weeds that impart
these flavors to the milk. They are especially strong when the cows consume these
plants shortly before they are milked.
Preparation of Training Samples. To produce a definite garlic/onion intensity, add
0.15 g of garlic or onion salt or two drops of extract to 600 ml of good quality
pasteurized and homogenized milk. Vary the amounts to get the desired flavor
strength.
Lacks Freshness
Description. This flavor lacks descriptive characteristics. It suggests the loss of
fine taste qualities typically noted in good milk. It is not as pleasantly sweet and
refreshing or as free of an aftertaste as is typically desired in milk. Frequently lowfat milks when compared with whole milk will exhibit this characteristic.
Cause. The ' 'lacks freshness" characteristic is often considered to be early stages
of the development of oxidized or rancid flavor or it could be the beginning of
degradation by psychrotrophic bacteria.
Preparation of Training Samples. This characteristic is often present in milk that
is approaching its pull date about a week and a half to two weeks after processing.
It can also be simulated by addition of 10 to 15 g nonfat dry milk powder to
600 ml of pasteurized and homogenized milk.5
Malty
Description. As is suggested by the descriptive term, this flavor is suggestive of
malt. Malt, which is grain (barley) softened by steeping and allowed to germinate,
has this characteristic flavor. This flavor can be detected by smelling or tasting the
milk and is often accompanied by or is the forerunner of an acid taste.5
Cause. This flavor in milk is usually caused by the growth of Streptococcus lactis
ssp. lactis var. maltigenes bacteria. They grow well when the temperature is allowed
to rise above 18.2°C for 2 to 3 h.60
Preparation of Training Samples. This flavor can be easily transferred from malted
cereals to milk. A stock solution is made by soaking 15 g of Grape Nuts in 100 g
of milk for 30 min. The milk is filtered through cheesecloth or a napkin. Thirteen
milliliters of the stock solution is added to 590 ml of pasteurized and homogenized
milk to give a malty flavored milk of definite intensity.
Oxidized (Metal-Induced)
Description. This flavor is a result of lipid oxidation that is induced by catalytic
action of certain metals. Other synonymous terms are metallic, oily, cappy, cardboardy, stale, tallowy, painty, and fishy. It is characterized by an immediate taste
reaction on placing the sample in the mouth and a moderate aftertaste. A puckery
mouth feel characterizes high-intensity oxidized flavors. It is similar to the flavor of
metal foil, a rusty nail, or an old penny.5
Cause. The presence of this flavor usually means that some corrodible metal has
come in contact with the milk. It usually can be traced to a fitting or some piping
that is made of "white" metal. For years, dairy plants and equipment have been
made entirely of stainless steel to avoid the development of this defect. Oxidation
of the phospholipids that were originally in the fat globule membrane is blamed for
the majority of the flavor. Two oxidative products, 2-octenal and 2-nonenal, have
this characteristic flavor at <1 ppm.61
Preparation of Training Samples. The flavor can be generated by soaking clean
pennies in milk until the flavor intensity reaches the desired level. Another method
is to prepare a 1% stock solution of CuSO4 and add the following amounts to 600
ml of milk: 0.75 ml for slight, 1.2 ml for definite, and 1.8 ml for pronounced. These
samples are held refrigerated for 1 to 2 days before use.5
Oxidized (light-Induced)
Description. Synonymous descriptive terms that have been used for this flavor are
burnt, burnt protein, burnt feathers, cabbagey, and medicinal. Some synonymous
terms designating cause are light-activated and sunlight flavor.
Cause. Two reactions are involved in the development of this flavor which develops when milk is exposed to sunlight or fluorescent lights. One is produced by lipid
oxidation as described for metallic oxidized flavor, and the other by amino acid
degradation involving riboflavin. It is proposed that methionine is degraded to
3-methylthiopropanal (methional) by a Strecker degradationlike reaction yielding
ammonia and carbon dioxide.36'62 Methional has an odor similar to that of lightexposed milk. Without riboflavin methional does not develop.36
Preparation of Training Samples. Milk with the light-induced oxidized flavor can
be prepared by exposing milk in clear or translucent containers to bright direct
sunlight for 8 to 15 min. The shorter times will produce slight levels of the defect
and the longer time will give definite and pronounced levels.5 Similarly the flavor
can be produced by exposing milk to bright fluorescent light for 2 to 8 h. Overnight
exposure next to a 40-watt fluorescent light will produce pronounced flavor. Less
intense samples can be prepared by diluting strongly flavored samples.
Rancid
Description. There are several characteristics of rancid off-flavor. There is a characteristic odor derived from volatile fatty acids that have been hydrolyzed from the
fat. Immediately after putting the sample in the mouth, the objectionable flavor may
not be apparent but as the sample reaches the back of the mouth, soapy, bitter, and
possibly unclean flavors are perceived. The soapy and bitter notes reside long after
the sample is expectorated. A high percentage of prospective judges do not detect
or have a high threshold for the soapy and bitter notes.5
Cause. Rancid flavor is usually caused by disrupting the milk fat globule while
active lipase is present. The lipase enzyme, which catalyzes the deesterification of
the fatty acids from the glycerol, is able to get to its substrate when the fat globule
membrane is disturbed. This happens when raw milk is held static in a running
centrifugal pump, when raw milk is homogenized before it is pasteurized, or when
raw milk is inadvertently mixed with homogenized milk. It may also occur when
microorganisms, particularly psychrotrophs, produce and release Upases into homogenized milk.5
Preparation of Training Samples. Rancid milk can be prepared by adding equal
quantities of raw milk to freshly pasteurized and homogenized milk and holding
several hours cold while the flavor develops. Bodyfelt suggests mixing 100 ml of
raw milk with 100 ml of pasteurized and homogenized milk in a Waring blender or
a similar mixer for 2 min, then making it up to 600 ml with pasteurized and homogenized milk. He suggests making it up 2 to 3 days ahead and holding cold while
the flavor develops. In both cases, it is important to heat the milk to 700C for 5 to
10 min and cool after the flavor has developed.5
Salty
Description. The descriptive term "salty" is commonly known and a good term
to describe this flavor. It is perceived quickly on placing the sample in the mouth.
No aroma or odor accompanies the salty flavor. It lends a cleansing feeling to the
mouth.5 The author perceives the salty sensation as "warm" and lacking refreshing
character.
Cause. Cows in the advanced stages of lactation and cows that have clinical stages
of mastitis often have high salt content in their milk and a salty flavor. Comingled
milk seldom has an abnormal salt level nor a salty taste.
Preparation of Training Samples. Add a pinch of sodium chloride at a time to
pasteurized and homogenized milk while stirring to dissolve the salt until it is at the
desired strength.
Unclean
Description. Milk with an "unclean" flavor is readily noted when the sample
enters the mouth. The flavor and odor are offensive, suggesting extreme staleness,
mustiness, putrid, "dirty sock," or spoiled. The flavor fails to clean up after the
milk is expectorated.
Cause. This flavor develops in milk when psychotropic bacteria are allowed to
grow to high numbers in milk and particularly when held at temperatures above
7.2°C. The presence of psychrotrophs is usually due to poor on-farm sanitation. High
numbers are generally due to poor bulk tank cooling.
Preparation of Training Samples. To find ' 'unclean'' flavored milk, examine several samples of milk that are beyond their pull date. If the flavor is not found, incubate
them for 4 to 12 h at room temperature and reexamine them. When an exemplary
sample is found, it may be maintained in the refrigerator and used as an inoculum
for production of future training samples.5
3.4.2 Cottage Cheese
3.4.2./ Introduction
Cottage cheese is a curd that is formed by the acid coagulation of pasteurized skim
milk. The acid may be formed by lactic acid bacteria that are added to the milk
which consume lactose and convert it to lactic acid.63 In one successful method, part
- Xem thêm -