New dairy processing handbook
Bách khoa toàn thư về công nghệ sản xuất sữa của tập đoàn hàng đầu trong ngành sản xuất sữa Tetra Pak
Flow controller
The flow controller maintains the flow through the pasteuriser at the correct
value. This guarantees stable temperature control and a constant length of
the holding time for the required pasteurisation effect. Often the flow controller is located after the first regenerative section.
Regenerative preheating
The cold untreated milk is pumped through the first section in the pasteuriser, the preheating section. Here it is regeneratively heated with pasteurised
milk, which is cooled at the same time.
If the milk is to be treated at a temperature between the inlet and outlet
temperatures of the regenerative section, for example clarification at 55°C,
the regenerative section is divided into two sections. The first section is
dimensioned so that the milk leaves at the required temperature of 55°C.
After being clarified the milk returns to the pasteuriser, which completes the
regenerative preheating in the second section.
The regenerative energy-saving
effect is in a milk pasteuriser
typically between 90 and 96%.
Pasteurisation
Final heating to pasteurisation temperature with hot water, normally of a
temperature 2 – 3°C higher than the pasteurisation temperature (∆t = 2 –
3°C), takes place in the heating section. The hot milk continues to an external tubular holding cell. After the hold, the temperature of the milk is
checked by a sensor in the line. It transmits a continuous signal to the temperature controller in the control panel. The same signal is also transmitted
to a recording instrument which records the pasteurisation temperature.
Flow diversion
A sensor after the holding cell transmits a signal to the temperature monitor.
As soon as this signal falls below a preset value, corresponding to a specified minimum temperature, the monitor switches the flow diversion valve to
diversion flow. In many plants the position of the flow diversion valve is
recorded together with the pasteurisation temperature.
For the location of the flow diversion valve, various solutions are available
to satisfy local regulations and recommendations. Below are three alternatives which are commonly utilised:
1 The flow diversion valve is situated just after the holding cell. Where a
booster pump is installed, the valve is located before the pump. If the temperature drops under preset level the valve diverts the flow to the balance
tank and the pump stops. The flow in the regenerative and cooling sections
thus comes to a standstill (even when no booster pump is integrated).
After a short while, without temperature increase, the heat exchanger is
emptied, cleaned and sanitised. When satisfactory heating is possible the
plant is restarted.
2 The flow diversion valve is located after the cooling section of the plant.
Following a drop of temperature the flow is diverted to the balance tank and
the plant is emptied of product, cleaned and sanitised. The plant is then
ready for restart when the temperature conditions are acceptable again.
3 The flow diversion valve is located between the holding cell and the
boster pump. If the temperature drops the valve diverts the flow. The booster pump is not stopped, but other valves around the heat exchanger will
automatically be positioned so that the milk in the regenerative and cooling
sections will be circulated to maintain the right pressure in the plant. This
also preserves a proper temperature balance. When the heating conditions
are acceptable the process can be resumed without intermediate cleaning.
Cooling
After the holding section the milk is returned to the regenerative section(s)
for cooling. Here the pasteurised milk gives up its heat to the cold incoming
milk. The outgoing pasteurised milk is then chilled with cold water, icewater, a glycol solution or some other refrigerant, depending on the required
Dairy Processing Handbook/chapter 7
195
temperature. The temperature of the chilled milk is normally recorded together with the pasteurisation temperature and the position of the flow
diversion valve. The graph consequently shows three curves.
Centrifugal clarifier
As the milk in the present example is not going to be separated into skimmilk and cream, a centrifugal clarifier is shown in figure 7.6.
Some dairies specify centrifugal clarification of cold (<6°C) raw milk immediately after arrival at the dairy, especially when the milk is going to be
stored until the next day. However, clarification at about 55°C is much more
efficient because the viscosity of the milk is lower at that temperature.
The milk feeding the clarifier is therefore taken from the first regenerative
heating section at 55°C.
Design of piping system
Fig. 7.6 Bowl of a centrifugal clarifier.
Velocity
v m/s
25 mm 38 mm
(1")
(11/2")
3.0
25 mm
(2")
63.5 mm
(21/2")
2.5
2.0
76 mm
(3")
1.5
101.6 mm
(4")
1.0
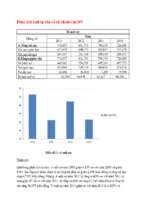
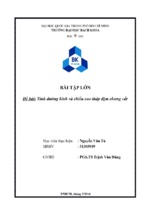
In the example in this chapter, 20 000 litres of milk per hour have to pass
through pipes, fittings and process equipment during production. The product velocity through the pipes is determined by the size of the passage, i.e.
the inside diameter of the pipe. The larger the diameter, the lower the product velocity.
For a flow rate of 20 000 litres per hour, the product velocity in a 76 mm
(3") pipe will be 1.25 m/s. The velocity will be 2.75 m/s if a 51 mm (2") pipe
is selected.
Higher velocities result in greater friction in the liquid itself and between
the liquid and the pipe wall. Consequently there is more mechanical treatment of the product. For each product there is an upper velocity limit that
should not be exceeded if quality demands are to be met. For milk this
velocity is about 1.8 m/s.
It might then seem reasonable to choose a larger pipe size than the
minimum required by velocity considerations. But larger pipes mean larger
components and greatly increased costs. The diameter nearest the limit is
therefore chosen. In our case this is 2.5" (63.5 mm), which corresponds to
a velocity of 1.75 m/s, which can be seen in figure 7.7.
0.5
Laminar and turbulent flows
5000 10 000 15 000 20000 25000 30 000 35 000 40 000
Flow rate Q l/h
Fig. 7.7 Product velocity and flow rate
graph.
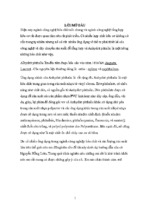
Laminar flow
Laminar flow is a type of flow in which the particles maintain a continuous,
steady motion along parallel paths. This type of flow occurs, for example, in
straight, round pipes or between parallel walls at low velocities.
On the other hand, in turbulent flow the particles have an erratic motion
and intermix intensively with each other.
The length of a line represents the mean velocity of the particles at various points in the section through the passage as illustrated in figure 7.8. In
laminar flow, the velocity is greatest at the centre of the passage. Due to the
friction between the layers, the velocity slows progressively towards the
walls, where it is zero.
In turbulent flow the layers intermix and therefore the velocity of the liquid
is roughly the same in the central part of the passage, but drops rapidly
towards the walls. On the walls a very thin laminar layer of the liquid has
zero instantaneous velocity.
To obtain laminar flow in a round pipe, the diameter must be small, the
velocity low and the viscosity of the liquid high.
Flow resistance
Turbulent flow
Fig. 7.8 Velocity profile diagrams for
laminar and turbulent flows.
196
Every component in the line offers resistance to the flow when a liquid is
forced through a pipe system. In straight pipes the resistance is due to
friction between the liquid and the walls. In bends, additional friction occurs
from the liquid having to change direction. In the same way friction, changes of direction and changes of section result in resistance in fittings, valves
and process equipment. The magnitude of this resistance is relative to the
velocity of the liquid in the system.
Dairy Processing Handbook/chapter 7
The resistance of each component in the line can be obtained from the
resistance coefficient given by the manufacturer. The total resistance of the
line can then be calculated by multiplying the sum of the coefficients by the
square of the flow velocity and dividing the result by 2 g (g = the acceleration due to gravity = 9.81 m/s2 ).
Example: The product velocity in a pipe system is 1.75 m/s (pipe diameter 2.5" and flow rate 20 000 litres/hour). The sum of the resistance coefficients amounts to 190. The flow resistance will be:
1.75 x 1.75 x 190
2 x 9.81
= 29.7 metres liquid column or head
Flow resistance is expressed in terms of the liquid column, or head, needed
to compensate for the loss of pressure due to the resistance. This way of
reckoning dates back to the original application of pumping, which was to
lift water from a low level to a higher level, e.g. from a mine shaft to ground
level. The performance of the pump was judged by the height to which it
could lift the water. In our case the total resistance in the pipe system is
equivalent to the work done by a pump lifting a liquid 30 metres vertically.
This also means that a column of water 30 metres high would exert
enough pressure to overcome the flow resistance, as illustrated in figure
7.9.
30 m
Fig. 7.9 Process line illustrating the
example with a 30-metre head between
tank and process.
Product
Heating medium
Cooling medium
Fig. 7.10 Pressure drop can be shown by pressure guages in the process line.
Pressure drop
The flow resistance of a liquid in a component results in a loss of pressure.
If the pressure is measured with a pressure gauge (figure 7.10) before and
after the component, the pressure will be lower on the discharge side. The
component, for instance a shut-off valve, causes a pressure drop in the line.
This pressure drop, measured in terms of head, is equivalent to the resistance in the component and the magnitude depends on the velocity, in
other words the flow rate and the size of the pipes.
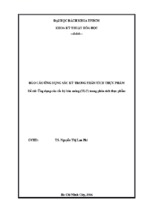
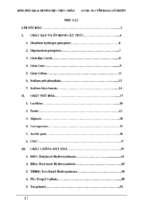
The pressure drop of a component is often stated as the loss of head in
metres for different flow rates instead of the resistance coefficient. The
graph in figure 7.11 covers flow rates from 5 000 litres/hour for the smallest
pipe diameter, 1.5" (38 mm), to 200 000 litres/hour for the largest, 4" (101.6
mm) shut-off valve.
For a flow rate of 20 000 litres/hour and a pipe size of 2.5" (63.5 mm), a
velocity of 1.75 m/s, the graph indicates a pressure drop, or loss of head, of
0.4 metre over the fully open valve.
The pressure drop over each of the components in the line for a given
flow rate can be determined in the same way. These values, added together, then give the total pressure drop for the system.
Every component in the line should be dimensioned to cause the lowest
possible pressure drop. A pressure drop involves an increase in flow velocity, either in the form of turbulence or by local acceleration through passages. Higher velocities result in increased friction at the surfaces of the pipe
and other equipment and greater forces in bends, etc. This increases the
mechanical treatment of the product.
Dairy Processing Handbook/chapter 7
Head
in metres
38
10.0
8.0
7.0
6.0
5.0
4.0
3.0
51 63.5 76 101.6
2.0
1.0
0.8
0.6
0.5
0.4
0.3
0.2
5
30
10
20
50 70 90 150
40 60 80100
200
x 1000 l/h
Fig. 7.11 Pressure-drop graph for a
shut-off valve.
197
In the case of milk this may lead to breakage of the fat globules, exposing the released fat to attack by lipase enzymes. Eventually the resulting
high content of free fatty acids affects the flavour of the milk adversely. This
problem is aggravated if air is present during the mechanical treatment of
the product. This can occur if air is sucked in through leaking unions. For
other products, such as yoghurt, the treatment of the product must be
particularly gentle. The greatest care must be taken in the selection of components as well as in the dimensioning and design of the process line.
The size of the pipes in a system must be such that the velocity of the
liquid does not exceed the critical value for the product (1.8 m/s for milk,
Iower for some other dairy products). The number of valves in the line
should be kept to a minimum and the pressure drop across them should be
as low as possible. They should also be placed so that unnecessary changes of direction are avoided.
Process control equipment
To ensure trouble-free operation and achieve the desired product quality, it
is necessary to maintain quantities such as liquid levels, flows, temperatures, pressures, concentrations and pH values at certain predetermined magnitudes. The
Controller
equipment for monitoring and controlling
these parameters comprises various types of
transmitters, controllers and control equipRegulating
ment. In figure 7.12 a control loop is illustratvalve
ed.
The transmitter is a sensing element which
measures the actual quantity. Its design and
Pressure
Pressure
function vary according to requirements.
indicator
transmitter
Some examples are temperature, pressure
and pH transmitters. The transmitter converts
Pump
the measured value to a pneumatic or electric
Product
signal of corresponding strength. The signal is transmitted to a controller,
which is informed of the instantaneous value of the quantity. This value is
also known as the measured value.
The control device is basically an adjusting device. It is fitted in the process line and can be a variable-speed pump motor or a regulating valve.
Fig. 7.12 Control loop for pressure
The setting of the regulating device – the motor speed or valve plug position
control, consisting of a transmitter, a
– determines the magnitude of the quantity it is controlling. The control
controller and a pneumaticly controlled
device is continuously supplied with a signal (pneumatic or electric) from a
regulating valve.
controller and the strength of this signal determines the setting of the regulating device.
The controller is the “brain” of the control system. It receives the signal
from the transmitter and is thereby continuously informed about the measured value of the quantity in question. The controller then compares this
with a preset reference or setpoint value. The regulator setting is correct if
the two values are the same.
If the measured value changes, the signal from the transmitter changes
accordingly. The measured value no longer equals the required value, and
the controller alters its signal to the control device accordingly. As a result,
the position setting of the control device is adjusted (speed or valve position) to suit. The transmitter immediately senses the change in quantity and
transmits this information to the controller. This cycle of comparison and
correction – the control loop – is repeated until the measured quantity is
once again at the preset value.
Transmitters
Transmitters in control systems vary considerably in design and function.
Some transmitters react directly to changes in the measured value. In the
pressure transmitter, figure 7.13, the pressure of the product on a membrane is transferred, via a capillary pipe, to the sensor. The sensor transmits
an electrical signal that is directly proportional to the product pressure. The
float type level controller, often used in tanks, is another example of a direct
control device.
198
Dairy Processing Handbook/chapter 7
Table 7.1
Variations in resistance with temperature
according to a given characteristic.
Temp.
°C
0
10
20
30
40
50
60
80
100
6
5
Resistance
Ω
100.00
103.90
107.79
111.67
115.54
119.40
123.24
130.89
138.50
4
3
2
1
Fig. 7.13 Pressure transmitter
Most transmitters, however, operate indirectly. They measure the changes in another physical quantity that has a constant relation to the quantity to
be controlled. This type of transmitter has been shown previously in connection with the transport of liquid through the line. The required flow rate is
maintained by measuring the pressure of the product at the pump outlet
and keeping it constant.
The above-mentioned pressure transmitter can also be used to measure
the level in a tank. Installed in the bottom of a tank, it senses the static
pressure of the liquid column above the diaphragm. This pressure is proportional to the depth of the liquid. An electric signal is transmitted to an instrument which indicates the level.
Many types of transmitters utilise the fact that the electrical resistance of
metals varies with temperature in a characteristic manner. One such transmitter is the common temperature transmitter, figure 7.14. A wire of platinum, nickel or other metal is mounted in a protective tube, which is inserted
in the line so that it is heated by the liquid. Table 7.1 shows the resistance
values of a platinum wire at various temperatures.
The resistance can be measured by connecting the metal wire to an
electrical circuit. Any change in the resistance will correspond to a given
change in temperature, and the temperature of the product can therefore
be determined.
The transmitters described above are those most often used in dairies.
There are, however, many other types.
Controllers
The controller in figure 7.15 is the brain of the temperature control system
and the controller is also available in many different forms. According to a
previous definition, it is a device that continuously compares the measured
value with a reference or preset (setpoint) value. Any differential causes the
controller to transmit a corrective signal to the regulating unit, which then
alters its setting accordingly. The corrective process continues until the
measured value and the setpoint value coincide again.
The controller may be of pneumatic or electric type. If the transmitter is
pneumatic and the controller electric, or vice versa, the signals have to go
via a pneumatic/electric converter.
On common controllers there is a knob for setting the required value,
which is indicated by a pointer on the scale. The measured value, the output from the transmitter, can be read on the scale at all times. There is also
a scale showing the output signal to the regulating device.
When set to automatic operation, the instrument needs no manual adjustment. It can be switched to manual control, and then operated by
means of a knob. The controller setting is indicated on the output signal
scale.
Dairy Processing Handbook/chapter 7
1 Nut
2 Process pressure
3 Membrane
4 Capillary pipe
5 Reference pressure
6 Sensor
Fig. 7.14 Resistance type temperature
transmitter
100
R
90
80
L
STORE
M
100
70
L
80
TUNE
60
SET
40
C
60
50
40
20
PROG
30
0
20
10
0
PV % SP
ALFA-LAVAL
SATTCONTROL
Fig. 7.15 Controller
199
Some controllers have a switch function. This means that they can be
set to emit a special signal at a given maximum or minimum value. This
signal can be amplified and used to execute a change in the process.
In our process we wanted the flow diversion valve to recirculate the flow
if the temperature at the outlet of the heat exchanger holding section should
drop below 72°C. A separate preset temperature switch is normally used to
monitor the pasteurising temperature.
This switch is connected to the temperature controller and transmits a
signal via a built-in relay when the temperature drops below the set value. If
the switch is set to operate at 71.9 °C, it will signal as soon as the product
temperature drops to this value. The signal goes via the controller to the
solenoid valve which controls the air supply to the flow diversion valve. The
solenoid valve then breaks the air supply and the valve switches from “forward flow” to “diversion flow”.
The regulating device
2
3
1
Fig. 7.16 Pneumatic regulating valve.
1
2
3
Visual position indicator
Connection for electrical signal
Connection for compressed air
The controller-actuated setting of the regulator determines the magnitude of
the quantity in question. The regulating device may be a variable speed
pump. In that case the output signal from the controller adjusts the speed
of the pump so that the required flow is obtained. However, the most common form of regulating device in dairies is the regulating valve.
A pneumatic regulating valve, shown in figure 7.16, consists primarily of
a body with a seat for the plug, which is attached to the lower end of the
stem. The valve is operated between the open and closed positions by
adjusting the difference in pressure between the upper and lower sides of
the piston. The actuator has a double-acting piston. When the pressure is
higher on the lower side, the piston moves upwards, lifting the plug from its
seat. A higher pressure on top of the piston closes the valve.
Actuation is essentially as follows: pneumatic signals from a controller
are supplied to a proportioning device, a positioner, at the top of the valve.
This positioner ensures that the position of the plug, in relation to the seat,
is always proportional to the strength of the controller signal. When the
signal corresponds to the preset value, the positioner balances the pressures on either side of the piston so that the position of the plug remains
constant. In this balanced condition the pressure drop over the valve is
exactly that required, and the measured value, registered by the transmitter,
coincides with the preset value.
Should the product pressure drop, the transmitter reduces its signal to
the controller. As the measured value now no longer coincides with the
preset value, the controller reacts by increasing its signal to the valve actuator. The positioner then increases the pressure on the upper side of the
piston, moving the plug towards the seat. The resulting increase in the valve
flow resistance increases the product pressure and the reverse cycle of
operations is initiated, retarding the downward movement of the piston.
When the pressure in the line has regained the preset value, the positioner
again holds the valve piston in balance.
Automatic temperature control
In the automatic temperature control system, the thermometer is a resistance-type temperature transmitter fitted in the product line. The control
device is a pneumatically operated regulating valve in the steam line. It is
controlled by a pneumatic controller located in the process control panel.
The required value is set on the controller which then, via the valve, adjusts
the steam supply to the heat exchanger so that the measured value always
equals the preset value of 72°C.
200
Dairy Processing Handbook/chapter 7
Chapter 8
Pasteurised milk products
Pasteurised milk products are liquid products made from milk and cream
intended to be used directly by consumers. This group of products includes whole milk, skimmilk, standardised milk, and various types of
cream.
Cultured products are also included in this category, but as these are
made with special bacteria cultures they are dealt with separately under
chapter 11, “Cultured milk products”.
All the building blocks described in chapter 6 are, in principle, used in
the processing of pasteurised milk products.
Dairy Processing Handbook/chapter 8
201
In most countries clarification, pasteurisation and chilling are compulsory
stages in the processing of consumer milk products. In many countries the
fat is routinely homogenised, while in others homogenisation is omitted
because a good “cream-line” is regarded as evidence of quality. De-aeration
is practiced in certain cases when the milk has a high air content, and also
when highly volatile off-flavour substances are present in the product. This
may occur for example if cattle feed contains plants of the onion family.
Processing of market milk products requires first-class raw material and
correctly designed process lines if end products of highest quality are to be
attained. Gentle handling must be ensured so that the valuable constituents
are not adversely affected.
As to milk quality, the microbiological standards for intra-Community
trade in milk within Europe, set by the Council of the European Union (EU)
to safeguard human and animal health, are shown in Table 8. 1.
Table 8.1
EU standards for bacteria count in milk,
in force from 1 January 1993
Product
Raw milk
Raw milk stored in silo at the
dairy for more than 36 hours
Pasteurised milk
Pasteurised milk after incubation
for 5 days at 8°C
UHT and sterilised milk after
incubation for 15 days at 30°C
Plate count (CFU/ml)
< 100 000
< 200 000
< 30 000
< 100 000
< 10
CFU = Colony Forming Units
Another measure of raw milk quality is the amount of somatic cells that can
be tolerated in raw milk. Somatic cell count is used as a criterion for ascertaining abnormal milk. Generally the EU directive states that milk is considered normal at somatic cell counts of 250 000 to 500 000 somatic cells
per ml. This standard has been tightened from January 1994; raw milk
intended for intra-community trade must not contain more than 400 000
somatic cells per ml.
Processing of
pasteurised market milk
Depending on legislation and regulations, the design of process lines for
pasteurised market milk varies a great deal from country to country and
even from dairy to dairy. For instance, fat standardisation (if applied) may be
pre-standardisation, post-standardisation or direct standardisation. Homogenisation may be total or partial, etc.
The “simplest” process is just to pasteurise the whole milk. Here the
process line consists of a pasteuriser, a buffer tank and a filling machine.
The process becomes more complicated if it has to produce several types
of market milk products, i.e. whole milk, skimmilk and standardised milk of
various fat contents as well as cream of various fat contents.
202
Dairy Processing Handbook/chapter 8
The following assumptions apply to the plant described below:
• Raw milk
– fat content 3.8%
– temperature +4°C
• Standardised milk
– fat content 3.0%
– temperature +4°C
• Standardised cream
– fat content 40%
– temperature +5°C
• Plant capacity
– 20,000 l per hour
– 7 hours per day
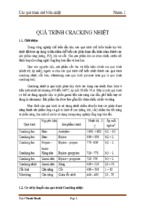
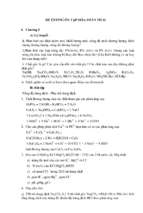
Figure 8.1 shows a typical process flow in a market milk line. The milk enters the plant via balance tank (1) and is pumped to plate heat exchanger
(4), where it is preheated before it continues to separator (5), which produces skimmilk and cream.
Milk
Cream
Skimmilk
Standardised milk
Heating medium
Cooling medium
Diverted flow
13
4
15
14
12
7
11
6
1
9
2
7
9
10
7
5
8
16
3
The standardisation of market milk takes place in an in-line system of the
type already described in chapter 6.2. The fat content of the cream from the
separator is set to the required level and is then maintained at that level,
regardless of moderate variations in the fat content and in the flow rate of
the incoming milk. The fat content of the cream is usually set at 35 to 40%
for whipping cream, but can be set at other levels, e.g. for production of
butter or other types of cream. Once set, the fat content of the cream is
kept constant by the control system, consisting of flow transmitter (7), density transmitter (8), regulating valves (9) and the control system for the
standardisation system.
Dairy Processing Handbook/chapter 8
Fig. 8.1 Production line for market
milk with partial homogenisation.
1
2
3
4
5
6
7
8
9
10
11
12
13
14
15
16
Balance tank
Product feed pump
Flow controller
Plate heat exchanger
Separator
Constant pressure valve
Flow transmitter
Density transmitter
Regulating valve
Shut-off valve
Check valve
Homogeniser
Booster pump
Holding tube
Flow diversion valve
Process control
203
The purpose of standardisation
is to give the milk a defined,
guaranteed fat content.
In this example partial homogenisation is used, i.e. only the cream is
treated. The reason for choosing this system is that it can manage with a
smaller homogeniser (12) and thus consume less power while still maintaining a good homogenisation effect.
The working principle of the system, also described in chapter 6.3, will
be: After passage of the standardisation device the flow of cream is divided
into two streams. One, with the adequate hourly volume to give the market
milk the required final fat content, is routed to the homogeniser and the
other, the surplus cream, is passed to the cream treatment plant. As the fat
content of the cream to be homogenised should be max. 10%, the ordinary
cream of, say 40%, must be "diluted" with skimmilk prior to homogenisation. The capacity of the homogeniser is carefully calculated and fixed at a
certain flow rate.
In a partial homogenisation arrangement the homogeniser is also connected with the skimmilk line so that it always has enough product for proper operation. In that way, the relatively low flow of cream is compensated
with skimmilk up to the rated capacity. Following homogenisation, the 10%
cream is eventually mixed in-line with the surplus volume of skimmilk to
achieve 3% before pasteurisation. The milk, now with standardised fat content, is pumped to the heating section of the milk heat exchanger where it is
pasteurised. The necessary holding time is provided by a separate holding
tube (14). The pasteurisation temperature is recorded continuously.
Pump (13) is a booster pump which increases the pressure of the product to a level at which the pasteurised product cannot be contaminated by
untreated milk or by the cooling medium if a leak should occur in the plate
heat exchanger.
If the pasteurisation temperature should drop, this is sensed by a temperature transmitter. A signal activates flow diversion valve (15) and the milk
flows back to the balance tank. See also chapter 7.
After pasteurisation the milk continues to a cooling section in the heat
exchanger, where it is regeneratively cooled by the incoming untreated milk,
and then to the cooling section where it is cooled with ice water. The cold
milk is then pumped to the filling machines.
Standardisation
The purpose of standardisation is to give the milk a defined, guaranteed fat
content. The level varies considerably from one country to another. Common values are 1.5% for low-fat milk and 3% for regular-grade milk, but fat
contents as low as 0.1 and 0.5 % also occur. The fat is a very important
economic factor. Consequently, the standardisation of milk and cream must
be carried out with great accuracy.
Some options applicable to continuous fat standardisation are discussed
in chapter 6.2, “Centrifugal machines and milk fat standardisation systems”.
Pasteurisation
Along with correct cooling, pasteurisation is one of the most important
processes in the treatment of milk. If carried out correctly, these processes
will supply milk with longer shelf life.
Temperature and pasteurisation time are very important factors which
must be specified precisely in relation to the quality of the milk and its shelflife requirements, etc. The pasteurisation temperature for homogenised,
HTST pasteurised, regular-grade milk is usually 72 – 75°C for 15 – 20 sec.
The pasteurisation process may vary from one country to another according to national legislation. A common requirement in all countries is that
the heat treatment must guarantee the destruction of unwanted microorganisms and of all pathogenic bacteria without the product being damaged.
Homogenisation
Homogenisation has already been discussed in chapter 6.3. The purpose of
homogenisation is to disintegrate or finely distribute the fat globules in the
204
Dairy Processing Handbook/chapter 8
milk in order to reduce creaming. Homogenisation may be total or partial.
Partial homogenisation is a more economical solution, because a smaller
homogeniser can be used.
Determining homogenisation efficiency
Homogenisation must always be sufficiently efficient to prevent creaming.
The result can be checked by determining the homogenisation index,
which can be found in the manner decsribed in the following example:
A sample of milk is stored in a graduated measuring glass for 48 hours
at a temperature of 4 – 6°C. The top layer (1/10 of the volume) is siphoned
off and the remaining volume (9/10) is thoroughly mixed, and the fat content
of each fraction is then determined. The difference in fat content between
the top and bottom layers, expressed as a percentage of the top layer, is
referred to as the homogenisation index.
An example: If the fat content is 3.15% in the top layer and 2.9% in the
bottom layer, the homogenisation index will be (3.15 – 2.9) x 100: 3.15 =
7.9. The index for homogenised milk should be in the range of 1 to 10.
Quality maintenance of pasteurised
milk
Due to its composition, milk is highly susceptible to bacterial and chemical
(copper, iron, etc.) contamination as well as to the effects of exposure to
light, particularly when it is homogenised.
It is therefore most important to provide good cleaning (CIP) facilities for
the plant and to use detergents, sanitisers and water of high quality.
Once packed, the product must be protected from light – both daylight
and artificial light. Light has a detrimental effect on many nutrients. It can
also affect the taste.
Table 8.2
Losses of taste and vitamins at an exposure of 1 500 Lux
Carton
Taste
no loss
Vitamin
C
Bottle
Vitamin
B2
–1 %
– 1.5%
–2 %
– 2.5%
– 2.8%
–3 %
– 3.8% no loss
Hours
Taste
2
3
4
5
6
8
12
little
evident
strong
strong
strong
strong
Vitamin
C
– 10%
– 15%
– 20%
– 25%
– 28%
– 30%
– 38%
Vitamin
B2
– 10%
– 15%
– 18%
– 20%
– 25%
– 30%
– 35%
Measured by the Dairy Science Institute at the Justus Liebig University in Giessen, Germany, in 1988.
Sunlight flavour originates from the protein in milk. Exposure to light
degrades the amino acid methionine to methional. Ascorbic acid (vitamin C)
and riboflavin (vitamin B2 ) play a significant part in the process, and oxygen
must also be present. Methional has a characteristic taste; some people
compare it to cardboard, others to emery. This flavour does not occur in
sterilised milk, which is always homogenised, probably because vitamin C is
degraded by heat and the S – H components of the whey proteins undergo
chemical changes.
Table 8.2 shows the influence of light on pasteurised milk in a transparent glass bottle and in a carton. The first vitamin losses take place when
the milk in the transparent glass bottle has been exposed to 1500 Lux – an
average lighting value – for only two hours. In the opaque carton there is
only a minor loss.
Dairy Processing Handbook/chapter 8
205
After 4 hours’ exposure there is already an evident change of flavour in
bottled milk, but not in the cartoned product.
Shelf life of pasteurised milk
Milk
Cream
Skimmilk
Permeate
Retentate
Cream/retentate mixture
Heating medium
1
Cooling medium
Steam
The shelf life of pasteurised milk is basically and always dependent on the
quality of the raw milk. Naturally it is also most important that production
conditions are technically and hygienically optimised, and that the plant is
properly managed.
When produced from raw milk of sufficiently high quality and under good
technical and hygienic conditions, ordinary pasteurised milk should have a
shelf life of 8 – 10 days at 5 – 7°C in an unopened package.
The shelf life can however be drastically shortened if the raw milk is contaminated with micro-organisms such as species of Pseudomonas that
form heat-resistant enzyme systems (lipases and proteases), and/or with
heat-resistant bacilli such as B. cereus and B. subtilis which survive pasteurisation in the spore state.
To improve the bacteriological status of pasteurised milk and thereby
safeguard or even prolong its shelf life, the pasteurisation plant can be supplemented with a bactofugation or a microfiltration plant.
2
7
4
Fig. 8.2 Milk processing
including a microfiltration, MF, plant.
1
2
3
4
5
6
7
Balance tank
Pasteuriser
Separator
Standardisation unit
Plate heat exchanger
Microfiltration unit
Homogeniser
3
5
6
The bactofugation process is based on centrifugal separation of microorganisms; although the reduction effect of two-stage centrifugation on
bacteria spores is up to >99 % (see chapter 14, Cheese), this is not considered good enough for pasteurised market milk if extended shelf life at up to
7°C is required.
Reduction effects of up to 99.5 – 99.99% on bacteria and spores can be
achieved with microfilter membranes of pore sizes of 1.4 µm or less. A
general flowchart for milk treatment including microfiltration is illustrated in
figure 8.2.
206
Dairy Processing Handbook/chapter 8
Since the small pore sizes needed for effective retention of bacteria and
spores also trap milk fat globules, the MF module is fed with skimmilk. In
addition to the MF unit the plant contains a high temperature treatment unit
for the mixture of the cream phase and bacteria concentrate (retentate),
which after heat treatment is remixed with the permeate, the processed
skimmilk phase.
The cream and retentate phase are sterilised at about 130°C for a
couple of seconds. After re-mixing with the microfiltered skimmilk phase,
the product is homogenised and finally pasteurised at 72°C for 15 – 20
seconds and cooled to +4°C.
The plant shown in figure 8.2 can handle up to 10 000 litres of raw milk
per hour. After separation, the skimmilk is routed to the MF module. Part of
the cream, typically of 40% fat content, is remixed with the skimmilk to
produce fat-standardised pasteurised market milk while the surplus cream
is separately processed. The proportions of remixed and surplus cream
depend on the specified fat content of the market milk.
About 5% of the feed leaves the MF module as retentate, the bacteriarich phase. The total solids content of the retentate averages 9 – 10%, of
which some 3.9% is protein (including protein from the micro-organisms)
and some 0.25% fat.
In the plant shown here the whole milk flow is homogenised, but partial
homogenisation is also possible.
Milk treated in this way will keep its fresh flavour and white colour. Moreover, if strictly hygienic conditions are maintained in the plant, from reception of the raw milk up to and including the packaging and filling system, the
foundation of a long shelf life is laid. If the milk is kept at a temperature of
not more than 7°C during the whole chain from the dairy via the retailer to
the consumer, it is possible to attain a shelf life of up to 40 – 45 days in an
unopened package.
The shelf life of pasteurised
milk is basically and always
dependent on the quality of the
raw milk.
“ESL” milk
The term “Extended Shelf Life”, ESL, is frequently applied in Canada and
the USA to fresh liquid products of good keeping quality at +7°C and below. The expression ESL and the idea behind it have now also spread to
Europe and other continents.
There is no single definition of ESL, as it is a concept involving many
factors. What it means in essence is the ability to extend the shelf life of a
product beyond its traditional life by reducing the major sources of reinfection and maintaining the quality of the product all the way to the consumer.
A typical temperature/time program is 125 – 130°C for 2 – 4 seconds.
This type of heat treatment is also called ultrapasteurisation.
Production of cream
Cream for sale to consumers is produced with different fat contents.
Cream of lower fat content, 10 – 18%, is often referred to as half cream or
coffee cream; it is increasingly used for desserts and in cooking. Cream with
a higher fat content, typically 35 – 40 %, is usually considerably thicker. It
can be whipped into a thick froth and is therefore referred to as “whipping
cream”. Whipping cream is used whipped or unwhipped as a dessert, for
cooking, etc.
Whipping cream
In addition to tasting good and keeping well, whipping cream must also
have good “whippability”, i.e. it must be easy to whip and produce a fine
cream froth with a good increase in volume (overrun). The froth must be firm
and stable, and must not be susceptible to syneresis. Good whippability
depends on the cream having a sufficiently high fat content. Whipping
Dairy Processing Handbook/chapter 8
207
cream with 40% fat is usually easy to whip, but the whippability decreases
as the fat content drops to 30% and below. However, it is possible to produce good whipping cream with a low fat content (about 25%) by adding
substances which improve whippability, e.g. powder with a high lecithin
content made from sweet buttermilk.
Unintentional air inclusion must be avoided in the manufacture of the
cream. Air pickup leads to formation of froth and destabilisation. If cream is
subjected to excessive mechanical treatment, especially just after it has left
the cooling section, the fat-globule membranes will be damaged, resulting
in fat amalgamation and formation of clusters. Creamlining takes place
when roughly treated cream is stored in the pack. The layer of cream will be
dense and sticky. This “homogenisation effect” greatly impairs the whipping
characteristics of the cream.
Air is intentionally beaten into cream when it is whipped. This produces a
froth full of small air bubbles. The fat globules in the cream collect on the
walls of these air bubbles. Mechanical treatment destroys the membranes
of many fat globules, and a certain amount of liquid fat is liberated. This fat
makes the globules stick together.
The fat globules must contain the correct proportions of liquid and crystallised fat in order to obtain a firm froth. Warm cream contains liquid fat,
which makes whipping impossible. Cream for whipping must therefore be
stored at a low temperature (4 – 6°C) over a relatively long period of time to
obtain proper crystallisation of the fat. This storage period is called ripening
time. Cream is usually ripened in jacketed process tanks with scraper agitators. Heat is released during crystallisation. However, cooling and agitation
should not start until about two hours after the process tank has been filled.
The reason is that during this period of fat crystallisation the fat globules can
easily be split, releasing free fat and causing lump (cluster) formation. At
cooling the agitation must be gentle. See also figure 8.4 concerning the
progress of crystallisation of 40% cream. Slightly lower final temperatures
can be used in the summer, when the milk fat is usually softer than during
the winter.
The whipping method
The best whipping result is obtained when the temperature of the cream is
below 6°C. The whipping bowl and instrument should also be correctly
proportioned in relation to one another so that whipping is completed as
quickly as possible. Otherwise the temperature may rise appreciably during
whipping, resulting in an inferior froth (butter may be formed in the worst
case).
Fig. 8.3 Test of leakage of whipped cream after 2 hours at 18–20 °C and 75% R.H.
208
Dairy Processing Handbook/chapter 8
Whipping time and increase of the volume, overrun, are two criteria that
should be measured to check whipping properties. An adequate whipping
bowl (holding 1 litre) and instrument (preferably an electric beater) are required for this test. A suitable volume of cream (say 2 dl) is cooled to +6°C
±1°C and then poured into the bowl.
The height of cream is measured before whipping starts. The beater is
stopped when the froth has reached acceptable firmness (which means
that it will not start to run when the bowl is inverted).
Whipping time is measured with a stopwatch, which is started and
stopped simultaneously with the beater.
The height of the whipped cream is measured to establish the overrun. If
for instance the height was 5 cm initially and is 10.5 cm after whipping, the
overrun will be (10.5 – 5) x 100 – 5 = 110%.
With 40% cream the whipping time should be about 2 minutes and the
overrun between 100 and 130 %.
The quality of the froth is measured by the leakage of liquid after 2 hours
at 18 – 20°C and 75% R.H.
Directly after whipping and measurement of overrun, all the whipped
cream is placed on a plane metal net. The froth is formed as shown in figure
8.3. and the net is placed over a funnel of adequate size, which in turn is
placed over a graduated measuring glass. The amount of liquid that has
accumulated in the glass is read off after two hours’ storage at the abovementioned temperature and humidity. The judgement criteria are:
0-1 ml
very good
1-4 ml
good
> 4 ml
not so good
The whipping-cream production line
The Scania method
The process stages in the manufacture of whipping cream include heating
of the whole milk to separation temperature, 62 – 64°C, separation and
standardisation of the cream fat content to the required value, and pasteurisation and chilling of the cream in a heat exchanger before it continues to a
process tank for ripening.
Treatment of cream with a high fat content involves several problems
which must be carefully considered when the process line is designed. The
most serious problem is how to avoid shearing and turbulence during crystallisation of the fat. The fat in the globules is in liquid form at higher
temperatures, and fat globules seem to be unaffected by treatment at temperatures above 40°C.
The fat starts to crystallise as soon as cooling begins in the process line.
This is a fairly slow process; some crystallisation still continues after four or
five hours. Crystallised fat has a lower specific volume than liquid fat, so
°C
Cryst. fat
%
70
60
50
40
30
Cooling
20
10
5
10
15
20
Dairy Processing Handbook/chapter 8
25
30
35
40
45
50
55
60
120 min
Fig. 8.4 The crystallisation process for
40% cream at 8 °C.
209
tension forces are generated in the fat globules during crystallisation. This
makes the fat globules very sensitive to rough treatment at 10 – 40°C.
The progress of crystallisation of 40% cream cooled to 8°C is illustrated
in figure 8.5. The cream must not be agitated while the processing tank is
being filled. Agitation and cooling start about two hours after the tank has
been filled.
Crystallisation releases heat of fusion, causing the temperature to rise by
2 – 3°C. Final cooling in the processing tank is absolutely essential. The
cream is normally cooled to 6°C or even lower. The fat globules seem to be
less sensitive to rough treatment at these temperatures, but they are still
more sensitive than at temperatures above 40°C.
The biggest problem in processing whipping cream is the formation of
clusters, which reduce the emulsion stability of the cream. Clusters occur
when fat globules with partly crystallised fat and weak membranes are
subjected to rough mechanical treatment. Reduced emulsion stability of
cream is responsible for product defects in whipping cream such as cream
plugs in containers, reduced whippability and lipolysis.
Fig. 8.5 Production line for whipping
cream according to the Scania method.
1
2
3
4
5
6
7
6
Holding tank
Product pump
Pasteuriser
Booster pump
Holding tube
Ripening tanks
Product pump
7
3
5
1
2
4
Cream
Heating medium
Cold water
Ice water
Figure 8.5 shows a process in which great care has been taken to eliminate rough treatment of the whipping cream. This method, developed by
Alfa Laval in collaboration with some Swedish dairy co-operatives, is called
the Scania method. The standardised cream may have come from a dedicated cream production line, or may be surplus cream from a market milk
production line of the type shown in figure 8.1. In either case the separation
temperature should be 62 – 64°C to guarantee the highest possible cream
quality (lowest amount of free fat).
The standardised cream is fed from above to a holding tank (1) at separation temperature. The optimum holding time in the tank is 15 – 30 minutes
before pasteuration starts. The flow rate at pasteuration shold be very close
to the average rate of infeed to the holding tank. This makes it possible to
collect small flows of surplus cream in the holding tank over a period of
time, ensuring minimum mechanical agitation of the cream.
The holding tank has no agitator, and about 50% of the air content in the
cream is naturally eliminated there. Volatile off-flavours are removed at the
same time, and the risk of fouling in the pasteuriser is reduced. Holding the
cream at about 63°C in the tank inactivates most lipase enzymes and stops
hydrolysis of free fat. The maximum holding time, including filling and emp-
210
Dairy Processing Handbook/chapter 8
tying, should be about four hours. For longer production runs, two holding
tanks should be installed and used alternately, with intermediate cleaning of
one tank while the other is in use.
From the holding tank the cream is pumped to a regenerative heating
section in the heat exchanger (3). The booster pump (4) then pumps the
cream through the heating section and holding tube (5). Since pumping
takes place at a high temperature (over 60°C), at which the cream is less
sensitive to mechanical treatment, both product pump (2) and booster
pump (4) can be centrifugal pumps.
After pasteurisation, typically above 80 – 95°C for up to 10 seconds, the
cream is pumped to the cooling sections in the heat exchanger where it is
concurrently cooled to 8°C in the deep cooling section before continuing to
the ripening tanks (6). Cooling in the heat exchanger to an average temperature of 8°C seems to be optimum for cream with a fat content of 35 –
40%. At higher fat contents, higher cooling temperatures must be used to
prevent the cream from clogging the cooling section due to rapidly increasing viscosity. This produces a sharp rise in the pressure drop over the cooling section, which in turn causes damage to the fat globules and possibly
even leakage of butteroil from that section. The process must then be
stopped and the system flushed out, cleaned and restarted.
Because of the instability of the freshly chilled fat globules, shearing and
turbulence should be avoided (no pump and adequately dimensioned piping) during transportation from the cooling section of the heat exchanger to
the processing tank for final cooling and fat crystallisation. The pressure for
this transport must therefore be provided by the booster pump.
After ripening, the cream is pumped to the packaging machines. The
temperature is now low, and most of the milk fat is crystallised, which
means that the cream is now less sensitive to mechanical treatment. A
frequency-controlled centrifugal pump can be used at low pressure drops,
up to 1.2 bar, provided that a pressure transmitter is also integrated into the
system. Lobe rotor pumps running at max. 250 – 300 rpm are recommended at pressure drops from 1.2 – 2.5 up to 3 bar.
Half and coffee cream
Cream containing 10 – 18 % fat is characterised as half or coffee cream.
Figure 8.6 shows a process line for half cream. Untreated milk from the
storage tanks is heated regeneratively in the heat exchanger to separation
temperature, 62 – 64°C. The milk then flows to the separator for separation
to skimmilk and cream with the required fat content, usually 35 – 40%.
The treatment of the cream is the same as described for whipping
cream, with the exception that the half cream is mixed with skimmilk to
obtain the required fat content. The cream is homogenised.
Fig. 8.6 Production line for half and
coffee cream
1 Fat standardisation tank
2 Product pump
3 Plate heat exchanger
4 Homogeniser
5 Holding tube
3
5
4
1
2
Dairy Processing Handbook/chapter 8
Cream
Skimmilk
Heating media
Cold water
Ice water
211
Table 8.3
Viscosity test; increasing homogenising pressure at 57°C
Homogenising pressure
MPa
Cream viscosity
seconds
10
15
20
18
28
45
The mixing of cream and skimmilk is done with a metering pump which
injects the skimmilk into the cream line. The cream temperature is then
adjusted to homogenising temperature.
After homogenisation the cream is returned to the heat exchanger,
where it is pasteurised at 85 – 90°C for 15 – 20 seconds before being
cooled to about 5°C and packed.
Two principal requirements must be met in production of cream:
• The cream should be viscous, to convey a more appetizing impression.
• The cream should have good coffee stability. It must not flocculate
when poured into hot coffee.
Cream with a low fat content has a relatively low viscosity and is not of the
consistency normally wanted by customers. It is necessary to select the
correct temperature and pressure for homogenisation to give the cream the
correct viscosity.
The viscosity of cream increases with increasing homogenising pressure
and is reduced by a temperature increase. The cream viscosity in Table 8.3
can be obtained by keeping the homogenising temperature constant at
about 57°C and homogenising the cream at three different pressures: 10;
15 and 20 MPa (100, 150 and 200 bar). The viscosity is measured with a
SMR viscosity meter, described in chapter 11, Cultured milk products. The
longer the time, in seconds, for the cream to flow through the meter, the
higher the viscosity. Cream which has been homogenised at 20 MPa has
the highest viscosity.
Table 8.4
Viscosity test; effect of homogenising temperature
at 15 MPa
Homogenising temp.
°C
Viscosity
seconds
35
50
65
49
35
10
Table 8.4 shows the viscosity if the homogenising temperature is varied
at a constant homogenising pressure of 15 MPa.
The viscosity of cream decreases with increasing homogenising temperature, which should consequently be as low as possible. The fat must however be liquid to achieve the homogenising effect. This means that the homogenising temperature should not be below 35°C.
The coffee stability of cream can be affected considerably by the homogenising conditions – temperature, pressure and position of the homogeniser (upstream or downstream of the heat exchanger).
212
Dairy Processing Handbook/chapter 8
The coffee stability of cream can be improved to a certain extent by
adding sodium bicarbonate (max. 0.02%), if legally permitted. Coffee stability is a certain kind of thermal stability and is a complicated question, involving several factors:
• The temperature of the coffee; the hotter the coffee, the more easily the
cream will flocculate.
• The type of coffee and the manner in which it is prepared; the more acid
the coffee, the more easily the cream will flocculate.
• The hardness of the water used to make the coffee; cream will flocculate
more readily in hard water than in soft water, as calcium salts increase
the ability of the proteins to coagulate.
Packaging
The principal and fundamental functions of packaging are
- to enable efficient food distribution
- to maintain product hygiene
- to protect nutrients and flavour
- to reduce food spoilage and waste
- to increase food availability
- to convey product information
Glass bottles for milk were introduced back at the beginning of the 20th
century. As a package, glass has some disadvantages. It is heavy and fragile, and must be cleaned before re-use, which causes some problems for
dairies. Since 1960 other packages have entered the milk market, mainly
paperboard packages but also plastic bottles and plastic pouches.
A package should protect the product and preserve its food value and
vitamins on the way to the consumer. Liquid foods tend to be perishable, so
a clean, non-tainting package is absolutely essential. The package should
also protect the product from mechanical shock, light and oxygen. Milk is a
sensitive product; exposure to daylight or artificial light destroys some essential vitamins and has a deleterious effect on the taste (sunlight flavour,
see table 8.2).
Other products, such as flavoured milk, contain flavouring matter or
vitamins that are oxygen-sensitive. The package must therefore exclude
oxygen.
A milk carton usually consists of paperboard and plastic (polyethylene).
Paperboard comes from wood, which is a renewable resource. The paperboard gives stiffness to the packages as well as making them resistant to
mechanical stress. The paperboard also serves to some extent as a light
barrier.
A thin layer of food-grade polyethylene on either side of the paperboard
makes the cartons leakproof. On the outside, the plastic also protects the
cartons from condensation when chilled products are taken out of storage.
Because of its purity, this polyethylene produces minimal environmental
impact when incinerated or deposited in landfills.
For products with a long non-refrigated shelf life and very sensitive products, a thin layer of aluminium foil is sandwiched between layers of polyethylene plastic. This gives almost complete protection of the product
against light and atmospheric oxygen.
All packages end up as waste. The growing volume of household waste
could become an environmental problem in our society. Ways of tackling
this problem can be summarized in principle under five headings :
• Reduction. Reducing the input of raw materials and choosing materials
that are not environmentally harmful helps to conserve natural resources.
• Recycling. Packages can be collected after use and used again. How
ever, it should be remembered that even a refilled package ultimately
ends up as waste.
• Recovery of materials. Packages can be collected and the materials
used to manufacture new products, but it is important that the new
products meet a real need.
Dairy Processing Handbook/chapter 8
Functions of packaging:
• to enable efficient food
distribution
• to maintain product hygiene
• to protect nutrients and
flavour
• to reduce food spoilage and
waste
• to increase food availability
• to convey product
information
213
• Recovery of energy. All packages incorporate energy, which can be
extracted when the waste is incinerated. The potential yield depends on
the type of packaging material.
• Landfill. Waste can be deposited as landfill and the area can ultimately
be landscaped for recreational or other purposes.
Paperboard packages have a very low weight, and their main component
comes from a source that is renewable. Compared to most other packages, the amount of waste generated is small. A one-litre Tetra Brik pack
weighs 27 g and generates only that amount of waste.
Paperboard packages are highly suitable for energy recovery. Wood and
oil (the raw material for the plastic) are conventional sources of energy, and
it can be said that we simply borrow these raw materials for packages before using them as fuel. The incineration of two tons of packaging material
yields as much energy as one ton of oil.
Waste as landfill is the least efficient form of waste managament. However, if Tetra Pak packages are deposited in this way, there are no toxic
substances in them which could contaminate ground water.
214
Dairy Processing Handbook/chapter 8
- Xem thêm -