Ministry of Education and Training
University of Economics HoChiMinh City
----------------
Nguyễn Thanh Trung
MEASURING CUSTOMER-BASED BRAND EQUITY
OF ENGLISH TRAINING CENTERS:
EVIDENCE IN HOCHIMINH CITY
ECONOMICS MASTER THESIS
HoChiMinh City - 2009
1
Ministry of Education and Training
University of Economics HoChiMinh City
----------------
Nguyễn Thanh Trung
MEASURING CUSTOMER-BASED BRAND EQUITY
OF ENGLISH TRAINING CENTERS:
EVIDENCE IN HOCHIMINH CITY
Major:
Business Administration
Major Code:
60.34.05
ECONOMICS MASTER THESIS
Supervisor: Dr. Trần Hà Minh Quân
HoChiMinh City - 2009
1
Acknowledgement
I would like to express my heartfelt gratitude and deepest appreciation to my
research Supervisor, Dr. Tran Ha Minh Quan for his precious guidance, share of
experience, ceaseless encouragement and highly valuable suggestions throughout the
course of my research.
I would like to extend my sincere thanks to Assistant Prof. Nguyen Dinh Tho, the
chairman of the proposal examination committee and Dr. Vo Thi Quy, member of the
proposal examination committee, for their valuable comments and constructive
suggestions.
My special gratitude is extended to all instructors and staff at Faculty of Business
Administration and Postgraduate Faculty, University of Econimics HoChiMinh City
(UEH) for their support and the valuable knowledge during my study in UEH.
I would also like to avail this opportunity to express my appreciation to Professor
Nguyen Dong Phong and UEH Board of Directors for creating MBA program in English.
Specially, my thanks also go to Lecturer Ms Ly Thi Minh Chau for her comments
of English from early draft of my thesis.
Many thanks to Ms. Dang Hai Yen, Mr. Lam Hong Phong, as well as the other
classmates in MBA class, Batch 16 for their valuable and enthusiastic support for this
research study.
Last but not least, the deepest and most sincere gratitude go to my beloved
parents, my wife, my sons, my nieces, my nephews and my closest friends for their
boundless support, abundant love and encouragement throughout my period of study. I,
therefore, dedicate this work as a gift to them all.
2
Abstract
Strong brand equity is significantly correlated with success for English
Training Centers (ETC). In a study 318 respondents gauged the strength of four
ETC brands doing business in HoChiMinh City, Vietnam. The internal
relationship between the individual dimensions of customer-based brand equity
(CBBE) and applicability of the suggested CBBE scale on the ETC industry have
been examined in this study. One unusual finding was that five component
perceived quality scale of Parasuraman (1988) is not applicable. A perceived
quality scale including only two components: tangibles and assurance was
suggested and the assurance component dominated on the relationship to brand
loyalty. One other unusual finding was that although brand equity comprises all
four dimensions being tested, awareness showed the smallest and non-significant
effect on brand loyalty. Dividing the ETCs into high tuition fee group and low
tuition fee group, the researcher found that learners differentiated all four
dimensions of CBBE between the two groups. The most of attributes of
dimensions had significant mean diference, while other attributes did not.
Keywords: brand equity; brand image; brand loyalty; brand awareness;
perceived quality; assurance; tangibles; English training center
3
Contents
Acknowledgement ......................................................................................................... 1
Abstract.......................................................................................................................... 2
Contents ......................................................................................................................... 3
List of Tables ................................................................................................................. 5
List of Figures................................................................................................................ 6
Chapter 1: Introduction ............................................................................................... 7
1.1 Introduction............................................................................................................... 7
1.2 Research background ................................................................................................ 8
1.3 Research questions.................................................................................................. 12
1.4 Scope and Limitation .............................................................................................. 14
1.5 Research method..................................................................................................... 15
1.6 Implications of research.......................................................................................... 16
1.7 Structure of the study .............................................................................................. 17
Chapter 2. Literature Review .................................................................................... 19
2.1 Introduction............................................................................................................. 19
2.2 Branding.................................................................................................................. 20
2.3 Brand equity............................................................................................................ 22
2.3.1 Aaker’s conceptualization of brand equity ..................................................... 26
2.3.2 Keller’s conceptualization of brand equity ..................................................... 28
2.4 The measurement of Customer-Based Brand Equity.............................................. 30
2.4.1 Brand awareness ............................................................................................. 31
2.4.2 Brand image .................................................................................................... 32
2.4.3 Brand loyalty................................................................................................... 33
2.4.4 Perceived quality............................................................................................. 33
2.5 Relationships between brand loyalty and other dimensions of CBBE ................... 34
2.6 Summary ................................................................................................................. 36
Chapter 3. Methodology............................................................................................. 38
3.1 Introduction............................................................................................................. 38
3.2 Research design ...................................................................................................... 40
3.3 Generation items ..................................................................................................... 42
3.3.1 Introduction..................................................................................................... 42
3.3.2 Operationalization of measures....................................................................... 43
3.4 Preliminary study .................................................................................................... 46
3.5 Main study .............................................................................................................. 50
3.5.1 Sample design ................................................................................................. 50
3.5.2 Survey method ................................................................................................ 53
4
3.5.3 Data analysis techniques ................................................................................. 53
3.6 Conclusion .............................................................................................................. 54
Chapter 4. Research results ....................................................................................... 55
4.1 Introduction............................................................................................................. 55
4.2 Descriptive statistics of sample............................................................................... 56
4.2.1 Final sample .................................................................................................... 56
4.2.2 Characteristics of sample ................................................................................ 56
4.2.3 Descriptive statistics ....................................................................................... 58
4.3 The construct measurement scales.......................................................................... 61
4.4 The assessment of customer-based ETC brand equity construct............................ 70
4.5 The assessment of the hypotheses........................................................................... 71
4.5.1 Brand equity rating ......................................................................................... 71
4.5.2 Testing hypotheses.......................................................................................... 72
Chapter 5. Conclusion and Implication .................................................................... 85
5.1 Introduction............................................................................................................. 85
5.2 Conclusions from the research questions................................................................ 87
5.3 Discussion of the research findings ........................................................................ 92
5.4 Contributions of the research findings.................................................................... 94
5.4.1 Theoretical contribution.................................................................................. 94
5.4.2 Methodological contribution........................................................................... 96
5.5 Implications of the research .................................................................................... 97
5.6 Limitations of the research and further research..................................................... 99
5.7 Conclusion .............................................................................................................. 99
List of References...................................................................................................... 101
Appendix 1................................................................................................................. 106
5
List of Tables
Table 1. 1 The structure of the study ................................................................................ 18
Table 2. 1 Summary of hypotheses................................................................................... 37
Table 3. 1 Research questions and research hypotheses................................................... 38
Table 3. 2 Measures of brand loyalty................................................................................ 43
Table 3. 3 Measures of brand image................................................................................. 44
Table 3. 4 Measures of brand awareness .......................................................................... 44
Table 3. 5 Measures of perceived quality ......................................................................... 45
Table 3. 6 The demographical status of participants ........................................................ 47
Table 3. 7 The final questionnaire .................................................................................... 48
Table 4. 1 Response frequency of each brand .................................................................. 56
Table 4. 2 Characteristics of respondents ......................................................................... 57
Table 4. 3 Descriptive statistics ........................................................................................ 58
Table 4. 4 The result of EFA test with 31 items ............................................................... 65
Table 4. 5 The result of EFA with 29 items...................................................................... 66
Table 4. 6 The structure matrix of five factors ................................................................. 67
Table 4. 7 Results of reliability test and EFA test for construct measurement scales ...... 68
Table 4. 8 Final construct measurement scales................................................................. 69
Table 4. 9 Dimensions of Brand Equity Structure............................................................ 70
Table 4. 10 Brand equity rating ........................................................................................ 71
Table 4. 11 Brand equity ranking ..................................................................................... 72
Table 4. 12 The correlations among the dimensions of brand equity............................... 73
Table 4. 13 The results of linear regression analysis ........................................................ 74
Table 4. 14 The t-test analysis results of four dimensions of brand equity ...................... 77
Table 4. 15 Mean differences of brand awareness between high- and low-tuition ETCs 79
Table 4. 16 Mean differences of tangibles component between high- and low-tuition
ETCs ................................................................................................................................. 80
Table 4. 17 Mean differences of assurance component between high- and low-tuition
ETCs ................................................................................................................................. 81
Table 4. 18 Mean differences of brand image between high- and low-tuition ETCs....... 82
Table 4. 19 Mean differences of brand loyalty between high- and low-tuition ETCs...... 83
Table 4. 20 The summary of the attributes having significant mean differences ............. 83
Table 4. 21 The attributes having significant mean differences between two groups ...... 84
Table 5. 1 Summary of testing results of hypotheses 4, 5, 6, and 7.................................. 90
Table 5. 2 The summary of the attributes having significant mean differences ............... 91
Table 5. 3 Summary of testing result of hypothesis 8....................................................... 91
Table 5. 4 Summary of hypotheses testing results............................................................ 92
6
List of Figures
Figure 1. 1 Structure of chapter 1 ....................................................................................... 7
Figure 1. 2 The model of the relationship between brand loyalty and the other dimensions
........................................................................................................................................... 13
Figure 2. 1 The structure of chapter 2............................................................................... 19
Figure 2. 2 The relationship between product and brand.................................................. 22
Figure 2. 3 Two approaches to brand equity..................................................................... 24
Figure 2. 4 How Brand Equity Generates Value (Aaker 1996)........................................ 27
Figure 2. 5 Dimensions of brand knowledge (Kevin Lane Keller 1993).......................... 29
Figure 2. 6 The conceptual model of customer-based brand equity ................................. 31
Figure 2. 7 The relationship between brand loyalty and other dimensions ...................... 36
Figure 3. 1 The structure of chapter 3............................................................................... 39
Figure 3. 2 Research process ............................................................................................ 41
Figure 3. 3 Brand selection ............................................................................................... 51
Figure 4. 1 The structure of chapter 4............................................................................... 55
Figure 4. 2 Sex of respondents.......................................................................................... 57
Figure 4. 3 Age of respondents ......................................................................................... 58
Figure 4. 4 The first stage of the assessment of the construct measurement scales ......... 63
Figure 4. 5 The revised model of the relationship between brand loyalty and the other
dimensions of brand equity............................................................................................... 76
Figure 5. 1 Structure of chapter 5 ..................................................................................... 86
Figure 5. 2 The results of linear regression analysis between brand loyalty and the other
dimensions ....................................................................................................................... 88
Figure 5. 3 The revised model of relationship between brand loyalty and the other
dimensions ........................................................................................................................ 89
7
Chapter 1: Introduction
1.1 Introduction
This chapter provides a general introduction for the current study, by
drawing a general picture of the following chapters and the study as a whole,
beginning with a general introduction in section 1.1. Section 1.2 examines the
research background, in which the gaps in the empirical studies on branding
strategies are identified. Section 1.3 defines the research questions and lists the
research hypotheses.
In addition, section 1.4 discusses scope and some limitations of the current
study. Section 1.5 briefly discusses the general aspects of research methodology
such as research types and research design.
Section 1.6 provides implications of this study. Section 1.7 introduces the
structure of the study. The structure of chapter 1 is provided in Figure 1.1.
Figure 1. 1 Structure of chapter 1
1.1 Introduction
1.2 Research background
1.3 Research questions
1.4 Scope and limitations
1.5 Methodology
1.6 Implications of the study
1.7 Structure of the study
8
1.2 Research background
Branding and brand equity have been topics of interest to marketing
researchers for many years (Krishnan & Hartline 2001). Traditionally, branding
has been focused on tangible products, but in recent decades the focus has
expanded to also include branding of services. Although branding of services
has started to develop, this has not kept pace with the growth of the service
sector overall. The growth of the service sector has led to increased competition
where brand has become an important tool for gaining competitive advantages.
Branding plays a special role in service companies because strong brands increase
customers’ trust of the invisible purchase. A strong service brand is essentially a
promise of future satisfaction (Berry 2000). Some researchers have also argued
that branding is more critical for services than for goods (Krishnan & Hartline
2001; Brady et al. 2005). A strong brand can help to reduce the risks associated
with the purchase and consumption of many services. Other advantages of a
strong brand are for example that it creates better margins by adding value to the
service,
builds
stable
long-term
demand
and increases
market
share.
Consequently, a strong brand offers many advantages in the service industry
and when evaluating the strength of the brand, the concept of brand equity is
used.
Researchers have defined brand equity variously introducing different
viewpoints, but there seems to be a basic agreement on the concept of brand
equity. All these definitions imply that brand equity is the incremental value of a
product due to the brand name (Kim et al. 2003). Brand equity research in
marketing has largely concentrated on customer perception (Kim et al. 2008).
Keller (1993) defined customer-based brand equity as “the differential effect of
brand knowledge on consumer response to the marketing of the brand”. Brand
equity is a multidimensional concept (Aaker 1996a). Nowadays, it is no longer
enough to brand a product just using its name, it is important
that all the
9
dimensions of brand equity are used in a consistent way in the marketing of the
product. An understanding of the brand equity dimensions/sources offers
managers valuable insights into how brands endow value to the customers and the
firm (Balaji 2009). Therefore the understanding about the extent of the
contribution of each dimension to the brand equity of some industry is vital for
brand managers to create sustainable competitive advantages in today’s
competitive business environment through marketing strategies.
On the other hand, a business is considered successful when that business
reaches its goals in terms of revenue, market share, and brand equity. The results
are usually created through customers’ brand loyalty. Loyalty is the core of brand
equity (Aaker 1996b). When customers are loyal to a brand for a product category,
it would be expected that they would purchase the same brand of that product
category on each purchase occasion. Managers have also rediscovered that the best
kind of loyalty is brand loyalty, not price loyalty or bargain loyalty, even though
as a first step it is useful to create behavioral barriers to exit (Kapferer 2008). It is
well known that it is much more expensive to gain new customers than to keep
existing ones, especially when the existing customer base is satisfied and loyal.
Moreover, loyal customers tend to provide brand exposure to new customers
through “mouth to mouth” communication. Thus, brand loyalty creates value to
the firm by reducing the marketing expenditure, creating strong brand affiliation
and influences others through word-of-mouth (Balaji 2009). According to
Moisescu (2006), a high degree of loyalty among customers provides the firm with
a series of specific competitive advantages, loyalty having a strong positive effect
in two main directions, reducing marketing cost and increasing the brand’s
revenue. Still, brand loyalty can’t be analysed without considering its relationship
to other descriptive dimensions of brand equity like awareness, perceived quality,
or associations (Moisescu 2006). Loyalty is of sufficient importance that other
measures, such as perceived quality and associations, can often be evaluated based
10
on their ability to influence it (Aaker 1996b). Thus, it is necessary to empirically
examine the linkages between the brand loyalty and the other dimensions of brand
equity.
Along that line, in fact, brand equity is recently considered one of the top
issues in the English training industry. Most English Training Center (ETC)
chains have recognizable brand identifiers. For an ETC brand name and what the
brand represents are the most important assets, if managed appropriately, branding
augments ETC’s competitive advantage. Beyond visible and tangible factors,
inside attributes, i.e., the meaning of brand is very important to ETCs’ success
because strong brands usually provide primary points of differentiation between
various competitors for learners’ making choice of centers. Learners, especially
new ones, are confused because of the plethora of brands available to them such
as British Council, International Languages Association (ILA), Apollo, Vietnam –
United States Society (VUS), A Au, Dong Au, Viet Uc, Viet My, Au Viet My, Duong
Minh, Space, London, Alpha, etc. Products and services of ETCs do not inherently
have differentiation and channels of distribution are not distinctiveness, learners
usually only have price and brand equity to differentiate one brand from its
competitors.
In the absence of strong brands, the only remaining ongoing
marketing mechanism is price manipulation, usually in the form of discounting
(Kim & Kim 2004). Indeed, ETCs’ essential marketing activities are mostly price
promotions such as studying again without tuition fee if examination failure,
concessions for students, seasonal discount, etc. resulting in persistent price wars
that have declined profit and destroyed brand loyalty. On the contrary, the efforts
of establishing brand equity might be the key to building brand value and making
profit not only for ETCs but also for learners. Therefore, an ETC that is managing
brand equity more successfully is likely to maintain its competitive advantage.
Strong brands enable customers to better visualize and understand intangible
products (Berry 2000). In other words, branding would increase ETCs’ attraction
11
to learners. For a brand to be strong, the set of perceptions which serve to
differentiate the product from competition
has to be created in a way so that
the learners think of the brand in positive terms. ETCs are now interested in
building strong brand, but achieving that goal is not always easy.
Moisescu (2006) suggests that a successful brand strategy must be based on
creating brand loyalty. When learners are loyal to ETC, it would be expected that
they will attend next class of higher level after finishing present class. They would
also recommend the ETC at which they are studying to others time after time, if
possible. For achieving this goal, loyalty’s relationship to other descriptive
dimensions of brand equity must be clearly set out, while target consumers must
be classified on a loyalty basis (Moisescu 2006). In addition, the estimation of the
contribution of each dimension to brand equity allows ETCs to identify their
brand’s positioning relative to competitors, to strengthen brand value, and to build
up corrective marketing strategies if necessary. Consequently, effective marketing
programs on branding cultivate customers’ confidence, which induces customers’
loyalty and their willingness to pay a premium price for the brand (Kim & Kim
2004).
In summary, the particular interest is given to ETCs now because the
quantity of ETCs has been strongly increasing, resulting in even fiercer
competition among existing brands of this segment. ETCs’ brand managers should
know customers’ perceptions to the brand and cultivate customers’ thinking of the
brand
in positive
terms through suitable marketing activities of branding.
However, not many studies have investigated the relationships among the brand
equity dimensions and their impact on brand equity (Balaji 2009). Thus, by
adopting the customer-based brand equity approach this study is designed to
investigate the differences between high tuition fee ETCs and low tuition fee
ETCs with respect to brand loyalty, brand awareness, perceived quality, and brand
12
image as well as the relationship between brand loyalty and the other dimensions
of brand equity.
1.3 Research questions
As above discussed, the current research intends to address three main
issues:
Q1. Is there a relationship between brand loyalty and the other dimensions
of CBBE in the system of English training industry?
Q2. Is there any difference of the brand loyalty, brand awareness, perceived
quality, and brand image of CBBE between high tuition fee ETCs and
low tuition fee ETCs?
Q3. Is there any difference of individual attributes of brand loyalty, brand
awareness, perceived quality, and brand image between high tuition fee
ETCs and low tuition fee ETCs?
Due to the problem of a lack of empirical studies on brand equity in the
education and training industry, based on the review of CBBE theory, it is argued
here that the application of Aaker’s model of customer-based brand equity is the
suitable solution. In the present study, the four key components of CBBE are
indicated as: brand awareness, perceived quality, brand image and brand loyalty.
The first research question addresses the issue of whether there is the effect of
brand awareness, perceived quality and brand image on brand loyalty that can be
used as the foundation and guidance for enhancing target customers’ satisfaction
and making customers’ responsiveness to ETC’s marketing activities positive, in
turn inducing customers’ loyalty.
These three dimensions of brand equity are proposed as being positively
related to brand loyalty in the English training industry. Three hypotheses have
13
been developed to investigate the relationship among these four components as
shown in hypotheses H1, H2 and H3.
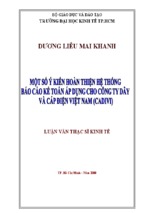
H1: Brand awareness is positively related to brand loyalty.
H2: Perceived quality is positively related to brand loyalty.
H3: Brand image is positively related to brand loyalty.
These three hypotheses are conceptualized into the model as described in
Figure 1.2
Figure 1. 2 The model of the relationship between brand loyalty and the other
dimensions
Brand
Awareness
+H1
Perceived
Quality
Brand
Loyalty
+H2
+H3
Brand
Image
The second research question addresses the issue of whether there is the
difference of brand awareness, perceived quality, brand image and brand loyalty
of brand equity respectively between high tuition fee ETCs and low tuition fee
ones that can serve as the foundation and reference for building sustainable
marketing strategies to create brand equity.
Four hypotheses have been developed as follows:
14
H4: There is the difference of brand awareness of CBBE between high
tuition fee ETCs and low tuition fee ETCs.
H5: There is the difference of perceived quality of CBBE between high
tuition fee ETCs and low tuition fee ETCs.
H6: There is the difference of brand image of CBBE between high tuition
fee ETCs and low tuition fee ETCs.
H7: There is the difference of brand loyalty of CBBE between high tuition
fee ETCs and low tuition fee ETCs.
The third research question addresses the issue of whether there is the
difference of the attributes of brand awareness, perceived quality, brand image and
brand loyalty respectively between high tuition fee ETCs and low tuition fee ones
that helps managers plan appropriate marketing tactics to create brand equity.
Hypothesis 8 was proposed as follows:
H8: There is the difference of the attributes of the dimensions of CBBE
between high tuition fee ETCs and low tuition fee ETCs.
1.4 Scope and Limitation
This study is conducted with only four brands of ETC chains in
HoChiMinh city. A further research with many more brands and larger scope of
whole country is really necessary to precisely assess the scale and measure brand
equity in education and training industry. On the other hand, researches spreading
on other kinds of education and training industry allow managers to have insights
into the environment that they operate in the terms of marketing. Moreover,
confirmatory factor analysis should be employed to address the issues of
dimensionality, convergent and discriminant validity.
15
1.5 Research method
In choosing a research design, Zikmund (1997) discusses three types of
business research: exploratory, descriptive and causal research.
• Exploratory research is usually conducted to clarify and define the
nature of a problem.
• Descriptive research is designed to describe characteristics of a
population or phenomenon.
• Causal research is conducted to identify cause-and-effect relationships
among variables where the research problem has already been narrowly
defined.
Choosing a type of research depends upon the research questions that the
researcher wants to answer. This research study is designed to measure ETCs’
brand equity, evaluate the differences between high tuition fee ETCs and low
tuition fee ETCs in the contribution of individual attributes to the brand equity.
Thus, “descriptive” is viewed as an appropriate research type. Also, this research
is designed to identify the cause-and-effect relationships between the other
dimensions of brand equity and brand loyalty. Thus causal research is also
implemented in combination with descriptive research. In summary, a
combination of descriptive and causal research is chosen for this research.
Selecting research design is the next step after choosing type of research.
There are four types of research design from which to select: survey, experiments,
observation and secondary data (Zikmund 1997). Selection of research design is
based on the advantages and disadvantages of each kind of research designs and
circumstances in which the research problem is defined. In this research, survey
method is used. The reason for choosing the survey method is that surveys provide
a quick, efficient and accurate means of assessing information on a population,
especially in the case of a lack of secondary data (Zikmund 1997). In this case,
16
quantitative methods are applied to examine the research questions, using a survey
questionnaire as the tool to measure brand equity and its attributes. Convenience
sampling is used in this research and data is collected using face-to-face interview,
conducted by trained interviewers.
Most foreign languages centers in Vietnam, especially in English language,
are established in a chain and primarily located in HoChiMinh city and HaNoi
capital. In addition, the English language is chosen for investigation, as this is one
of the most popular foreign languages distributed throughout foreign language
training sector. In summary, this study focuses on chains of English Training
Centers in HoChiMinh city. Finally, the data is analyzed using the SPSS Version
16 software program.
1.6 Implications of research
The study brings various practical meanings for the managers in education
and training industry, educators as well as researchers in marketing concretely as
follows:
Firstly, the results of this research aid ETCs to deeply understand the
concept of customer-based brand equity and its dimensions in the context of
service in general and training foreign languages in particular, resulting in
managers’ profound knowledge in designing of marketing programs for building
and broadcasting their brands effectively.
Secondly, the research suggests the construct scales to measure customerbased brand equity in English training industry to aid checking the brand health.
Thirdly, the findings allow the executives of ETCs to identify important
dimensions of brand equity to set up the suitable activities for improving perceived
quality, brand awareness and brand image, resulting in creating and maintaining
loyalty of learners.
17
Fourthly, by dividing the ETCs into high-tuition fee and low-tuition fee
groups, the study identifies dimensions and their attributes that learners
differentiate between the two groups in order to help ETC brand managers build
respective marketing programs.
Fifthly, the results of this research contribute complementarily to the
literature on brand equity on the world. The research is able to be a reference for
researchers, lecturers, and students in marketing and management, in Vietnam and
on the world of brand equity as well as the role of loyalty in Vietnam market.
Finally, the present study could be a reference of research methodology not
only in marketing and management in particular but also the other social sciences.
1.7 Structure of the study
This research is structured into 5 chapters. Chapter 1: Introduction
introduces the research including research background, research questions,
hypotheses, a brief research methodology overview, implications and limitations
of research. Chapter 2: Literature Review provides a literature review of
customer-based brand equity. Chapter 3: Methodology discusses methodology
utilized in the research, details the research methodology design, research
procedures and justification of the data analysis. Chapter 3 also supplies details of
questionnaire and the development of the survey. Chapter 4: Research Results
describes sampling and processing data, presents analyzing the data collected and
the findings of the research. Chapter 5: Conclusion and Implication points out
conclusion and implication from the findings of this research project, based on the
research questions and hypotheses. This chapter also discusses the implications,
contributions and limitations of the research in the world of business
administration. In addition, the recommendations for further research are provided.
18
Table 1. 1 The structure of the study
Chapter 1
Introduction
Chapter 2
Literature Review
Chapter 3
Methodology
Chapter 4
Research Results
Chapter 5
Conclusion and Implication
- Xem thêm -