1
Materials
Data
Book
2003 Edition
Cambridge University Engineering Department
2
PHYSICAL CONSTANTS IN SI UNITS
Absolute zero of temperature
Acceleration due to gravity, g
Avogadro’s number, N A
Base of natural logarithms, e
Boltzmann’s constant, k
Faraday’s constant, F
Universal Gas constant, R
Permeability of vacuum, µo
Permittivity of vacuum, εo
Planck’s constant, h
Velocity of light in vacuum, c
Volume of perfect gas at STP
– 273.15 °C
9. 807 m/s2
6.022x1026 /kmol
2.718
1.381 x 10⁻²⁶ kJ/K
9.648 x 10⁷ C/kmol
8.3143 kJ/kmol K
1.257 x 10⁻⁶ H/m
8.854 x 10⁻¹² F/m
6.626 x 10–37 kJ/s
2.998 x 10⁸ m/s
22.41 m3/kmol
CONVERSION OF UNITS
Angle, θ
Energy, U
Force, F
Length, l
Mass, M
Power, P
Stress, σ
Specific Heat, Cp
Stress Intensity, K
Temperature, T
Thermal Conductivity, λ
Volume, V
Viscosity, η
1 rad
See inside back cover
1 kgf
1 lbf
1 ft
1 inch
1Å
1 tonne
1 lb
See inside back cover
See inside back cover
1 cal/g.°C
1 ksi in
1 °F
1 cal/s.cm.oC
1 Imperial gall
1 US gall
1 poise
1 lb ft.s
57.30 °
9.807 N
4.448 N
304.8 mm
25.40 mm
0.1 nm
1000 kg
0.454 kg
4.188 kJ/kg.K
1.10 MPa m
0.556 K
4.18 W/m.K
4.546 x 10⁻³ m3
3.785 x 10⁻³ m3
0.1 N.s/m2
0.1517 N.s/m2
1
CONTENTS
Page Number
Introduction
Sources
3
3
I. FORMULAE AND DEFINITIONS
Stress and strain
Elastic moduli
Stiffness and strength of unidirectional composites
Dislocations and plastic flow
Fast fracture
Statistics of fracture
Fatigue
7
Creep
Diffusion
Heat flow
4
4
5
5
6
6
7
8
8
II. PHYSICAL AND MECHANICAL PROPERTIES OF MATERIALS
Melting temperature
Density
Young’s modulus
Yield stress and tensile strength
Fracture toughness
Environmental resistance
Uniaxial tensile response of selected metals and polymers
9
10
11
12
13
14
15
III. MATERIAL PROPERTY CHARTS
Young’s modulus versus density
Strength versus density
Young’s modulus versus strength
Fracture toughness versus strength
Maximum service temperature
Material price (per kg)
16
17
18
19
20
21
IV. PROCESS ATTRIBUTE CHARTS
Material-process compatibility matrix (shaping)
Mass
Section thickness
Surface roughness
Dimensional tolerance
Economic batch size
22
23
23
24
24
25
2
V. CLASSIFICATION AND APPLICATIONS OF ENGINEERING MATERIALS
Metals: ferrous alloys, non-ferrous alloys
Polymers and foams
Composites, ceramics, glasses and natural materials
26
27
28
VI. EQUILIBRIUM (PHASE) DIAGRAMS
Copper – Nickel
Lead – Tin
Iron – Carbon
Aluminium – Copper
Aluminium – Silicon
Copper – Zinc
Copper – Tin
Titanium-Aluminium
Silica – Alumina
29
29
30
30
31
31
32
32
33
VII. HEAT TREATMENT OF STEELS
TTT diagrams and Jominy end-quench hardenability curves for steels
34
VIII. PHYSICAL PROPERTIES OF SELECTED ELEMENTS
Atomic properties of selected elements
Oxidation properties of selected elements
36
37
3
INTRODUCTION
The data and information in this booklet have been collected for use in the Materials Courses in
Part I of the Engineering Tripos (as well as in Part II, and the Manufacturing Engineering
Tripos). Numerical data are presented in tabulated and graphical form, and a summary of useful
formulae is included. A list of sources from which the data have been prepared is given below.
Tabulated material and process data or information are from the Cambridge Engineering Selector
(CES) software (Educational database Level 2), copyright of Granta Design Ltd, and are
reproduced by permission; the same data source was used for the material property and process
attribute charts.
It must be realised that many material properties (such as toughness) vary between wide limits
depending on composition and previous treatment. Any final design should be based on
manufacturers’ or suppliers’ data for the material in question, and not on the data given here.
SOURCES
Cambridge Engineering Selector software (CES 4.1), 2003, Granta Design Limited, Rustat
House, 62 Clifton Rd, Cambridge, CB1 7EG
M F Ashby, Materials Selection in Mechanical Design, 1999, Butterworth Heinemann
M F Ashby and D R H Jones, Engineering Materials, Vol. 1, 1996, Butterworth Heinemann
M F Ashby and D R H Jones, Engineering Materials, Vol. 2, 1998, Butterworth Heinemann
M Hansen, Constitution of Binary Alloys, 1958, McGraw Hill
I J Polmear, Light Alloys, 1995, Elsevier
C J Smithells, Metals Reference Book, 6th Ed., 1984, Butterworths
Transformation Characteristics of Nickel Steels, 1952, International Nickel
4
I. FORMULAE AND DEFINITIONS
STRESS AND STRAIN
σt =
F
A
σn =
F
Ao
l
lo
ε t = ln
ν =−
εn =
l−lo
lo
σ t = true stress
σ n = nominal stress
ε t = true strain
ε n = nominal strain
F = normal component of force
Ao = initial area
A = current area
l o = initial length
l = current length
Poisson’s ratio,
lateral strain
longitudinal strain
Young’s modulus E = initial slope of σ t − ε t curve = initial slope of σ n − ε n curve.
Yield stress σ y is the nominal stress at the limit of elasticity in a tensile test.
Tensile strength σ ts is the nominal stress at maximum load in a tensile test.
Tensile ductility ε f is the nominal plastic strain at failure in a tensile test. The gauge length of
the specimen should also be quoted.
ELASTIC MODULI
G=
E
2 (1 +ν )
K=
E
3 (1 − 2ν )
For polycrystalline solids, as a rough guide,
Poisson’s Ratio
ν≈
1
3
Shear Modulus
G≈
3
E
8
Bulk Modulus
K ≈ E
These approximations break down for rubber and porous solids.
5
STIFFNESS AND STRENGTH OF UNIDIRECTIONAL COMPOSITES
E II = V f E f + ( 1 − V f ) E m
V f 1−V f
E⊥ =
+
Ef
Em
−1
σ ts = V f σ ff + ( 1 − V f ) σ m
y
E II = composite modulus parallel to fibres (upper bound)
E ⊥ = composite modulus transverse to fibres (lower bound)
V f = volume fraction of fibres
E f = Young’s modulus of fibres
E m = Young’s modulus of matrix
σ ts = tensile strength of composite parallel to fibres
σ ff = fracture strength of fibres
σm
y = yield stress of matrix
DISLOCATIONS AND PLASTIC FLOW
The force per unit length F on a dislocation, of Burger’s vector b , due to a remote shear stress
τ , is F = τ b . The shear stress τ y required to move a dislocation on a single slip plane is
τy =
cT
bL
where T = line tension (about 1 G b 2 , where G is the shear modulus)
2
L = inter-obstacle distance
c = constant ( c ≈ 2 for strong obstacles, c < 2 for weak obstacles)
The shear yield stress k of a polycrystalline solid is related to the shear stress τ y required to
move a dislocation on a single slip plane: k ≈ 32 τ y .
The uniaxial yield stress σ y of a polycrystalline solid is approximately σ y = 2 k , where k
is the shear yield stress.
Hardness H (in MPa) is given approximately by: H ≈ 3 σ y .
Vickers Hardness HV is given in kgf/mm2, i.e. HV = H / g , where g is the acceleration due
to gravity.
6
FAST FRACTURE
K = Yσ
The stress intensity factor, K :
πa
Fast fracture occurs when K = K IC
In plane strain, the relationship between stress intensity factor K and strain energy release rate
G is:
K =
EG
1 −ν
2
≈
(as ν 2 ≈ 0.1 )
EG
Plane strain fracture toughness and toughness are thus related by: K IC =
“Process zone size” at crack tip given approximately by: r p =
E G IC
1 −ν 2
≈
E G IC
2
K IC
π σ 2f
Note that K IC (and G IC ) are only valid when conditions for linear elastic fracture mechanics
apply (typically the crack length and specimen dimensions must be at least 50 times the process
zone size).
In the above:
σ = remote tensile stress
a = crack length
Y = dimensionless constant dependent on geometry; typically Y ≈ 1
K IC = plane strain fracture toughness;
G IC = critical strain energy release rate, or toughness;
E = Young’s modulus
ν = Poisson’s ratio
σ f = failure strength
STATISTICS OF FRACTURE
Weibull distribution, Ps (V) = exp
For constant stress:
∫
Ps (V) = exp −
σ
−
V σ o
σ
σ o
m
m
dV
Vo
V
Vo
Ps = survival probability of component
V = volume of component
σ = tensile stress on component
Vo = volume of test sample
σ o = reference failure stress for volume Vo , which gives Ps =
m = Weibull modulus
1 = 0.37
e
7
FATIGUE
Basquin’s Law (high cycle fatigue):
∆σ N αf = C1
Coffin-Manson Law (low cycle fatigue):
∆ε pl N βf = C 2
Goodman’s Rule. For the same fatigue life, a stress range ∆σ operating with a mean stress σ m ,
is equivalent to a stress range ∆σ o and zero mean stress, according to the relationship:
∆σ = ∆σ o 1 −
σm
σ ts
Miner’s Rule for cumulative damage (for i loading blocks, each of constant stress amplitude and
duration N i cycles):
∑
i
Ni
= 1
N fi
Paris’ crack growth law:
da
= A ∆Kn
dN
In the above:
∆σ = stress range;
∆ε pl = plastic strain range;
∆K = tensile stress intensity range;
N = cycles;
N f = cycles to failure;
α , β , C1 , C 2 , A, n = constants;
a = crack length;
σ ts = tensile strength.
CREEP
Power law creep:
ε& ss = A σ n exp ( − Q / RT )
ε& ss = steady-state strain-rate
Q = activation energy (kJ/kmol)
R = universal gas constant
T = absolute temperature
A, n = constants
8
DIFFUSION
D = Do exp ( − Q / RT )
Diffusion coefficient:
Fick’s diffusion equations:
J =−D
C = concentration
x = distance
t = time
dC
dx
∂C
∂ 2C
=D
∂t
∂ x2
and
J = diffusive flux
D = diffusion coefficient (m2/s)
Do = pre-exponential factor (m2/s)
Q = activation energy (kJ/kmol)
HEAT FLOW
q=−λ
Steady-state 1D heat flow (Fourier’s Law):
dT
dx
∂T
∂ 2T
=a
∂t
∂ x2
T = temperature (K)
q = heat flux per second, per unit area (W/m2.s)
Transient 1D heat flow:
λ = thermal conductivity (W/m.K)
a = thermal diffusivity (m2/s)
For many 1D problems of diffusion and heat flow, the solution for concentration or temperature
depends on the error function, erf :
x
C( x , t ) = f erf
2 D t
or
x
T ( x , t ) = f erf
2 a t
A characteristic diffusion distance in all problems is given by x ≈
characteristic heat flow distance in thermal problems being x ≈
D t , with the corresponding
at .
The error function, and its first derivative, are:
erf ( X ) =
X
2
π
∫0
( )
exp − y 2 dy
d
[ erf ( X )] =
dX
and
2
π
(
exp − X 2
)
The error function integral has no closed form solution – values are given in the Table below.
X
0
0.1
0.2
0.3
0.4
0.5
0.6
0.7
0.8
erf ( X )
0
0.11
0.22
0.33
0.43
0.52
0.60
0.68
0.74
X
0.9
1.0
1.1
1.2
1.3
1.4
1.5
∞
erf ( X )
0.80
0.84
0.88
0.91
0.93
0.95
0.97
1.0
Ferrous
Natural
Composites
Metal
Polymer
Technical
Porous
Ceramics
Glasses
Non-ferrous
Metals
Bamboo (*)
Cork (*)
Leather (*)
Wood, typical (Longitudinal) (*)
Wood, typical (Transverse) (*)
Aluminium/Silicon Carbide
CFRP
GFRP
Borosilicate Glass (*)
Glass Ceramic (*)
Silica Glass (*)
Soda-Lime Glass (*)
Brick
Concrete, typical
Stone
Alumina
Aluminium Nitride
Boron Carbide
Silicon
Silicon Carbide
Silicon Nitride
Tungsten Carbide
Cast Irons
High Carbon Steels
Medium Carbon Steels
Low Carbon Steels
Low Alloy Steels
Stainless Steels
Aluminium Alloys
Copper Alloys
Lead Alloys
Magnesium Alloys
Nickel Alloys
Titanium Alloys
Zinc Alloys
77
77
107
77
77
525
450
563
957
442
927
927
1227
2004
2397
2372
1407
2152
2388
2827
1130
1289
1380
1480
1382
1375
475
982
322
447
1435
1477
375
602
1647
1557
592
1227
1227
1427
2096
2507
2507
1412
2500
2496
2920
1250
1478
1514
1526
1529
1450
677
1082
328
649
1466
1682
492
-
102
102
127
102
102
- 627
n/a
n/a
-
-
-
Tm (oC)
Flexible Polymer Foam (VLD) (*)
Flexible Polymer Foam (LD) (*)
Flexible Polymer Foam (MD) (*)
Rigid Polymer Foam (LD) (*)
Rigid Polymer Foam (MD) (*)
Rigid Polymer Foam (HD) (*)
Butyl Rubber (*)
EVA (*)
Isoprene (IR) (*)
Natural Rubber (NR) (*)
Neoprene (CR) (*)
Polyurethane Elastomers (elPU) (*)
Silicone Elastomers (*)
ABS (*)
Cellulose Polymers (CA) (*)
Ionomer (I) (*)
Nylons (PA) (*)
Polycarbonate (PC) (*)
PEEK (*)
Polyethylene (PE) (*)
PET (*)
Acrylic (PMMA) (*)
Acetal (POM) (*)
Polypropylene (PP) (*)
Polystyrene (PS) (*)
Polyurethane Thermoplastics (tpPU) (*)
PVC
Teflon (PTFE)
Epoxies
Phenolics
Polyester
112
112
112
67
67
67
– 73
– 73
– 83
– 78
– 48
– 73
– 123
88
–9
27
44
142
143
– 25
68
85
– 18
– 25
74
120
75
107
-
n/a
n/a
n/a
177
177
177
171
157
171
– 63
– 23
– 78
– 63
– 43
– 23
– 73
128
107
77
56
205
199
– 15
80
165
–8
– 15
110
160
105
123
For full names and acronyms of polymers – see Section V.
(*) glass transition (softening) temperature
n/a: not applicable (materials decompose, rather than melt)
(Data courtesy of Granta Design Ltd)
1
Polymer Foams
Thermoset
Thermoplastic
1
Polymers
Elastomer
Tm (oC)
All data are for melting points at atmospheric pressure. For polymers (and glasses) the data indicate the glass transition (softening)
temperature, above which the mechanical properties rapidly fall. Melting temperatures of selected elements are given in section VIII.
II.1 MELTING (or SOFTENING) TEMPERATURE, Tm
II. PHYSICAL AND MECHANICAL PROPERTIES OF MATERIALS
9
10
Ferrous
Natural
Composites
Metal
Polymer
Technical
Porous
Ceramics
Glasses
Non-ferrous
Metals
Bamboo
Cork
Leather
Wood, typical (Longitudinal)
Wood, typical (Transverse)
Aluminium/Silicon Carbide
CFRP
GFRP
Borosilicate Glass
Glass Ceramic
Silica Glass
Soda-Lime Glass
Brick
Concrete, typical
Stone
Alumina
Aluminium Nitride
Boron Carbide
Silicon
Silicon Carbide
Silicon Nitride
Tungsten Carbide
Cast Irons
High Carbon Steels
Medium Carbon Steels
Low Carbon Steels
Low Alloy Steels
Stainless Steels
Aluminium Alloys
Copper Alloys
Lead Alloys
Magnesium Alloys
Nickel Alloys
Titanium Alloys
Zinc Alloys
0.6
0.12
0.81
0.6
0.6
2.66
1.5
1.75
2.2
2.2
2.17
2.44
1.9
2.2
2.5
3.5
3.26
2.35
2.3
3
3
15.3
7.05
7.8
7.8
7.8
7.8
7.6
2.5
8.93
10
1.74
8.83
4.4
4.95
-
-
-
-
-
0.8
0.24
1.05
0.8
0.8
2.9
1.6
1.97
2.3
2.8
2.22
2.49
2.1
2.6
3
3.98
3.33
2.55
2.35
3.21
3.29
15.9
7.25
7.9
7.9
7.9
7.9
8.1
2.9
8.94
11.4
1.95
8.95
4.8
7
ρ (Mg/m3)
II.2
1
Flexible Polymer Foam (VLD)
Flexible Polymer Foam (LD)
Flexible Polymer Foam (MD)
Rigid Polymer Foam (LD)
Rigid Polymer Foam (MD)
Rigid Polymer Foam (HD)
Butyl Rubber
EVA
Isoprene (IR)
Natural Rubber (NR)
Neoprene (CR)
Polyurethane Elastomers (elPU)
Silicone Elastomers
ABS
Cellulose Polymers (CA)
Ionomer (I)
Nylons (PA)
Polycarbonate (PC)
PEEK
Polyethylene (PE)
PET
Acrylic (PMMA)
Acetal (POM)
Polypropylene (PP)
Polystyrene (PS)
Polyurethane Thermoplastics (tpPU)
PVC
Teflon (PTFE)
Epoxies
Phenolics
Polyester
0.016
0.038
0.07
0.036
0.078
0.17
0.9
0.945
0.93
0.92
1.23
1.02
1.3
1.01
0.98
0.93
1.12
1.14
1.3
0.939
1.29
1.16
1.39
0.89
1.04
1.12
1.3
2.14
1.11
1.24
1.04
-
-
0.035
0.07
0.115
0.07
0.165
0.47
0.92
0.955
0.94
0.93
1.25
1.25
1.8
1.21
1.3
0.96
1.14
1.21
1.32
0.96
1.4
1.22
1.43
0.91
1.05
1.24
1.58
2.2
1.4
1.32
1.4
ρ (Mg/m3)
1 For full names and acronyms of polymers – see Section V
(Data courtesy of Granta Design Ltd).
Polymer Foams
Thermoset
Thermoplastic
Polymers
Elastomer
DENSITY, ρ
Ferrous
Natural
Composites
Metal
Polymer
Technical
Porous
Ceramics
Glasses
Non-ferrous
Metals
Bamboo
Cork
Leather
Wood, typical (Longitudinal)
Wood, typical (Transverse)
Aluminium/Silicon Carbide
CFRP
GFRP
Borosilicate Glass
Glass Ceramic
Silica Glass
Soda-Lime Glass
Brick
Concrete, typical
Stone
Alumina
Aluminium Nitride
Boron Carbide
Silicon
Silicon Carbide
Silicon Nitride
Tungsten Carbide
Cast Irons
High Carbon Steels
Medium Carbon Steels
Low Carbon Steels
Low Alloy Steels
Stainless Steels
Aluminium Alloys
Copper Alloys
Lead Alloys
Magnesium Alloys
Nickel Alloys
Titanium Alloys
Zinc Alloys
15
0.013
0.1
6
0.5
81
69
15
61
64
68
68
10
25
6.9
215
302
400
140
300
280
600
165
200
200
200
201
189
68
112
12.5
42
190
90
68
-
-
-
-
-
20
0.05
0.5
20
3
100
150
28
64
110
74
72
50
38
21
413
348
472
155
460
310
720
180
215
216
215
217
210
82
148
15
47
220
120
95
E (GPa)
II.3
Flexible Polymer Foam (VLD)
Flexible Polymer Foam (LD)
Flexible Polymer Foam (MD)
Rigid Polymer Foam (LD)
Rigid Polymer Foam (MD)
Rigid Polymer Foam (HD)
Butyl Rubber
EVA
Isoprene (IR)
Natural Rubber (NR)
Neoprene (CR)
Polyurethane Elastomers (elPU)
Silicone Elastomers
ABS
Cellulose Polymers (CA)
Ionomer (I)
Nylons (PA)
Polycarbonate (PC)
PEEK
Polyethylene (PE)
PET
Acrylic (PMMA)
Acetal (POM)
Polypropylene (PP)
Polystyrene (PS)
Polyurethane Thermoplastics (tpPU)
PVC
Teflon (PTFE)
Epoxies
Phenolics
Polyester
0.0003
0.001
0.004
0.023
0.08
0.2
0.001
0.01
0.0014
0.0015
0.0007
0.002
0.005
1.1
1.6
0.2
2.62
2
3.5
0.621
2.76
2.24
2.5
0.896
2.28
1.31
2.14
0.4
2.35
2.76
2.07
-
-
0.001
0.003
0.012
0.08
0.2
0.48
0.002
0.04
0.004
0.0025
0.002
0.003
0.02
2.9
2
0.424
3.2
2.44
4.2
0.896
4.14
3.8
5
1.55
3.34
2.07
4.14
0.552
3.075
4.83
4.41
E (GPa)
1 For full names and acronyms of polymers – see Section V
(Data courtesy of Granta Design Ltd)
.
Polymer Foams
Thermoset
Thermoplastic
Polymers
Elastomer
1
YOUNG’S MODULUS, E
11
Ferrous
Natural
Composites
Metal
Polymer
Technical
Porous
Ceramics
Glasses
Non-ferrous
Metals
Bamboo
Cork
Leather
Wood, typical (Longitudinal)
Wood, typical (Transverse)
Aluminium/Silicon Carbide
CFRP
GFRP
Borosilicate Glass (*)
Glass Ceramic (*)
Silica Glass (*)
Soda-Lime Glass (*)
Brick (*)
Concrete, typical (*)
Stone (*)
Alumina (*)
Aluminium Nitride (*)
Boron Carbide (*)
Silicon (*)
Silicon Carbide (*)
Silicon Nitride (*)
Tungsten Carbide (*)
Cast Irons
High Carbon Steels
Medium Carbon Steels
Low Carbon Steels
Low Alloy Steels
Stainless Steels
Aluminium Alloys
Copper Alloys
Lead Alloys
Magnesium Alloys
Nickel Alloys
Titanium Alloys
Zinc Alloys
(Data courtesy of Granta Design Ltd)
12
35
0.3
5
30
2
280
550
110
264
750
1100
360
50
32
34
690
1970
2583
3200
1000
524
3347
215
400
305
250
400
170
30
30
8
70
70
250
80
-
-
-
-
-
44
1.5
10
70
6
324
1050
192
384
2129
1600
420
140
60
248
5500
2700
5687
3460
5250
5500
6833
790
1155
900
395
1100
1000
500
500
14
400
1100
1245
450
36
0.5
20
60
4
290
550
138
22
62
45
31
7
2
5
350
197
350
160
370
690
370
350
550
410
345
460
480
58
100
12
185
345
300
135
-
-
-
-
-
45
2.5
26
100
9
365
1050
241
32
177
155
35
14
6
17
665
270
560
180
680
800
550
1000
1640
1200
580
1200
2240
550
550
20
475
1200
1625
520
σts (MPa)
Flexible Polymer Foam (VLD)
Flexible Polymer Foam (LD)
Flexible Polymer Foam (MD)
Rigid Polymer Foam (LD)
Rigid Polymer Foam (MD)
Rigid Polymer Foam (HD)
Butyl Rubber
EVA
Isoprene (IR)
Natural Rubber (NR)
Neoprene (CR)
Polyurethane Elastomers (elPU)
Silicone Elastomers
ABS
Cellulose Polymers (CA)
Ionomer (I)
Nylons (PA)
Polycarbonate (PC)
PEEK
Polyethylene (PE)
PET
Acrylic (PMMA)
Acetal (POM)
Polypropylene (PP)
Polystyrene (PS)
Polyurethane Thermoplastics (tpPU)
PVC
Teflon (PTFE)
Epoxies
Phenolics
Polyester
0.01
0.02
0.05
0.3
0.4
0.8
2
12
20
20
3.4
25
2.4
18.5
25
8.3
50
59
65
17.9
56.5
53.8
48.6
20.7
28.7
40
35.4
15
36
27.6
33
-
-
0.12
0.3
0.7
1.7
3.5
12
3
18
25
30
24
51
5.5
51
45
15.9
94.8
70
95
29
62.3
72.4
72.4
37.2
56.2
53.8
52.1
25
71.7
49.7
40
σy (MPa)
0.24
0.24
0.43
0.45
0.65
1.2
5
16
20
22
3.4
25
2.4
27.6
25
17.2
90
60
70
20.7
48.3
48.3
60
27.6
35.9
31
40.7
20
45
34.5
41.4
-
-
0.85
2.35
2.95
2.25
5.1
12.4
10
20
25
32
24
51
5.5
55.2
50
37.2
165
72.4
103
44.8
72.4
79.6
89.6
41.4
56.5
62
65.1
30
89.6
62.1
89.6
σts (MPa)
For full names and acronyms of polymers – see Section V.
(*) NB: For ceramics, yield stress is replaced by compressive strength,
which is more relevant in ceramic design. Note that ceramics are of the
order of 10 times stronger in compression than in tension.
1
Polymer Foams
Thermoset
Thermoplastic
1
Polymers
Elastomer
YIELD STRESS, σy, AND TENSILE STRENGTH, σts
σy (MPa)
II.4
Ferrous
Bamboo
Cork
Leather
Wood, typical (Longitudinal)
Wood, typical (Transverse)
Aluminium/Silicon Carbide
CFRP
GFRP
Borosilicate Glass
Glass Ceramic
Silica Glass
Soda-Lime Glass
Brick
Concrete, typical
Stone
Alumina
Aluminium Nitride
Boron Carbide
Silicon
Silicon Carbide
Silicon Nitride
Tungsten Carbide
Cast Irons
High Carbon Steels
Medium Carbon Steels
Low Carbon Steels
Low Alloy Steels
Stainless Steels
Aluminium Alloys
Copper Alloys
Lead Alloys
Magnesium Alloys
Nickel Alloys
Titanium Alloys
Zinc Alloys
(Data courtesy of Granta Design Ltd)
Natural
Composites
Metal
Polymer
Technical
Porous
Ceramics
Glasses
Non-ferrous
Metals
II.5
5
0.05
3
5
0.5
15
6.1
7
0.5
1.4
0.6
0.55
1
0.35
0.7
3.3
2.5
2.5
0.83
2.5
4
2
22
27
12
41
14
62
22
30
5
12
80
14
10
-
-
-
-
-
7
0.1
5
9
0.8
24
88
23
0.7
1.7
0.8
0.7
2
0.45
1.5
4.8
3.4
3.5
0.94
5
6
3.8
54
92
92
82
200
280
35
90
15
18
110
120
100
KIC (MPa√m)
0.005
0.015
0.03
0.002
0.007
0.024
0.07
0.5
0.07
0.15
0.1
0.2
0.03
1.19
1
1.14
2.22
2.1
2.73
1.44
4.5
0.7
1.71
3
0.7
1.84
1.46
1.32
0.4
0.79
1.09
-
-
0.02
0.05
0.09
0.02
0.049
0.091
0.1
0.7
0.1
0.25
0.3
0.4
0.5
4.30
2.5
3.43
5.62
4.60
4.30
1.72
5.5
1.6
4.2
4.5
1.1
4.97
5.12
1.8
2.22
1.21
1.70
For full names and acronyms of polymers – see Section V.
Flexible Polymer Foam (VLD)
Flexible Polymer Foam (LD)
Flexible Polymer Foam (MD)
Rigid Polymer Foam (LD)
Rigid Polymer Foam (MD)
Rigid Polymer Foam (HD)
Butyl Rubber
EVA
Isoprene (IR)
Natural Rubber (NR)
Neoprene (CR)
Polyurethane Elastomers (elPU)
Silicone Elastomers
ABS
Cellulose Polymers (CA)
Ionomer (I)
Nylons (PA)
Polycarbonate (PC)
PEEK
Polyethylene (PE)
PET
Acrylic (PMMA)
Acetal (POM)
Polypropylene (PP)
Polystyrene (PS)
Polyurethane Thermoplastics (tpPU)
PVC
Teflon (PTFE)
Epoxies
Phenolics
Polyester
KIC (MPa√m)
2
estimated from K IC
= E GIC /( 1 −ν 2 ) ≈ E GIC (as ν 2 ≈ 0.1 ).
Note: K IC only valid for conditions of linear elastic fracture mechanics
(see I. Formulae & Definitions). Plane Strain Toughness, GIC , may be
1
Polymer Foams
Thermoset
Thermoplastic
Polymers
Elastomer
1
FRACTURE TOUGHNESS (PLANE STRAIN), KIC
13
Ferrous
Natural
Composites
Metal
Polymer
Porous
Technical
Ceramics
Glasses
Non-ferrous
Metals
Bamboo
Cork
Leather
Wood
Aluminium/Silicon Carbide
CFRP
GFRP
Borosilicate Glass
Glass Ceramic
Silica Glass
Soda-Lime Glass
Brick, Concrete, Stone
Alumina
Aluminium Nitride
Boron Carbide
Silicon
Silicon Carbide
Silicon Nitride
Tungsten Carbide
Cast Irons
High Carbon Steels
Medium Carbon Steels
Low Carbon Steels
Low Alloy Steels
Stainless Steels
Aluminium Alloys
Copper Alloys
Lead Alloys
Magnesium Alloys
Nickel Alloys
Titanium Alloys
Zinc Alloys
Flammability
D
D
D
D
A
B
B
A
A
A
A
A
A
A
A
A
A
A
A
A
A
A
A
A
A
B
A
A
A
A
A
A
Fresh water
C
B
B
C
A
A
A
B
A
A
A
A
A
A
A
A
A
A
A
B
B
B
B
B
A
A
A
A
A
A
A
A
C
B
B
C
B
A
A
B
A
A
A
A
A
A
A
B
A
A
A
C
C
C
C
C
A
B
A
A
D
A
A
C
Salt water
II.6
Sunlight (UV)
B
A
B
B
A
B
B
A
A
A
A
A
A
A
A
A
A
A
A
A
A
A
A
A
A
A
A
A
A
A
A
A
D
B
B
D
B
C
C
A
A
B
A
C
A
A
A
B
A
A
A
A
A
A
A
A
B
C
A
C
C
B
C
E
Flexible Polymer Foams
Rigid Polymer Foams
Butyl Rubber
EVA
Isoprene (IR)
Natural Rubber (NR)
Neoprene (CR)
Polyurethane Elastomers (elPU)
Silicone Elastomers
ABS
Cellulose Polymers (CA)
Ionomer (I)
Nylons (PA)
Polycarbonate (PC)
PEEK
Polyethylene (PE)
PET
Acrylic (PMMA)
Acetal (POM)
Polypropylene (PP)
Polystyrene (PS)
Polyurethane Thermoplastics (tpPU)
PVC
Teflon (PTFE)
Epoxies
Phenolics
Polyester
Flammability
E
C
E
E
E
E
E
E
B
D
D
D
C
B
B
D
D
D
D
D
D
C
A
A
B
B
D
Fresh water
A
A
A
A
A
A
A
A
A
A
A
A
A
A
A
A
A
A
A
A
A
A
A
A
A
A
A
Salt water
A
A
A
A
A
A
A
A
A
A
A
A
A
A
A
A
A
A
A
A
A
A
A
A
A
A
A
C
B
B
B
B
B
B
B
B
C
B
B
C
B
A
D
B
A
C
D
C
B
A
B
B
A
A
Sunlight (UV)
For full names and acronyms of polymers – see Section V.
Ranking:
A = very good; B = good; C = average; D = poor; E = very poor.
(Data courtesy of Granta Design Ltd)
1
Polymer Foams
Thermoset
Thermoplastic
1
Polymers
Elastomer
ENVIRONMENTAL RESISTANCE
Wear resistance
14
D
E
B
B
B
B
B
B
B
D
C
C
C
C
C
C
C
C
B
C
D
C
C
B
C
C
C
Wear resistance
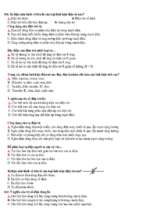
15
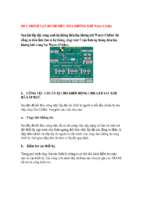
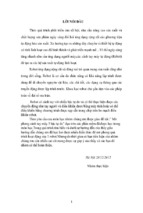
II.7 UNIAXIAL TENSILE RESPONSE OF SELECTED
METALS & POLYMERS
Figure 2.1 Tensile response of some common metals
Figure 2.2 Tensile response of some common polymers
16
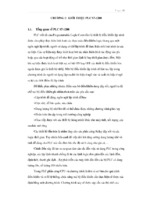
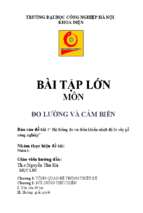
III. MATERIAL PROPERTY CHARTS
III.1 YOUNG’S MODULUS – DENSITY
Figure 3.1:
Young’s modulus, E , against density, ρ .
The design guide-lines assist in
selection of materials for minimum weight, stiffness-limited design. (Data courtesy of Granta
Design Ltd)
17
III.2 STRENGTH – DENSITY
Figure 3.2: Failure strength, σ f , against density, ρ . Failure strength is defined as the tensile
elastic limit (usually yield stress) for all materials other than ceramics, for which it is the
compressive strength. The design guide-lines assist in selection of materials for minimum weight,
strength-limited design. (Data courtesy of Granta Design Ltd)
18
III.3 YOUNG’S MODULUS – STRENGTH
Figure 3.3: Young’s modulus, E , against failure strength, σ f . Failure strength is defined as
the tensile elastic limit (usually yield stress) for all materials other than ceramics, for which it is
the compressive strength. The design guide-lines assist in the selection of materials for maximum
stored energy, volume-limited design. (Data courtesy of Granta Design Ltd)
- Xem thêm -