CAN THO UNIVERSITY
COLLEGE OF AQUACULTURE AND FISHERIES
GENETIC DIVERSITY OF CLIMBING PERCH
(Anabas testudineus BLOCH, 1792) POPULATIONS
BASED ON RAPD AND ISSR MARKERS
By
PHAM THI TRANG NHUNG
A thesis submitted in partial fulfillment of the requirements for
the degree of Bachelor of Aquaculture
Can Tho, December 2013
CAN THO UNIVERSITY
COLLEGE OF AQUACULTURE AND FISHERIES
GENETIC DIVERSITY OF CLIMBING PERCH
(Anabas testudineus BLOCH, 1792) POPULATIONS
BASED ON RAPD AND ISSR MARKERS
By
PHAM THI TRANG NHUNG
A thesis submitted in partial fulfillment of the requirements for
the degree of Bachelor of Aquaculture
Supervisor
Dr. DUONG THUY YEN
Can Tho, December 2013
ACKNOWLEDGEMENT
First of all, I want to thank to Can Tho university and college of
aquaculture and fishery for giving me a chance to study and complete this
course.
Also, I want to express my special thanks to my supervisor, Dr. Duong
Thuy Yen for her invaluable guidance, advice, caring and encouragement.
Many thanks are also given to all professors who taught our class, and
other teachers of the College of Aquaculture and Fisheries, and especially to
those of the Department of Freshwater Aquaculture for providing me with
great working and learning conditions.
I would love to express my sincere appreciation to many of my friends
and class Advance Aquaculture Program course 35 as well as my family for
supporting me.
i
ABSTRACT
Random amplified polymorphic DNA (RAPD) and inter-simple
sequence repeat (ISSR) techniques were used to evaluate genetic diversity of
four climbing perch (Anabas testudineus) populations including square-head
and 3 wild populations. Total 65 specimens were amplified using 7 primers (1
RAPD and 6 ISSR primers). The percentage of polymorphism and
heterozygosity ranged from 66.15% and 0.166 (Dong Thap) to 81.54% and
0.237 (Ca Mau), respectively. Therein, Ca Mau population had the highest
genetic diversity. Results also revealed that a high portion of total genetic
variation existed within populations (91%), while genetic differentiation
among populations was low (Gst value 0.0859), accounting for 9% of total
genetic variation. Based on Nei’s genetic distance, the highest dissimilarity
was observed between Dong Thap and each of the other populations. This
study indicated that RAPD and ISSR techniques can be useful for genetic
diversity studies in fish.
ii
TABLE OF CONTENTS
ACKNOWLEDGEMENT .................................................................................. i
ABSTRACT....................................................................................................... ii
TABLE OF CONTENTS.................................................................................. iii
LIST OF FIGURES .......................................................................................... vi
LIST OF ABBREVIATIONS .......................................................................... vii
INTRODUCTION ............................................................................................. 1
1.1
General introduction ................................................................................ 1
1.2 Research Objectives:.................................................................................... 2
1.3 Research Contents: ...................................................................................... 2
CHAPTER 2 ...................................................................................................... 3
LITERATURE REVIEW .................................................................................. 3
2.1 Distribution of climbing perch ..................................................................... 3
2.2 Biological characteristics of climbing perch ............................................... 3
2.2.1 Classification and taxonomy..................................................................... 4
2.2.2 Morphological characteristics of climbing perch .................................. 4
2.2.3 Feeding behavior of climbing perch ...................................................... 4
2.2.4 Growth characteristics ........................................................................... 5
2.2.5 Spawning ............................................................................................... 5
2.3 Genetic diversity .......................................................................................... 6
2.3.1 Definition of genetic diversity............................................................... 6
2.3.2 Importance of genetic diversity ............................................................. 6
iii
2.4 Genetic markers commonly used to study genetic diversity ....................... 6
2.5 Studies of genetic diversity of fish and shrimp populations using RAPD
and ISSR ............................................................................................................ 9
2.5.1 Studies of genetic diversity of fish and shrimp populations using
RAPD ............................................................................................................. 9
2.5.2 Studies of genetic diversity of species using ISSR ............................. 10
2.6 PCR reaction method ............................................................................... 11
2.6.1 Principle of PCR reaction .................................................................... 11
2.6.2 Some main factors affect PCR reaction .............................................. 11
2.6.3 Application of PCR method ................................................................ 12
CHAPTER 3 .................................................................................................... 13
MATERIALS AND METHODS .................................................................... 13
3.1 Time and sites of study .............................................................................. 13
3.2 Materials .................................................................................................... 13
3.3 Methods ..................................................................................................... 14
3.3.1 Fish sampling ...................................................................................... 14
3.3.2 DNA extraction ................................................................................... 14
3.3.3 Electrophoresis .................................................................................... 15
3.3.4 Screening primers and optimize PCR conditions ................................ 15
3.3.4 PCR reaction........................................................................................ 19
3.3.4 Data scoring ......................................................................................... 20
3.3.5. Data analysis ....................................................................................... 20
RESULTS AND DISCUSSION ...................................................................... 21
4.1. Result ........................................................................................................ 21
4.1.2. Genetic diversity of climbing perch populations ............................... 26
4.1.3. Genetic differentiation among climbing perch population ................ 27
CHAPTER 5 .................................................................................................... 32
CONCLUSION AND RECOMMENDATION .............................................. 32
iv
LIST OF TABLES
Table3.1. Selected primers with sequence, GC content, melting temperature
for RAPD and ISSR analysis in climbing perch. .......................................................16
Table 3.2 Optimize MgCl2 and primer (OPA08) concentrations .........................17
Table 3.3 Gradient temperatures used to optimize PCR conditions of ISSR
primers.......................................................................................................................................18
Table 3.5 PCR components ...............................................................................................19
Table 4.1.The size and number of PCR products for all primers .........................26
Table 4.2 Genetic diversity parameters (Mean ± SE) of 4 climbing perch
populations based on 7 primers (1 RAPD + 6 ISSR) ..............................................27
Table4.3. Pairwise population matrix of Nei genetic identity (under the
diagonal line) and genetic distance among populations ..........................................28
Table4.4. Analysis of genetic variance (AMOVA) of 4 climbing perch
populations...............................................................................................................................28
v
LIST OF FIGURES
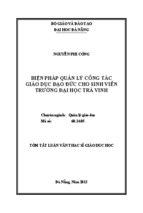
Figure 2. External appearance of climbing perch .............................................. 3
Figure 4.1. Test OPA 09 for different samples of 4 populations. .................... 21
Figure 4.2. Test OPA 07 with gradient temperature. ....................................... 22
Figure 4.3. Testing primer OPAH 08 with different concentrations of MgCl2
and primer for two samples CM 3p and HG4.................................................. 23
Figure 4.4. Testing ISSR 06 with different concentrations of MgCl2 and
temperatures for two samples CM42 and CM43 . ........................................... 24
Figure 4.5.Test 5 primers ISSR 01, ISSR 05, ISSR 11, ISSR 14, ISSR 15 with
3 samples DV 55D, DT 41, and CM 21. ......................................................... 25
Figure 4.6. Test ISSR 15 at different annealing temperature for 4 samples DV
60C, HG12, DT 31, CM 18. ............................................................................ 25
Figure 4.8. UPGMA consensus tree of Nei’s (1978) genetic distances between
populations from four A.testudineus populations. ........................................... 28
vi
LIST OF ABBREVIATIONS
µg
Microgram
µl
Microlitter
AFLP
Amplified fragment length polymorphism
bp
Base pair
DArT
Diversity Arrays Technology
DNA
Deoxyribonucleic acid
dNTP
Dinucleotid tripgotphate
EDTA
Ethylenediamine
ISSR
Inter-Simple Sequence Repeat
MgCl2
Magenium Chloride
mM
milimolar
mtDNA
Mitochrondrial DNA
NaCl
Potassium chloride
ng
Nanogram
PCR
Polymerase Chain Reaction
RAD marker
Restriction site associated DNA markers
RAPD
Random Amplified Polymorphic DNA
RFLP
Restriction fragment length polymorphism
SDS
Sodium dodecyl sunphate
SNP
Single nucleotide polymorphism
SSLP
Simple sequence length polymorphism
TBE
Tris borate Ethylenediamine
TE
Tris Ultrapure and Ethylenediamine
VNTR
Variable number tandem repeat
vii
CHAPTER 1
INTRODUCTION
1.1
General introduction
Climbing perch (Anabas testudineus) is one of the most common
freshwater fish in tropical and subtropical Asia, widely distributing in
Pakistan, Bangladesh, Nepal, Bhutan (probable), Sri Lanka, India, Indonesia,
southern China, Myanmar, Thailand, Cambodia, Laos, Vietnam, Malaysia,
Brunei Darussalam and Singapore (www.fishbase.org). This species is also
one of main aquaculture species, popularly cultured over the Mekong Delta of
Viet Nam (Truong Thu Khoa and Tran Thi Thu Huong, 1993) because of its
high nutrition value, fast growth, easy cultivation, high market demands, and
high tolerance to adverse environmental conditions (Pethiyagoda, 1991). In
2009, a new strain of climbing perch was found in cultured conditions. It has
square head (therefore it is called square head climbing perch), faster growth,
and bigger size than the normal one. It was reported that the first batch of
square head broodstock consisted of only 70 individuals. If so, genetic
diversity of this strain could be low.
Nowadays, many species have trended to increase potential of threatens
due to environmental changes, competition for water resources, unregulated
fishing, and high population growth (Sverdrup-Jensen, 2002). In addition,
aquaculture practices are more growing, which probably inadvertently reduces
genetic variability of species due to inappropriate selection and inbreeding
(Wasco et al., 2004). And climbing perch is not an exception, neither. Fish
population has declined more and more rapidly. Therefore, genetic diversity is
very important for a species or population to adapt to continuous changes of
the environment. Conservation of genetic variability is essential for the wellbeing of present and future generations (Akram and Kianoosh, 2012).
Investigating genetic diversity of wild and cultured climbing perch is very
important not only for domestication, conservation and sustainable
development as well as for further breeding program of the species.
Recently, advances in molecular biology techniques have provided
numerous DNA markers and methods for studying genetic diversity of
1
different species (Akram and Kianoosh, 2012). Over the last decade,
polymerase chain reaction (PCR) technique has become widespread and
popular due to simplicity and high profitability of success (Bardakci, 2001).
Over other techniques, random amplified polymorphic DNA (RAPD) and
inter-simple sequence repeat (ISSR) techniques have been attracted many
scientists’ interest. These techniques are simple and cost-effective, create high
reproducible and polymorphic bands, require small amount of DNA without
requiring flanking sequence characteristics as other methods. RAPD and
newly applicable ISSR markers have been successfully used in genetic
diversity analysis of some aquatic species (Chen and Leibenguth, 1995; Partis
et al. 1996; Ali et al. 2004; Nie et al. 2012; Saad et al. 2012; Zhigileva et al.
2013; Dexiang et al. 2007).
Despite the importance of the species in aquaculture and genetic
conservation, few researches have been focused on genetic diversity of
A.testudineus in their naturally distributed areas, especially, in the Mekong
delta of Viet Nam. Therefore, this study aimed to evaluate genetic diversity of
climbing perch populations distributed in the Mekong Delta using RAPD and
ISSR techniques. The study would provide basic information for further
breeding and conservation programs of the species.
1.2 Research Objectives:
To evaluate genetic diversity based on RAPD and ISSR makers of
climbing perch population distributed in the MeKong Delta, providing basic
information for further breeding and conservation program.
1.3 Research Contents:
-
Optimize PCR conditions for 10 universal RAPD and 10 ISSR primers
-
Genetic diversity of climbing perch populations
-
Genetic difference among climbing perch populations
2
CHAPTER 2
LITERATURE REVIEW
2.1 Distribution of climbing perch
Climbing perch is a freshwater species, distributed wildly in tropical
regions, mainly in islands between Indian and Australia, Africa, and in
Southeast Asia, climbing perch is distributed in Thailand, Lao, Cambodia,
Myanmar and Viet Nam where average temperature is very compatible for
grow of climbing perch (22-300C) . They are likely to live in shallow water
with lots of plankton and organic matter (Kottelat, 2001).
In Viet Nam, climbing perch is popular around the country. Climbing
perch live in rice fields, lakes, rivers; they can also live in estuarine.
Square head climbing perch has been found since 2009 in Hau Giang
province.
2.2 Biological characteristics of climbing perch
Figure 2. External appearance of climbing perch
3
2.2.1 Classification and taxonomy
Class:
Osteichthves
Subclass:
Neoptervgii
Superordo:
Acanthoptergii
Ordo:
Perciformes
Farmilia:
Anabantidae
Genus:
Anabas
Species:
Anabas. testudineus
(Bloch, 1792)
There are two phenotypes of climbing perch: normal climbing perch
and square head climbing perch. Square head climbing perch was just found in
2009. It looks similar to the normal climbing perch except its square head.
However, square head has some advantages compared to the normal one such
as bigger than the normal climbing perch, high growth rate, male and female
has similar growth rate; thus its production and market have developed very
fast, bring more income for fish farmers.
2.2.2 Morphological characteristics of climbing perch
Climbing perch has a well-balanced oval body which is covered by
scales with black or grey spots on the outer edge. They have big eyes in front
of their head. Their odd and even fins all have hard spikes. Operculum bone
has incisors and rounded caudal fin which is not divided into lobes. Among
the caudal peduncle has a bunch of black pigments which are lighter when
climbing perch is mature (Truong Thu Khoa and Tran Thi Thu Huong, 1993).
Furthermore, climbing perch has air breath organ that helps them tolerance
with the adverse environmental conditions.
Square head climbing perch looks like the normal climbing perch when
it is young. When it grows up, it has big and square head, dark yellow scales,
pink and spread tail, pretty curve and long body with two black spots near the
gills and tail.
2.2.3 Feeding behavior of climbing perch
Climbing perch start eating at the 3rd day. It is an omnivorous species
who consumes a variety of food items such as fish, shrimp, crustaceans,
4
worms, mollusks, detritus, aquatic plants, rice, and insects (Duong Nhut Long
2003). When it grows up, it can eat many types of food, in which animal feeds
are dominant. In addition, it’s possible to eat processed food and agriculture
by-product very well.
2.2.4 Growth characteristics
The size of normal climbing perch is quite small and growth rate is
pretty slow compared with other species. In the Mekong Delta, the average
size of climbing perch is about 60-120 g/individual. Normally for many fish,
the male is bigger than the female. In contrast for climbing perch, the male is
smaller than the female. In culture ponds, if it is fed enough food, after 6
months, it can reach 60-80 g/individual. Common length of climbing perch is
about 12 cm and can reach maximum 25 cm (Talwar and Jhingran, 1991).
Square head climbing perch grows very fast compare to the normal
climbing perch. The male and female has similar growth rate. This makes it
different from normal climbing perch. Female has growth rate as twice as
male. After 4-5 months, it can reach 0.1-0.2 kg/individual and 0.4-0.6
kg/individual in 7 months. In contrast to the normal climbing perch, the longer
we culture square head climbing perch, the bigger it is (Phuong Thanh, 2010).
2.2.5 Spawning
Climbing perch has intermittent spawning behavior. It does not build a
nest or prepare a spawning substrate, and does not provide parental care to its
offspring, neither. Mating system of the climbing perch is either polygamy or
promiscuity. Sexual dimorphism in the climbing perch was not found. The
eggs of the climbing perch have positive buoyancy and floating, which is rare
for freshwater fish (Zworikin, 2012). Climbing perch has high fecundity,
about 300,000-700,000 eggs/kg female. The mature eggs often have ivory or
yellowish white color. Water swollen eggs have diameter about 1.2-1.3 mm
(Marimuthu et al., 2009).
Climbing perch is one of fish species that are mature early. In nature,
the smallest one that gets maturity is about 25 g. Square head climbing perch
gets mature after 8 months. In the Mekong Delta, climbing perch spawn in
rainy season, mainly from June to July. Normally after heavy rains, it all
spawns. When spawning, it usually finds places where water is cool and has
slow flows. Water current is the main factor stimulates the excitement and
5
spawning of climbing perch. 0.3-0.4 m water level is compatible for climbing
perch to spawn.
2.3 Genetic diversity
2.3.1 Definition of genetic diversity
Genetic diversity is the diversity of gene segments between individuals
of the same species and among species. Genetic diversity can be inherited in a
population or among populations (www.wiseGeek.com).
2.3.2 Importance of genetic diversity
Genetic diversity plays an important role in evolution by allowing
species to adapt to a new environment. Analysis of genetic diversity is a key
element for the study of biodiversity, ecosystem functioning, and the
consequences of man-made impact on natural systems such as climate change,
habitat fragmentation, and biological invasions. It’s very important for the
ecology and has great effects on ecological processes such primary
productivity, population recovery from disturbance, interspecific competition,
community structure, and fluxes of energy and nutrients (Hughes et al., 2008).
Decreased population genetic diversity can lead to reduce fitness of the
population. Furthermore, in low genetic diversity population, the combination
of declined fitness and increase variability can increase extinction rate of that
population (Markert et al., 2010).
2.4 Genetic markers commonly used to study genetic diversity
There are some commonly used genetic markers:
Random amplification of polymorphic DNA (RAPD):
RAPD markers are decamer (10 nucleotide length) DNA fragments from PCR
amplification of random segments of genomic DNA with single primer of
arbitrary nucleotide sequence and which are able to differentiate between
genetically distinct individuals. The ease and simplicity of RAPD make it
ideal for individual and pedigree identification, pathogenic diagnostics, and
trait improvement in genetics and breeding programs (Yoon and Kim, 2001;
Holsinger et al., 2002).
RAPD technique has further advantages compared to other techniques
because it has a universal set of primers and does not require preliminary work
6
such as probe isolation, filter preparation, or nucleotide sequencing (Williams
et al., 1990). There are many researches use RAPD for various purposes such
as discrimination of species, identification of endangered species, genetic
diversity, gene mapping, for breeding program…. In many cases, only a small
amount of primers are required for detecting polymorphism (Williams et al.,
1990). In some cases, a single primer may often be sufficient to distinguish all
of the sampled varieties (Mulcahy et al., 1995). In addition, RAPD
fingerprinting offers a rapid and efficient method for generating a new series
of DNA markers in fishes (Foo et al., 1995). Especially, this method is
suitable when finance is limited.
However, like other techniques, RAPD also has some limitations we
should concern about. It’s a dominant marker; hence we cannot distinguish
between homozygous and heterozygous individuals because of the presence of
bands. Besides, RAPD is not high repeatable due to random primer and
depend much on PCR conditions.
Microsatellite polymorphism, Inter-Simple
Sequence
Repeat
(ISSR): is RAPD- like approach that assesses variation in the microsatellite
regions dispersed throughout the various genomes of eukaryotes (Schulz,
2004). Microsatellites are very short stretches of DNA (usually 10-20
basepairs) that are very hypervariable, showed as different variants within as
well as among populations. These short microsatellites are mono-, di-, or trinucleotide repeats. However, the most popular repeats used are di- or trinucleotides. ISSR technique has similar protocol as RAPDs, except that ISSR
primers anneal to terminal parts of microsatellite regions. In addition, ISSR
annealing temperatures is higher than RAPD technique and vary among
different primers with different base compositions (Pharmawati et al., 2005).
Normally, the optimal annealing temperatures range 45-50oC (Jabbarzadeh at
al., 2010).
These are many advantages of ISSR that are definitely suitable for
detecting genetic diversity. First of all, this method requires small quantity of
DNA. Besides, it provides dominant, reproducible and large number of
markers. Additionally, this method allows to investigate in large scale genetic
mapping and population studies. Furthermore, this method has extremely high
variability and high mapping density compare to RAPD and RFLP. Also,
ISSR doesn’t require flanking sequence characteristics as other methods.
7
Of course, nothing is perfect for everything in whatever case and so
does ISSR. The limitation of this method is that it’s dominant marker, we
can’t distinguish individuals that are heterozygous or homozygous of DNA
bands at specific position (Kosman and Leonard, 2005) and hence not as
informative as SSRs (Genet, 1983).
Restriction fragment length polymorphism (RFLP): is a technique
that exploits variations in homologous DNA sequences. RFLP analysis is the
first DNA profiling technique inexpensive enough to see widespread
application. RFLP is an important tool in genome mapping, localization of
genes for genetic disorders, determination of risk for disease, and paternity
testing (Welker et al., 1986).
Amplified fragment length polymorphism (AFLP): is a PCR-based
tool used in genetic research, DNA fingerprinting, and in the practice of
genetic engineering. AFLP uses restriction enzymes to digest genomic DNA,
followed by ligation of adaptors to the sticky ends of the restriction fragments.
AFLP-PCR is a highly sensitive method for detecting polymorphism in DNA
(Vos et al., 1995).
Variable number tandem repeat (VNTR): is a location in
a genome where a short nucleotide sequence is organized as a tandem repeat.
It’s often referred to as micro- or minisatellite DNA, are ubiquitous in
eukaryotes and humans.VNTR typing generates portable digit-based data.
VNTR-based PCR analysis is easy, rapid, and highly specific and can be
conducted worldwide for genetics and biology research, forensics, and DNA
fingerprinting (Smittipat et al., 2005). Each variant acts as an inherited allele,
allowing them to be used for personal or parental identification.
Single
nucleotide
polymorphism
(SNP):
is
a DNA
sequence variation occurring when a single nucleotide — A, T, Cor G — in
the genome (e.g. in exons, introns, intergenic regions, in promoters or
enhancers, etc) differs between members of a biological species or
paired chromosomes in a human. Common SNPs has only 2 alleles. The
genomic distribution of SNPs is not homogenous. SNPs usually occur in noncoding regions more frequently than in coding regions or, in general, where
natural selection is acting and fixating the allele of the SNP that constitutes the
most favorable genetic adaptation (Schork et al., 2000).
8
Restriction site associated DNA markers (RAD marker): useful for
association mapping, QTL-mapping, population genetics, ecological genetics
and evolution. Isolating RAD tags is an important part in RAD marker and
mapping. Isolated RAD tags can be used to identify and genotype DNA
sequence polymorphisms mainly in form of SNPs (Chutimanitsakun et al.,
2011).
2.5 Studies of genetic diversity of fish and shrimp populations using
RAPD and ISSR
2.5.1 Studies of genetic diversity of fish and shrimp populations
using RAPD
RADP technique was invented and used as soon as PCR technique has
been introduced. Even though RAPD technique doesn’t give a high reliable
consequence, it is used due to low cost and easy way to use. RAPD is used to
evaluate genetic diversity.
In fisheries and aquaculture, RAPD is used to estimate genetic diversity
and genetic difference among populations. For instance, five randomly primer
pairs are used to compare genetic difference between freshwater prawn strains
in Viet Nam and China. . The result showed that there are genetic different
between those strain. There are 14.9 alleles of fresh water prawn in China, and
12.9 alleles for Viet Nam strain. Genetic diversity value of Chinese prawn
strain is 0.156; 0.84-0.88 and 0.179; 0.86-0.88 for Viet Nam strain (Nguyen
Thanh Tam and Pham Thanh Liem, 2012). The authors concluded that fresh
water prawn in China in this experiment may be of the same species of
Macrobrachium rosenbergii that has had long domesticated process.
In addition, genetic variation of grass carp and common carp
populations could be evaluated by using RAPD (Huaiyun et al., 1998). As
consequently, RAPD patterns of grass were significant different from those of
common carp. Genetic distance and band sharing between them were 0.2583
and 0.2394. In contrast, RAPD patterns of red common carp and common carp
were pretty similar to each other. Genetic distance and band sharing between
them were 0.7612 and 0.0947. The genetic variability of grass carp, red
common, and common carp were 0.18, 0.29, 0.26, respectively.
Besides, Bardakci and Skibinski (1994) used RAPD to identify three
species of tilapia genus Oreochromis and four subspecies of O. niloticus. They
9
manipulated thirteen random primers for detecting polymorphism within as
well as between populations. Different RAPD patterns were inspected for
varies species. The result indicated that RAPD marker was possibly
subservient for investigation of species as well as subspecies.
Also, RAPD was used to evaluate genetic diversity and genetic distance
among redbreast sunfish that lived in reference and contaminated streams
(Nadig et al., 1998). They used thirteen primers which produced 45
polymorphic bands among all population. Consequently, fish that lived in
contaminated streams had little different result to the others. They had less
genetically distant from each other than they lived in reference sites. In sum,
application of RAPD could be useful for analysis differences in genetic
distance between populations of sunfish.
2.5.2 Studies of genetic diversity of species using ISSR
ISSR is not as popular to use as RAPD. In the past, there were also
many researchers used ISSR in genetic diversity study or other purposes.
However, they have been applied more in plants, and less for animals
including fish. Some studies in fish using this type of marker have been
published recently.
Schulz (2004) with his assistants used ISSR to assess DNA variations
of the noble crayfish (Astacus Astacus L.) in Germany and Poland. In this
research, total 22 unambiguous and polymorphic markers were detected. The
result showed that the number of polymorphic loci in one population ranged
from 4 to 19. The author concluded that ISSR proved suitable for DNA
variation and establishing separation of the stock. The study also showed the
correlation of the result on the local, regional and supra-regional levels.
In addition, Varela (2007) with his assistants applied ISSR to assess
genetic differentiation in six sampling localities distributed along the
European Atlantic coast to expose the potential of these markers in genetic
studies and as a source of sequences for developing microsatellite markers. As
the result, 51 ISSR markers were found 148 microsatellites and 2 polymorphic
microsatellites were developed. The author found that mussels of a sampling
locality in the Baltic Sea were not significantly different from a pure M. edulis
locality supporting an extensive introgression of M. edulis in these individuals.
In another case, ISSR was used to analyze genetic variation of the
bivale G.gema between marine and Virginia USA, among 10-m-diameter
10
patches within localities, and within patches (Casu et al., 2005). They
investigated 30 individuals/patch and 3 patches/locality. Five primers ISSR
were used and found out 67 polymorphic loci. The result revealed significant
differentiation at individual and patch levels while genetic variation between
localities was low.
2.6 PCR reaction method
Polymerase chain reaction (PCR) enables researchers to produce
millions of copies of a specific DNA sequence in approximately two hours.
This automated process bypasses the need to use bacteria for amplifying DNA.
2.6.1 Principle of PCR reaction
PCR method (polymerase chain reaction) was invented in 1985 by Kary
Mullis with his assistances. This method uses pairs of primer to synthesize a
large amount of transcriptions from a special DNA sequence base on activity
of enzyme polymerase.
PCR method base on activity of DNA polymerase in proceed of
synthesizing a new DNA from primary DNA. We need short DNA segments
as primer for taq DNA polymerase to anneal to the complementary sequences.
After that, taq polymerase attaches to priming sites and extend to synthesize
the new perfect strand.
PCR reaction is a chain of continuous sequences, each sequence
include 3 stages:
Denature DNA: separate DNA into single strands. Sample is
heated to 94-960C in one to several minutes.
Anneal primer: temperature is lower to 50-650C for one to
several minutes. This step allows the left and right primers to anneal to their
complementary sequences. This stage decides the specificity of reaction.
Extension: temperature is again raised to 720C for one to several
minutes. This allows taq polymerase to attach at each priming site and extend
(synthesize) a new DNA strand.
2.6.2 Some main factors affect PCR reaction
There are many factors affect PCR reaction as template DNA, enzymes
(taq polymerase), type and concentration of primers, temperature and time,
nucleotide concentration, buffer, Mg2+ concentration, dNTP, number of
11
- Xem thêm -