FLAT BED DRYING INCLUDING
SURVEY RESULTS ON THE DRYING
COSTS OF VARIOUS DRYING METHODS
PRACTICED IN MEKONG DELTA "
SECTION 3
FLAT BED DRYING INCLUDING SURVEY RESULTS ON THE DRYING COSTS
OF VARIOUS DRYING METHODS PRACTICED IN MEKONG DELTA
93
CARD Project
FLAT-BED DRYER
Sub-Component
2006/2007 Report
Reporting period:
from 15 May 2006 to 28 Feb 2007
Compiled by: Phan Hieu Hien, Ph.D.
with contributions from staff
of the NLU Center for Agricultural Energy and Machinery:
Le Quang Vinh,
Tran Thi Thanh Thuy,
Tran Van Tuan,
Nguyen Thanh Nghi.
March 2007
94
CONTENTS
CARD PROJECT, FLAT-BED DRYER SUB-COMPONENT 2006 REPORT.....96
1
INTRODUCTION.....................................................................................................96
2
INSTALLATION OF THE 8-TON FLAT-BED DRYER....................................96
3
EXPERIMENTS WITH THE 8-TON DRYER UNDER ACTUAL
PRODUCTION CONDITIONS..............................................................................98
4
5
3.1
Objectives.........................................................................................................98
3.2
Materials and methods...................................................................................98
3.3
Results and discussion:.................................................................................98
3.3.1
July 2006 experiments .............................................................................98
3.3.2
March 2007 experiments..........................................................................98
FABRICATION OF A LAB (MINI) DRYER FOR EXPERIMENTING
UNDER CONTROLLED CONDITIONS. ...........................................................99
4.1
Objective ..........................................................................................................99
4.2
Materials and methods...................................................................................99
4.3
Results and discussion (1-to dryer) ...........................................................104
THE PRRA SURVEY ON THE USE OF FLAT-BED DRYER AND THE
COST OF VARIOUS DRYING METHODS IN THE MEKONG DELTA. ...110
5.1
Background ...................................................................................................110
5.2
Objectives.......................................................................................................110
5.3
Method...........................................................................................................110
5.4
Result and discussion....................................................................................110
5.4.1
Background data ....................................................................................110
5.4.2
Post-harvest and drying status .............................................................112
5.4.3
Conclusions............................................................................................114
6
EXTENSION MATERIALS FOR TRAINING COURSES, BASED ON THE
OUTCOME OF THE SURVEY AND EXPERIMENTS .................................115
7
CONCLUSIONS AND FURTHER PROPOSALS ...........................................116
8
EVALUATION OF FARMERS’ PRACTICE .....................................................117
8.1
9
Value losses due to field drying and sun drying ..........................................117
REFERENCES ........................................................................................................118
10 APPENDIX ..............................................................................................................119
10.1
Appendix 1 : Paddy milling quality analysis (procedure by IRRI) ............119
95
CARD Project, FLAT-BED DRYER Sub-Component
2006 Report
(from 15 May 2006 to 28 February 2007)
1
INTRODUCTION
The sub-component of CARD Project 026/VIE-05 on the flat-bed dryer study, as specified in
the contract, consists of the following activities:
• Select the site and supervise the installation of an 8-ton flat-bed dryer for experiments.
• Conduct experiments with the 8-ton dryer under actual production conditions.
• Build a lab (mini) dryer and other needed tool for experimenting under controlled
conditions.
• Conduct experiments to determine the optimum drying conditions for the flat-bed dryer
(with or without air reversal) using the lab mini-dryer at the Nong-Lam University or a
nearby location.
• Conduct a Participatory Rapid Rural Appraisal (PRRA) survey on the use of flat-bed
dryer in the Mekong Delta.
• Write extension materials for future training courses, based on the outcome of the survey
and experiments.
The above activities can be clustered into 3 groups:
- The 8-ton dryer
- The 1-ton dryer
- Survey, training, and extension
This is the final report of the above-mentioned activities, covering the period from 15 May
2006 to 28 Feb 2007. It is compiled from 2 earlier Progress Reports, and updated with most
recent data and findings, thus conclusions from this report supercede the earlier reports for
any discrepancies.
2
INSTALLATION OF THE 8-TON FLAT-BED DRYER
Together with the Project Leader, Dr. Truong Vinh, we selected the site for installing the
8-ton flat-bed dryer; the site was Tan-Phat-A Cooperative, located in Tan-Hiep District,
Kien Giang Province.
At first, we intended to contract from a local dryer builder for a typical dryer in the region,
adding features needed for the experiment, but no contractor was willing to meet the needs
they considered too time-consuming with these added features in a miscellaneous contract for
their business. So, the research team decided to build an 8-ton air-reversible dryer which is a
SRA-8 design from NLU with slight modifications.
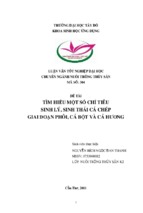
The installation of the dryer was completed in mid-July 2006 (Fig.1 & 2), just in time for the
wet-season harvest and for experimental purposes.
96
Figure 1: The 8-ton dryer at Tan-Phat-A Cooperative, Kien Giang
Figure 2: The 8-ton dryer with the air for downward direction .
97
3
EXPERIMENTS WITH THE 8-TON DRYER
UNDER ACTUAL PRODUCTION CONDITIONS.
3.1
Objectives
To determine the performance of the dryer under actual production conditions, for different
drying regimes.
3.2
Materials and methods
The experiments were conducted in July 2006 Tan-Phat-A Cooperative, Tan-Hiep District,
Kien-Giang Province. Eight experiments were done, with 2 factors under study.
•
Air reversal at 2 levels: a) YES , and
•
Drying temperature at 2 levels:
a) Constant at 43 oC ; and b) At 50 oC for the
first hour, and afterwards constant at 43 oC. In reality, due to the furnace
configuration, the temperature rarely exceeded 50 oC, and was about 48 oC at most.
b) NO
Each treatment was replicated twice. However, due to severe difficulty in securing batches of
the same quantity or initial moisture content, the experiments were not strictly factorial. The
arrangement of factor levels is for systematic observation only.
Due to different views on milling analysis, data on head rice recovery were discarded. Thus
in March 2007, another set of experiment was replicated, with focus on comparing the crack
and head rice recovery of 2 different drying modes, namely with and without air reversal. Sun
drying on the cement drying yard with a 7-cm paddy layer, as popularly practiced by local
farmers, was replicated as control treatment.
The crack analysis was done at the VINACONTROL, an accredited agency in charge of
certifying the rice quality for export. Each treatment was analyzed by 3 samples, each
consisting of 30 grains taken at random; each paddy grain was hand-husked and examined
under the magnifying glass for fissure.
The head rice recovery analysis was done at the Rice Quality Laboratory of the NLU
Chemical Technology Department, following procedures adopted by International Rice
Research Institute (see Appendix) and the University of Queensland.
3.3
Results and discussion:
3.3.1
July 2006 experiments
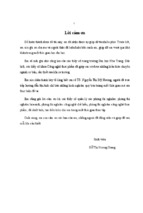
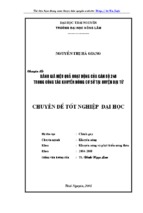
The experiment results are summarized in Table 1. Figures 3 and 4 show the moisture
reduction curves. Remarks:
-
The effect of air reversal is very apparent in reducing the final moisture differential.
When operated correctly, this differential is less than 2 % with air reversal, but at least
5% without air reversal. More MC differential means more rice cracking during milling.
This explains why dryers installed since 2003 have been more and more of the reversible
principle.
-
Air reversal also decreased the drying time.
-
The drying temperature is stable and can be kept within ± 3 oC.
3.3.2
March 2007 experiments
Results are in Table 2. All 3 above observations hold with these new experiments.
Data on the crack of rice upon milling show that:
98
a) Mechanical drying, whether with or without air reversal, is superior to sun drying in terms
of less crack percentage or more head rice recovery. About 3- 4 % less cracking, and
about 4 % more head rice recovery are main data obtained from this set of experiments.
b) Mechanical drying with air reversal resulted in less Final MC differential (2.2 %)
compared to without air reversal (4.6 %)
c) The increase in crack percentage between mechanical drying with and without air differed
by only 1 %; while judged by the head rice recovery, the difference was only 0.4 %, or
almost no difference (Table 2). This was not expected in line with the above data on
Final MC differential. Thus more experiments should be conducted in the future to
confirm the trend.
4
FABRICATION OF A LAB (MINI) DRYER
FOR EXPERIMENTING UNDER CONTROLLED CONDITIONS.
4.1
Objective
To determine the performance of the 1-ton dryer under controlled conditions.
4.2
Materials and methods
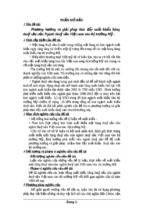
A lab mini-dryer of maximum capacity of 1 ton was designed and fabricated for
experimenting under controlled conditions.. (Fig.5)
(a)
(b)
Figure 5: The 1-to dryer: Airflow upward;
(b) Downward reverse airflow
99
Table 1: Summary of 8 drying batches (July 2006 )
2523-7
25-7
Date /2006
26/7
30-7
24-7
27-7
23-7
29-7
Batch Number
1
5
4
8
3
6
2
7
Temperature, oC
43
43
43
43
48
x43
48
x43
48
x43
48
x43
Air reversal
Yes
Yes
No
No
Yes
Yes
No
No
Drying time, h+xx/100
10.42
6.00
10.50
8.75
10.00
3.58
5.75
11.67
Air reversal time, minute
10
15
---
---
15
10
---
---
---
---
60
---
---
---
---
Break-down time, minute
Ave
Initial MC, %
27.4
19.3
21.5
24.5
25.6
20.7
25.6
26.0
Final MC: Bottom, Max:
9.1
13.9
11.7
13.2
13.4
14.1
8.1
12.8
Final MC: Bottom, Min:
5.9
12.1
11.2
11.2
12.2
13.1
6.1
10.6
Final MC: Bottom, Ave,%:
8.2
13.4
11.6
12.0
12.7
13.6
7.6
11.3
Final MC: Top, Max:
15.5
14.9
23.1
22.7
17.3
15.2
13.0
22.6
Final MC: Top, Min:
15.2
13.3
15.2
15.5
15.8
14.4
12.2
17.8
Final MC: Top, Ave, %:
15.3
14.2
18.9
19.1
16.5
14.8
12.5
20.4
7.1
0.8
7.3
7.1
3.8
1.2
4.9
9.1
10.13
9.72
10.23
9.62
10.23
9.78
9.78
9.71
0.28
0.22
0.16
0.17
0.16
0.22
0.15
0.20
5.31
5.10
5.37
5.05
5.37
5.13
5.13
5.10
5.19
42.8
42.5
43.3
41.4
42.2
44.8
42.2
44.3
42.9
2.0
2.8
2.4
2.8
3.6
2.8
3.6
3.2
2.9
16.2
16.25
12.41
12.14
12.0
11.83
12.0
12.20
13.1
Bulk density:Before, kg/m
521
505
529
495
529
525
522
523
519
After drying, kg/m3
480
484
465
493
498
515
477
503
489
Paddy : BEFORE, kg
8338
7246
8185
7860
8805
8724
5307
9438
AFTER drying, kg
6946
6564
---
7368
7462
7706
4599
8307
Grain depth: BEFORE, m
0.508
0.456
0.491
0.504
0.528
0.528
0.323
0.573
AFTER drying, m
0.459
0.431
---
0.474
0.475
0.475
0.306
0.524
416.4
206.4
220.9
282.2
371.5
138.9
160.5
373.0
39.95
34.40
21.04
36.41
37.16
38.80
27.92
31.96
18.0
17.0
16.6
12.0
17.00
6.0
9.50
17.0
1.73
2.83
1.58
1.55
1.70
1.68
1.65
1.46
Final MC differential, %
Air SUPERFICIAL Velocity
Average , m /minute
± Std. Dev., m /minute
AIR FLOW, m3/s
Av. Drying temp, oC
± Std.Dev, oC
Temp. Increase, oC
3
Husk consumption: Total, kg
kg/ hour
Diesel consump. :Total, Lit
Lit/ hour
9.90
33.45
1.77
100
Table 2:
SUMMARY results of March 2007 experiments: Comparison of 2 drying batches
Batch 1
(46+43 oC, with air reversal).
Batch 2 (46 x43 oC, WITHOUT air reversal)
(46 x43 = 46 oC in first 1,5 hours, &43 oC in remaining time)
Place Tan Phat A Cooperative, Ken Giang Province. Date: March 2007
Batch Number
Batch 1
Batch 2
Air reversal
Yes
Drying temperature (oC) ± StDev
No
43.3
± 3.1
43.0
START date-time
08-03-07 10:30
10-03-07 11:30
END date-time
08-03-07 16:30
10-03-07 17:30
6.00
6.00
Drying time, h+xx/100
Air reversal time, minute
± 2.9
15
Laborer for air reversal
2
Initial MC, % (Ave ± StDev)
23.86
Final MC % (Ave ± StDev)
14.94
± 0.71
20.41
± 0.45
16.07
Top layer
13.92
0.31
18.23
0.75
Middle layer
16.16
1.05
16.38
0.7
Bottom layer
14.75
0.63
13.59
0.47
MC differential Top-Bottom, %
MC differential Middle-Top , %
0.83
4.64
2.24
AIRFLOW (20 points)
Airflow, m3/s
5.88
Superf. vel. (Ave ±StDev), m/min
11.20
5.70
± 0.30
10.85
Rice husk consumption: kg /batch
171.2
215.2
Rice husk consumption: kg / hr
28.5
35.9
Diesel consumption, liter /h
1.70
1.75
Initial Paddy mass, kg
9276
9197
Initial Paddy Layer (Ave±StDev),
mm
517.8
15.6
507.8
± 0.37
7.5
Crack BEFORE drying, %
12.00
Differ
21.00
Differ
Crack AFTER drying, %
13.75
1.75
23.75
2.75
Crack, Sun drying on Cement yard,
7-cm layer,
%
17.80
5.80
26.80
5.80
Head Rice Recovery, %
Head Rice %, BEFORE drying
62.72
Differ
59.12
Differ
Head Rice %, AFTER drying
59.39
-3.33
56.21
-2.91
Head Rice %, Sun drying
55.58
-7.14
52.12
-7.00
Difference (Sun & Mechanical) . %
-3.81
-4.09
101
BATCH 1
( 43 oC, With air reversal )
BATCH 4 ( 43 oC, Without air reversal)
Meû 1, Ñaû o gioù , 43 oC
MEÛ 4 (saáy 43 oC, KHOÂNG ñaûo gioù)
Döôù i 1
25
Döôù i 2
20
Döôù i 3
15
Döôù i 4
Döôù i 5
10
Treâ n 1
5
Treâ n 2
0
Treâ n 3
0
2
4
Thôø i gian saá y
6
8
10
12
30
AÅ m ñoä MC %(wb)
AÅ m ñoä MC %(wb)
30
Döôùi 1
25
Döôùi 2
20
Döôùi 3
15
Döôùi 4
Döôùi 5
10
Treân 1
5
Treân 2
0
Treâ n 4
Treân 3
0
Treâ n 5
Döôù i 2
20
Döôù i 3
Döôù i 4
15
Döôù i 6
10
Treâ n 1
5
Treâ n 2
Treâ n 3
0
Thôø i gian saá y
3
4
10
12
Treân 4
Treân 5
Drying time, h
5
6
30
AÅ m ñoä MC %(wb)
AÅ m ñoä MC %(wb)
Döôù i 1
25
2
8
Meû 8 (saáy 43 oC, KHOÂNG ñaûo gioù)
30
1
6
BATCH 8 ( 43 oC, Without air reversal)
MEÛ 5 (saá y 43 oC, COÙ ñaû o gioù )
0
4
Thôø i gian saá y
Drying time, h
BATCH 5 ( 43 oC, With air reversal )
2
Döôùi 1
25
Döôùi 2
20
Döôùi 3
15
Döôùi 4
10
Döôùi 5
Treân 1
5
Treân 2
0
Treâ n 4
Treâ n 6
Drying time, h
Treân 3
0
1
2
3
4
Thôø i gian saá y
5
6
7
8
Drying time, h
9
Treân 4
Treân 5
Figure 3: Moisture reduction curves at 43 oC
102
BATCH 3 (48 oC + 43 oC, With air reversal )
BATCH 2
(48 oC + 43 oC, Without air reversal )
MEÛ 3 (saáy 50 oC + 43oC, COÙ ñaûo gioù)
MEÛ 2 (saáy 50oC + 43oC, KHOÂNG ñaûo gioù)
30
Döôùi 1
25
AÅ m ñoä MC %(wb)
AÅ m ñoä MC %(wb)
30
Döôùi 2
20
Döôùi 3
15
Döôùi 4
10
Döôùi 5
Treân 1
5
Treân 2
0
2
4
6
8
Thôø i gian saá y
10
12
14
Döôùi 2
20
Döôùi 3
15
Döôùi 4
10
Döôùi 5
Treân 1
5
Treân 2
0
Treân 3
0
Döôùi 1
25
Treân 3
0
Treân 4
Treân 5
Drying time, h
BATCH 6 (49 oC + 43 oC, With air reversal )
BATCH 7
20
Döôùi 3
15
Döôùi 4
10
Döôùi 5
Treân 1
5
Treân 2
0
Treân 3
Thôø i gian saá y
Drying time, h
5
6
Treân 4
Treân 5
Drying time, h
30
4
Treân 4
Treân 5
AÅ m ñoä MC %(wb)
AÅ m ñoä MC %(wb)
Döôùi 2
3
4
(48 oC + 43 oC, Without air reversal )
Döôùi 1
25
2
3
MEÛ 7 (saáy 50 oC +43 oC, KHOÂNG ñaûo gioù)
30
1
2
Thôø i gian saá y
Meû 6 (saáy 50 oC +43 oC, COÙ ñaûo gioù)
0
1
Döôùi 1
25
Döôùi 2
20
Döôùi 3
15
Döôùi 4
10
Döôùi 5
Treân 1
5
Treân 2
0
Treân 3
0
2
4
Thôø i gian saá y
6
8
10
Drying time, h
12
Treân 4
Treân 5
Figure 4: Moisture reduction curves at 48 oC in the first hour, and 43 oC afterwards.
103
.The SRA-1 dryer fan was tested for the performance (Fig.6)
SRA-1 FAN
40
2.0
Static
Pressure,
mmH2O
30
1.5
Static.Eff , %
25
20
1.0
15
10
0.5
Power, kW
Stat.Pressur, mmH2O ;
Efficiency, %
35
5
0
M ech. Eff, %
Power
kW
0.0
0.8
0.9
1.0
1.1
1.2
3
Airflow, m /s
Figure 6: Fan performance of the SRA-1 dryer
Originally, three factors were planned for study:
− Air reversal at 2 levels: a) YES , and b) NO
− Drying temperature at 2 levels:
a) Constant at 43 oC ; and
o
b) At 50 C for the first hour, and afterwards constant at 43 oC.
− Final moisture content at 2 levels: a) 14.5 % ; and b) 17.0%.
Thus there would be 8 treatments, arranged in blocks, so that the initial moisture contents in
each block are similar.
However, in actual conditions, it was impossible to arrange for the blocks with same moisture
content since the paddy belongs to the owner or the rice miller. Eight experiments would last
at least 4- 8 days, thus even if the same paddy field were booked for the test, the initial MC
would be different. With different input MC, the final MC at 2 levels would not make sense,
at different drying rates.
So we decided to conduct paired experiments, based on the first variable, namely with or
without air reversal. Each pair was combined with a level of the second variable (drying
temperature). Each pair draw from the same lot of paddy input, thus could be assumed as
having the same initial MC.
4.3
Results and discussion (1-to dryer)
The experiment results are summarized in Table 3. Figures 7 and 8 show the moisture
reduction curves.
104
Table 3:
Summary of 8 drying batches
Nong-Lam University
Center for Agr. Energy & Machinery
No
Drying conditions
Date
TESTS: drying paddy with SRA-1 dryer (CARD
Project)
Place : Le- Minh BRVT Rice Mill
8 drying batches
Batch
1
50+43o
C
with
Air
Batch 2
Batch 3
50+43oC
Without
Air
Reversal
43oC
Without
Air
Reversal
Batch
4
43oC
with
Air
Batch 5
Batch 6
43oC
with Air
Reversal
43oC
Without
Air
Reversal
Reversal
Reversal
09-16/ Dec.2006
Pers: : TTT Thuy, NV Quy
Batch
7
50+43
oC
with
Air
Batch 8
Note
50+43oC
Without
Air
Reversal
Reversal
1
Date
10 /12
/06
11 /12 /06
1112/12/06
12 /12
/06
1314/12/06
14/12/06
15/12/06
16/12/06
2
3
4
5
6
7
8
9
10
11
12
13
14
Paddy MC Before drying (%)
Paddy MC After drying (%)
Ave. Final MC, Top layer
Ave. Final MC, Bottom layer
Final MC Differential = Top - Bottom
Layer thickness before drying (m)
Layer thickness after drying (m)
Fresh /Dried before air reversal - Top Layer
Fresh /Dried after drying - Top Layer
Fresh / Dry Ratio before air reversal - Bottom L.
Fresh / Dry Ratio after drying - Bottom Layer
Coal consumption (kg)
Coal consumption (kg / hr)
24.71
13.43
18.84
12.82
0.364
0.321
1.11
1.22
1.36
1.39
22
1.93
0.243
0.230
24.35
12.62
13.9
11.8
2.1
0.248
0.208
1.11
10
2.50
1.26
18
2.25
25.97
12.49
12.8
11.0
1.8
0.405
0.361
1.19
1.29
1.41
1.45
17
1.55
21.83
12.64
13.3
11.1
2.2
0.249
0.220
1.18
27.70
13.53
13.6
11.7
1.9
0.379
0.350
1.10
1.25
1.34
1.36
20
1.74
27.35
13.35
13.6
11.4
2.2
0.261
0.230
1.07
21.10
13.65
12.9
11.2
1.7
0.246
0.219
1.14
1.20
1.23
1.25
9
0.84
1.23
1.38
8
1.23
1.13
1.20
0.00
Table 3 (continued)
105
No
18
19
20
21
22
23
24
25
26
27
28
29
30
Drying conditions
Air SUPERFICIAL Velocity, Ave (m/minute)
Batch
Batch 2
1
50+43 50+43oC
o
Without
C
Air
with
Reversal
Air
Reversa
l
11.46
0.42
Batch 3
43 oC
Without
Air
Reversal
Batch
4
43 oC
with
Air
Reversa
l
Air SUPERFICIAL Velocity,
Std.Dev., m/minute)
Air Flow, m3 / s
0.76
> 0.80
Air flow rate (m3 /s / ton)
> 1.39
1.32
Mass of Paddy Before Drying (kg)
893
572
576
606
Mass of Paddy After Drying(kg)
665
474
420
434
Mass Reduction, Actual (kg)
228
98
155
172
Mass Reduction, from MC calc.(kg)
116
39
77
52
Ratio Reduction: Actual/ MC Calc.
2.0
2.5
2.0
3.3
Drying time (hr)
11.42
4.00
8.00
10.67
Time of Air Reversal, after (hr)
7.00
7.00
Bulk Density WET, kg / m3
613
588
581
616
3
Bulk Density DRIED , kg / m
695
621
692
692
Note
Batch 1 &2 for
Lots of immature,
tune-up
green grains.
Batch 3 & 3: from
same input paddy
Batch 5
Batch 6
43 oC
with Air
Reversal
43 oC
Without
Air
Reversal
Batch
7
50+43
o
C
with
Air
Batch 8
Note
50+43 oC
Without
Air
Reversal
Reversal
> 0.79
> 0.80
> 0.99
> 1.43
803
560
851
586
556
381
620
486
247
179
231
100
132
90
131
62
1.9
2.0
1.8
1.6
11.50
6.50
11.00
7.20
9.00
9.00
530
535
525
588
573
608
590
666
Good grain, little impurities
- Very wet paddy, forced
aeration for 1.5 hr to obtain
desired initial MC
- Lots of immature grains &
impurities
-Batch 5, 6& 7: from same
input paddy
106
BATCH 3 ( 43 oC, Without air reversal)
BATCH 4 ( 43 oC, with Air reversal)
Batch 3 ( 43 oC, Without Air Reversal )
B a tc h 4 (43 o C , with Air R e ve rs a l )
28
28
26
24
T1
26
T2
24
T3
22
22
T4
20
T5
16
14
12
2
3
4
5
6
7
8
9
10
T4
T5
D1
D2
16
D2
D3
14
D4
12
D3
D4
D5
10
10
1
T3
18
D5
0
T2
20
D1
18
T1
0
11 12
1
2
3
4
5
6
7
8
9
10
11
12
Drying tim e , hr
D rying t im e , hr
Batch 6 (43 oC, Without Air Reversal )
Batch 5 (43 oC, with Air Reversal )
Batch 6 (43 o C, Witho ut Air Revers al )
Batch 5 (43 oC, with Air Reversal )
28
28
24
22
20
18
16
14
12
10
T1
26
Moisture content, %
T1
T2
T3
T4
T5
D1
D2
D3
D4
D5
26
T2
24
T3
22
T4
20
T5
18
D1
D2
16
D3
14
D4
12
D5
10
0
1
2
3
4
5
6
7
8
9
10
11 12
Drying time , hr
Figure 7 :
0
1
2
3
4
5
6
7
8
9
10 11 12
Drying time, hr
Moisture reduction curves at 43 oC drying temperature
107
Batch 8 (50 oC + 43 oC, WITHOUT Air Reversal
Batch 7 (50 oC + 43 oC, with Air Reversal )
Batch 8 (50 oC + 43 oC, WITHOUT Air Reversal
Batch 7 (50 oC + 43 oC, with Air Reversal )
28
26
T1
26
T1
24
T2
24
T2
22
T3
20
T4
18
T5
16
D1
14
D2
12
D3
10
D4
0
1
2
3
4
5
6
7
8
9
Drying time, hr
Figure 8 :
10
11
12
D5
Moisture content, %
Moisture content, %
28
22
T3
20
T4
18
T5
16
D1
14
D2
12
D3
D4
10
0
1
2
3
4
5
6
7
8
9
10 11
12
D5
Drying time, hr
Moisture reduction curves. at 50 oC + 43 oC drying temperature
108
The following remarks could be pointed out:
-
The effect of air reversal was very apparent in reducing the final moisture differential
(FMD). Without air reversal this FMD was larger than 2 % point. With air reversal, it
was less than 2 % point; even that the grain quantity dried was much more than the
former case.
-
For this lab dryer, air reversal did not decrease the drying time, because for the same
airflow, with less grain on the floor, the specific airflow rate (per ton) was higher in the
case air was not reversed. .
-
The drying temperature is stable and can be kept within ± 2 oC.
The above remarks do not offer much new findings; yet the tests give specific and handy data
for preparing training materials on rice drying, as part of the Project activities.
The problem of non-uniformity of the input materials for testing is reflected with data on the
bulk density of the input (wet) as well as the output (dried) paddy (Fig..9)
SRA-1, Ba-Ria VT, Dec.2006 (DRIED paddy)
Bulk density, kg /m3
640
620
600
kg/ m3
580
Regression
560
540
520
18
20
22
24
26
Bulk density, kg /m3
SRA-1, Ba-Ria VT, Dec.2006 (Wet paddy)
28
700
650
600
550
500
12.0
12.5
13.0
13.5
14.0
Moisture content, % wb
Moisture content, % wb
(b)
(a)
Figure 9: Bulk density of the wet (a) and dried paddy (b) used in the tests.
The learning experience from the tests have been: A balanced set of experimental data for
drying treatments of even 1 ton each is difficult to obtain under actual field conditions.
Perhaps, a quantity of around 20 kg each is more appropriate. Even so, cold storage room is
needed for conditioning the grain for one-week-long testing. Miscellaneous equipment such
as cleaner is also needed. All these rigorous procedures would give pure academic results,
which in fact do not reflect the realities, as the graph on the bulk density showed.
Thus in the future, an alternative ---that several drying researchers followed--- would be
modeling of the drying process. This hopefully can cope with diversities in material
conditions as well as ambient conditions.
Another constraint was the laboratory milling equipment for milling analysis (for head rice
recovery) could not be standardized for proper operation at the time.
Page 109
5
THE PRRA SURVEY ON THE USE OF FLAT-BED DRYER
AND THE COST OF VARIOUS DRYING METHODS IN THE MEKONG
DELTA.
By the terms of the contract, two other activities were conducted: The survey using the
Participatory Rapid Rural Appraisal (PRRA) method on the use of flat-bed dryer in the
Mekong Delta and the cost of drying; and the writing of extension materials for future
training courses, based on the outcome of the survey and experiments.
5.1
Background
The flat-bed dryer has been with the rice agriculture in the Mekong Delta of Viet Nam since
early 1980’s. Its development over the past 25 years and its current status need to be
examined in the context of the CARD Project 026/VIE-05 with focus on the cracking of
paddy grains in the area. Thus a survey using the PRRA method on the use of flat-bed dryer
in selected Provinces of the Mekong Delta was conducted.
5.2
Objectives
-
To confirm the role of flat-bed dryers in reducing post-harvest losses and in preserving
rice quality.
-
To identify operating factors of the flat-bed dryer which contribute to the reduction of
rice crack.
-
To identify problems with the flat-bed dryer that the CARD Project could possibly help.
5.3
Method
The survey used the PRRA method, through interviewing different people class, from farmers
to rice millers to governmental officials… But it also relied heavily on both available data
gathered in the past 10 years by various agencies, and on personal experience of the people
involved with the dryer at NLU over the past 20 years.
Four Provinces were selected, namely Can-Tho City, Kien-Giang, Long-An, and Tien-Giang.
The first three Provinces have sites which had been selected by the CARD Project for all
related experiments, demonstrations, and extension activities. The fourth Province is
adjacent to Long-An, and also planned as site for rice milling survey, so facts and data on the
dryer would be relevant.
Note: Can-Tho = Can-Tho City, which used to be part of Can-Tho Province, and is about half
of the latter in terms of rice land.
5.4
Result and discussion
5.4.1
Background data
The 4 Provinces under study have similar data in terms of climate and other agricultural
features. All have the average monthly temperature of 27- 28 oC, with the average maximum
of 29 oC in April and minimum of 25 oC in January. But the temperature difference between
daytime and night time is more pronounced, say between 25 and 36 oC in hot months, or 23
and 33 oC in cooler months.
Page 110
The rainy season in the region occurs from May to October, the remaining months are dry
season (no Spring, Summer …Winter like in Northern Provinces). The annual rainfall is
1 400 mm in Long-An, and higher in Can-Tho and Kien-Giang (1 600 and 1800 mm
respectively).
The average annual relative humidity is 80- 82 %. This just says that is typical tropical
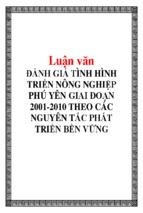
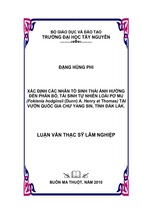
humid climate, and not specific enough about its significance in post-harvest. Figure 10
presents average variation of a typical day of March (dry season) and of August (rainy
season) in Can-Tho, which is very similar to that of other places in the Mekong Delta.
Whether in rainy or dry season, the relative humidity during the night time (21h00 PM to
7h00 AM) is very high, over 90%. This is totally different with Australia, where the RH is
below 70 % even in night time. The implication is the moisture re-absorption of the grain
during storage.
100
90
80
70
60
50
40
30
20
10
0
42
40
38
36
34
32
30
28
26
24
22
0
3
6
9
12
15
18
21
Rel.Humidity, %
Temperature, oC
Temperature and Rel.Humidity, CAN-THO (average 1988- 1992)
24
Tim e of the day (12= noon ; 24 = m idnight)
oC-March
oC-August
%RH-March
%RH-August
Figure 10. Weather data of a typical day in March and August,
at Can-Tho Province (average 1988- 1992)
Specific data pertaining to each Province are shown in Table 4.
Table 4: Selected data of the 4 Provinces under survey
Population (2005),
million
Can-Tho
Kien-Giang
Long-An
Tien-Giang
1.14
1.65
1.41
1.70
of which % in agriculture/ rural area
Rice Yearly PLANTED area, ha
Rice production,.
million ton
50
85
596 000
430 000
252 000
1.23
2.90
1.93
1.31
47
≈350
% of wet-season paddy dried by machines
83
231 000
of which % harvested in rainy months
Number of flat-bed dryers
76
≈15
(10- 20)
48
1100
35
580
24
#
60
300
22
##
12
Source: General Statistics Office, Ha-Noi, Viet Nam, http://www.gso.gov.vn/ (2005)
Danida ASPS Report (2004)
# Mr. Con, Office of Long An Rural Development (2006) .
Page 111
- Xem thêm -