Unit 16
BÀI GIẢNG TIẾNG ANH LỚP 10
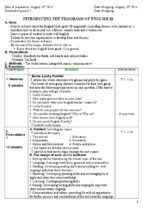
Historical places
D. Writing
Types of charts
pie chart
line chart
bar chart
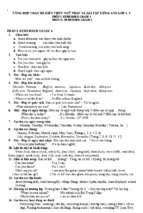
VISITOR ARRIVALS IN VIETNAM
(From the USA, France and Australia)
230,470
99,700
84,085
259,967
111,546
96,624
(Source: Vietnam National Administration, 2002)
VISITOR ARRIVALS IN VIETNAM
(From the USA, France and Australia)
259,967
230,470
99,700
84,085
111,546
96,624
(Source: Vietnam National Administration, 2002)
1. According
to the chart,
the USA had
the biggest
number of
visitors to
Vietnam in
2001.
VISITOR ARRIVALS IN VIETNAM
(From the USA, France and Australia)
259,967
230,470
99,700
84,085
111,546
96,624
(Source: Vietnam National Administration, 2002)
2. 99,700
French
visitors
arrived in
Vietnam in
2001.
VISITOR ARRIVALS IN VIETNAM
(From the USA, France and Australia)
259,967
230,470
99,700
84,085
111,546
96,624
(Source: Vietnam National Administration, 2002)
3. Australia
had the
smallest
number of
visitors to
Vietnam in
2002.
VISITOR ARRIVALS IN VIETNAM
(From the USA, France and Australia)
259,967
230,470
99,700
84,085
111,546
96,624
(Source: Vietnam National Administration, 2002)
4. No, it isn’t.
VISITOR ARRIVALS IN VIETNAM
(From the USA, France and Australia)
259,967
230,470
99,700
84,085
111,546
96,624
(Source: Vietnam National Administration, 2002)
5. France had
more visitors
to Vietnam in
2002.
The description of a chart consists of:
1. Opening
2. Body
3. Conclusion
1. Opening
1.1 What does the chart
describe?
The chart shows/presents/
displays/describes…
The chart is about…
The chart deals with…
Eg: The chart presents
the population of Vietnam
from 2007 to 2012.
1. Opening
(Source: Vietnam National
Administration of Tourism)
1.2 Where is the
source of the chart
from?
The source of the
chart is from/provided
by…
Eg: The source of the
chart is from Vietnam
National Administration
of Tourism.
1. Opening
1.3 What is the main change
showed the chart?
In general,/Generally,/Overall,…
It can be seen from the chart
that…
It is clear from the chart
that…
Eg: In general, the population
of Vietnam increased steadily
from 2007 to 2012.
1. Opening – adverbs to describe the speed of
change
rapidly/quickly/swiftly
(nhanh chóng)
suddenly (đột ngột)
Eg: The pollution rate
increased rapidly from
2009 to 2012.
1. Opening – adverbs to describe the speed of
change
steadily/gradually (từ
từ, ổn định)
slowly (chậm)
Eg: The unemployment
rate decreased
gradually from 2009
to 2012.
2. Body – structures to describe the increase
S + increase/rise/go up/climb/inflate by|to
+ number/percent
Eg: The population of Vietnam rose to 2% in
2012.
S + increase/rise/go up/climb/inflate from +
number/percent + to + number/percent
Eg: The number of endangered species
inflated from 1900 to 2100.
2. Body – structures to describe the decrease
S + decrease/fall/drop/reduce/decline by|to
+ number/percent.
Eg: The unemployment rate fell by 5% in
2010.
S + decrease/fall/drop/reduce/decline from
+ number/percent + to + number/percent.
Eg: The price of gold dropped from five
million dongs to four million dongs.
2. Body – adverbs to describe the amount of increase
or decrease
dramatically/sharply/hugely/
enormously/steeply/markedly/
substantially/considerably/
significantly (nhiều, đáng kể)
Eg: The number of students
increased substantially from
300 in 2001 to 3900 in 2003.
Or In 2003, the number of
students rose hugely by 3000 in
comparison with that in 2002.
2. Body – adverbs to describe the amount of
increase or decrease
moderately/slightly/minimally
(nhẹ, vừa phải)
Eg: The number of teachers
fell slightly from 1015 in 2002
to 1013 in 2003.
Or In 2003, the number of
teachers declined moderately
by 2 in comparison with that in
2002.
2. Body – comparative structure (cấu trúc so
sánh)
A + be + (number/percent) +
higher/lower than that of B
Eg: The population of Hanoi
is (3.000.000) higher than
that of Haiphong.
Or The population of
Haiphong is (3.000.000)
lower than that of Hanoi.
3. Conclusion
What can be concluded
from the chart?
In conclusion,…
In summary,…
To sum up,…
Eg: In conclusion, the
population of Vietnam
rose gradually from 2007
to 2012.
- Xem thêm -