Agrofood market study 2014
AGROFOOD
RESEARCH REPORT
This project is funded
by the European Union
Useful contacts
EU-Vietnam Business Network (EVBN)
More information
15th Floor, 5B Ton Duc Thang, District 1
Ho Chi Minh City, Vietnam
T : +84 (0) 8 38 23 95 15 (Ext:105)
Useful contacts
www.evbn.org
Further reading:
Vietnam Ministry of Planning and Investment:
www.mpi.gov.vn
United Nations Population Fund Vietnam (UNFPA-VN):
www.vietnam.unfpa.org
Ministry of Industry and Trade Viet Nam:
www.moit.gov.vn
United Nations Conference on Trade and Development (UNCTAD):
www.unctad.org
International Trade Center (ITC):
www.intracen.org
Trade Map - Trade statistics for international business development:
www.trademap.org
Saigon Times Weekly:
www.thesaigontimes.vn
Vietnam News:
www.vietnamnews.vn
General Statistics Office of Vietnam:
www.gso.gov.vn
Trading Economics:
www.tradingeconomics.com/vietnam/
VGP News. Online Newspaper of the Government, Vietnam:
www.news.chinhphu.vn
Vietnam Briefing:
www.vietnam-briefing.com
Vietnam Customs Statistics:
www.customs.gov.vn
Vietnam Trade Promotion Agency (Vietrade):
www.vietradeportal.vn
VietnamPlus, Vietnam News Agency (VNA):
www.en.vietnamplus.vn
World Bank Vietnam:
www.worldbank.org/en/country/vietnam
Investment promotion Portal for South Vietnam
www.ipcs.vn/en/
Ministry of Justice of Vietnam
www.moj.gov.vn/
National Institute for Food Control (NIFC)
http://nifc.gov.vn/
The Landmark, 15th floor, 5B Ton Duc Thang St., District 1, Ho Chi Minh City, Vietnam
This publication has been produced with the assistance of the European Union.
Tel. +84 (0)8 3823 9515
The content of this publication are the sole responsibility of EVBN and can in no way be
www.evbn.org
Fax +84 (0)8 3823 9514
taken to reflect the views of the European Union
TABLE OF CONTENT
1.
IMPORTS MARKET / DOMESTIC CONSUMPTION
1.1. Bakery & Confectionery
5
8
1.2. Beverage
14
1.3. Seafood
19
1.4. Dairy
21
1.5. Noodles
26
1.6. Ingredients
28
2.
29
EXPORTS MARKET/ DOMESTIC PRODUCTION
2.1. Seafood
30
2.2. Rice
32
2.3. Coffee
33
3.
KEY GROWTH DRIVERS
34
4.
COMPETITOR ANALYSIS AND DISTRIBUTION CHANNELS
36
4.1. Competitor Analysis
36
4.2. Key foreign players in the market
41
4.3. Distribution Channels
43
5.
CHALLENGES AND OPPORTUNITIES FOR EU SMES
47
6.
REGULATORY AND LEGAL FRAMEWORK
49
APPENDIX. FAIRS AND EXHIBITIONS
52
3
EVBN SECTOR STUDY
INTRODUCTION
Domestic consumption in Vietnam is growing slowly and Vietnamese consumers are still cautious
in spending as the economy has yet to recover from its trough in 2008 as a result of worldwide
economic downturn. However, the emergence of retail systems together with changing
consumption habits shows a promising market for the retail industry in general and Agrofood in
particular.
In 2013, Vietnam’s Agro-food market was worth over USD 60.1 billion, accounting for 40.5% of
the total consumption of the country. In the same year, Vietnam’s F&B consumption was USD42.8
billion, representing an increase of 8.2% against 2012 and a compound annual growth rate of
11% during the period of 2010-2013. Domestic consumption in the country reached 42.8 billion,
accounting for 71.2% of the total industry production value, and the remaining 29% contributes to
exports (seafood, rice, coffee, cashew nuts…).
Source: VPBS research
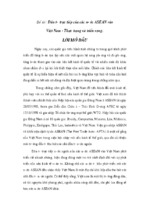
Imports of agro-food have been an additional source, besides the local production, to supply the
expanding domestic consumption. These imports, however, were always exceeded by exports
since 1997, resulting in Vietnam’s trade surplus, which has increased at a faster pace over the
years (Shown in the chart below). Details of imports and exports market will be in the following
sections.
Figure 6. Evolution of the agro-food trade in Vietnam
Source: UN Comtrade, 2010
4
EVBN SECTOR STUDY
01
IMPORTS MARKET / DOMESTIC
CONSUMPTION
Vietnam has a high domestic food consumption, with a double-digit growth. In 2013, food
consumption was USD34.8 billion, posting a remarkable CAGR of 11.4% over the period of 2010
to 2013. Despite recent slow growth in FMCG purchases, the combination effects of continuous
economic growth, golden demographic structure, rapid urbanization, emergence of middle income
earners and a mass grocery retail network, will fuel the growth of overall food consumption in the
medium- and long-term. Also, due to its nature as a defensive sector that is essential for living,
food is considered a key component of a balanced investment portfolio over investment horizon.
Vietnam food consumption is projected to retain its double-digit growth of 11.4% over the period of
2014 to 2018, according to Euromonitor International.
In 2013, agro-products, meats & eggs and seafood continued to be the three biggest categories
with USD26.7 billion or 76.8% value contribution to total local food consumption. Agri-products,
including rice, maize, coffee, tea, pepper, cashew, sugarcane, cassava, fruits and vegetables,
posted double-digit growth of 11.8% since 2012, the highest market value of all categories.
This $11.9 billion market couldn’t be fulfilled if without foreign imports. In 2008, Vietnam imported
$7.3 billion worth of agricultural food. Vietnam's primary agricultural import suppliers include
China, Australia, Thailand, New Zealand, ASEAN countries, Argentina, the European Union (EU)
and the US.
5
EVBN SECTOR STUDY
The key staples of the Vietnamese diet (fish and rice) are produced in abundance domestically
and have naturally limited agricultural imports in the past. However, the makeup of agricultural
imports is changing as more affluent urban consumers seek more variety and convenience
options. In turn, the processing sector is looking to imports to supply this rapidly expanding
industry.
Vietnam's top five agricultural imports in 2008 along with their corresponding supplier in brackets
were:
Residues and waste from the food industries (used as animal feed) $1,329 million (India)
Meat and edible meat offal $900 million (India and US)
Animal or vegetable fats and oils $647 million, (Malaysia and Indonesia)
Beverages, spirits and vinegar $507 million (Singapore and Hong Kong)
Cereals $443 million (Australia)
6
EVBN SECTOR STUDY
Major food categories imported the most by Vietnamese market were raw feed, dairy materials,
seafood, oil and fats, wheat, and fruits and vegetables, with respective market shares listed in the
below table. Among these, three categories (raw feed, wheat, fruits and vegetables) are agri-food.
Key imports categories in 2013
Key imports categories in 2013 (US 6.5 bn)
Category
Contribution
Raw feed
46.4%
Dairy materials
16.8%
Seafood
10.7%
Oil and fats
10.7%
Wheat
9.4%
Fruits and vegetables
6.2%
Source: GSO Viet Nam
Key findings on each import category will be elaborated in more details in the following sections.
7
EVBN SECTOR STUDY
1.1
Bakery & Confectionery
According to the Center for Information Industry and Commerce - Ministry of Industry and Trade
(VITIC) showed that Vietnam imported 107.1 million confectionery and cereal products, down
42,28% compared to import value over the same period last year.
In particular, products from Indonesia and Thailand accounted for over 50% of the import value.
Specifically, items of confectionery and cereals imported from Indonesia accounted for 30.3%,
equivalent to 32.4 million, up 23% from the same period last year. Followed is Thailand with 22.8
million in import value, accounting for 21.37% and increasing by 26.99% compared to the
previous year.
Besides, Vietnam also imported large amounts of candies, $12.5 million, from Malaysia. At the
same time, Vietnam also imported candies from other markets such as the Philippines (10.7
million), China (5.7 million), and South Korea ($ 4.3 million). These numbers have slightly
increased compared to the same period last year.
Meanwhile, the value of imports from the United States, Singapore, and the Netherlands have
declined dramatically from 80% to 96%, reaching just over $ 5 million in all 3 markets.
Bakery. Market size and growth rates
Growth in the expansion of modern style bakery outlets
The bakery market enjoyed a CAGR of 7.6% over the period of 2010 to 2013, reaching VND10.4
trillion (USD0.5 billion) by the end of 2013. This was due in part to a new style of bakery outlet
expanding quickly across Vietnam since 2010 and becoming more and more popular as a place
for people to gather, similar to coffee shops. Kido’s Bakery, Onoré Bakery, Tous Le Jour, Paris
Baguette, Bread Talk and Brodard Bakery are some examples of this new style of bakery in
Vietnam.
8
EVBN SECTOR STUDY
Bread retained the biggest sales among other bakery products
As one of the popular alternatives to rice and noodles, bread retained its status as a primary
consumption bakery product compared to other sub-categories (such as cakes and pastries) with
VND8 trillion (USD378.7 million) sales in 2013, equivalent to 76.8% of total bakery market
revenue.
Unpackaged baked goods growing presence
Thanks to the rising number of bakery outlets, sales value of unpackaged or artisanal products
has grown gradually, reaching VND4.1 trillion (USD195.2 million) and accounting for 39.6% of
total bakery sales. In 2013, packaged baked goods sales wereVND6.3 trillion (USD297 million).
However, there is a low probability that unpackaged products will have a strong impact on the
revenue of packaged goods, as each category serves different benefits. While packaged baked
goods offers great convenience for busier lifestyles, consumers can enjoy more delicious taste of
unpackaged or artisanal products served in the modern bakery outlets.
9
EVBN SECTOR STUDY
Bakery. Trends.
Sugar price climbing downward, wheat price bouncing back
Sugar and wheat flour significantly account for about 35 to 40% of material costs of confectionery
and bakery production. Thus, any change in world production could cause price volatility and
shortages which in turn negatively affect local production. In 2013, the favorable trend of world
sugar and wheat price strongly supported the gross margin of local players. 2013 was a third
consecutive year world sugar prices dropped due to production exceeding consumption demand.
The USDA forecasts sugar production will reach 175 million MT worldwide and the oversupply
situation will continue in 2014, a prospect for a fourth year of price descent. Relative to the
beginning of 2013, Sao Paolo refined sugar’s spot price decreased by 16.9% to USD640 per MT
as of May 20, 2014.
Vietnam was not an exception; its refined sugar wholesale price was down by 18.7% y-o-y to
VND13,000 per kg in the third week of May 2014. In contrast to sugar, wheat prices depended on
the weather conditions in main areas of world wheat production, such as North America and
Canada, Brazil, Australia and were affected by political turmoil in the Ukraine. Wheat prices were
USD334 per MT as of May 20, 2014, which was an increase of 15.2% compared to the beginning
of the year. In 2014, the confectionery business may not have a gross profit margin as high as in
2013, but we expect it will not be too low as long as sugar’s price downtrend persists.
10
EVBN SECTOR STUDY
Confectionery. Market size & growth rate
Despite slower growth, Vietnam’s confectionery market still outpaced its regional peers
In 2013, Vietnam’s confectionery market grew at a slower pace, given its nature of being a
discretionary item in the context of slowing purchasing power. In 2013, the category sales were
VND16.6 trillion (USD0.79 billion), a rise of 9.4% from the 2012 sales. Despite this, Vietnam’s
confectionery market still remains attractive in the SEA region as it substantially outperforms the
average growth of 3% in the region and that of 1.5% in the world.
The category is appealing in the long run thanks to the increasing awareness of Western culture
and lifestyle among Vietnamese consumers and the much lower confectionery consumption per
capita of 1.8kg per annum relative to the global average of 2.8kg. Euromonitor International
expects the slow growth of the confectionery market to continue in 2014 and 2015, however, the
CAGR for the period of 2013 to 2017 is projected to hover between 10% and 11%.
11
EVBN SECTOR STUDY
Biscuits, cookies, and crackers
Savory biscuits / crackers and plain biscuits as the most consumed thanks to less sugar and more
vitamin content
Accounting for 42% of the confectionery
market value, biscuits, cookies and
crackers
recorded
VND6.9
trillion
(USD0.33 billion) sales in 2013, posting a
CAGR of 9.2% during 2010 to 2013. Since
savory and plain biscuits and crackers
contained less sugar and more vitamins,
these two segments are considered
healthier products among other subcategories. They remained the most
consumed with reported sales of VND5.3
trillion (USD0.25 billion) or 76% of total
category value in 2013.
Savory snacks
Demand remaining strong despite increase in unit price
With a 33% share contributed to the
confectionery market value, savory snacks
reported VND5.5 trillion (USD0.26 billion)
sales in 2013, recording a higher CAGR of
9.5% during 2010 to 2013 than biscuits,
cookies and crackers. Despite increases
of unit price over the period, the sales
posted a higher and flat growth rate,
suggesting that the demand for savory
snacks will remain strong. Extruded
snacks and nuts accounted for 58% of the
sub-category sales, equivalent to VND3.3
trillion (USD156.2 million) in 2013.
12
EVBN SECTOR STUDY
Sugar confectionery
Sugar confectioneries facing intense competition from savory snacks
Revenue growth of the sugar confectionery segment was 9.5% in 2013, which was much slower
than the levels recorded in 2011. This was attributed to rising consumer awareness of health
issues related to the level of sugar intake, such as high blood pressure, obesity and diabetes.
Thus, it led sugar confectioneries to confront strong competition from savory snacks which are
considered to have lower sugar content. Pastilles, gums, jellies and chews continue to be the
most popular sugar confectionery category in Vietnam, accounting for 58% of the value or
VND1.6 trillion (USD75.7 million).
13
EVBN SECTOR STUDY
1.2
Beverage
Market size & growth rates
In the beverage market, alcoholic drinks are the largest sector with 70% contribution to the total
market value. Revenue from this sector increased by 6.3% to USD 5.6 bil, the lowest growth rate
compared to other drinks. Beer accounts for the largest share of alcohol consumption: Sabeco
and Habeco are domestic companies that dominate Vietnam beer market.
Soft drinks saw the highest growth of 12.4% and reached $ 1.7bn sales in 2013, while hot drinks
were the smallest segment carries about 0.7 billion in sales. In the soft drinks market, Coca-Cola
and PepsiCo dominate the carbonated soft drinks market, whereas Tan Hiep Phat array occupies
none-gas soft drinks. Hot drinks are the smallest segment which brought only USD 0.7 billion in
revenue. Hot drinks market is currently under the control of Nestle and VinaCafe.
In 2013, retail sales of the beverage sector in Vietnam reached USD8 billion, a 7.6% rise
compared with the 2012 number. According to forecasts of the key players, in the period 2014 and
2015, beverage market value is expected to increase by 7.5%. So as consumers switch to
beverage products with higher value, expected profits in this sector would increase by 10.5% in
2016.
14
EVBN SECTOR STUDY
Alcoholic drinks (Wine, spirits and beer)
As increasing Vietnamese’s exposure to drinking cultures around the world couples with their
popular perception of drinking to socialize, Vietnam alcoholic drinks consumption continues
growing year over year and has gained the biggest retail sales among other beverage categories.
Further, rising numbers of tourists and expatriates living in big cities also incentivize alcoholserving retailers to expand, which in turn stimulates local consumption as rising adoption of
western lifestyle becomes more prevalent.
In 2013, Vietnamese people drank a remarkable 3.15 billion liters of alcohol, equivalent to
VND119.5 trillion (USD5.6 billion), representing a double-digit CAGR of 10.1% and 10.6% during
2010 to 2013. Despite their slowing growth since 2012 due to reaching maturity, alcoholic drinks
remain one of the potentially lucrative markets in Vietnam. It is expected to reach USD6.3 billion
in 2015 by Euromonitor International.
15
EVBN SECTOR STUDY
Beer
Alcoholic beverage consumption is largely driven by the beer category which accounted for 98%
of production volume and 91% of sales value in 2013. Spirits and wine accounted for only 2.3%
volume share (74 million liters) and 8.8% value share (VND10.4 trillion or USD492 million). In
2013, beer consumption recorded more than 3 billion liters, equivalent to VND109.1 trillion
(USD5.2 billion).
Vietnam ranked fourth for beer consumption per capita in Asia
While Vietnam was leading in the SEA region with 29 liters of beer consumption per capita in
2012, the country captured the 4th position for the entire Asia region, only after Japan (64 liters),
South Korea (45 liters) and China (37 liters). According to Vietnam Breweries Associations (VBA),
beer consumption per capita rose approximately 10% up to 32 liters in 2013. As such, Vietnam is
considered one of the beer loving countries and is among the most attractive destinations for
international breweries.
16
EVBN SECTOR STUDY
The Vietnam beer market had a CAGR of over 10% in volume and value during the period from
2010 to2013. However, as the market becomes saturated, growth cannot be as fast as it was prior
to 2011. Beer is forecasted to grow at a slower pace with an average 5.3% per annum and the
sales will be USD5.7 billion by 2015.
Lager dominating other types of beer
Lager is the main type of beer in Vietnam since Vietnamese consumers are already familiar with
the taste of lager and are reticent to try new tastes. Thus, other types of beer such as dark beer,
stout and low-alcohols have only a limited presence in the market. Standard lager holds the
biggest share of 67% of total lager, thanks to its price affordable for Vietnamese consumers who
still lived with low disposal-income per capita. Also, there was a large gap of at least 43% higher
in unit price range of each segment including premium, standard and economy.
Wine and spirits
In 2010, approximately 50 percent of imports of wine and spirits came from France, 14 percent
from Australia, 6 percent from the USA, 5 percent from Chile, 4 percent from Italy, and 2
percent from Spain.
Cabernet was the premier red variety of grape-based wine consumed, with 1.2 million liters
consumed in 2009, a 33 percent increase from 2006. Chardonnay was the leading variety
among the white wines, with consumption rising from 0.7 million liters in 2006 to 0.9 million
liters in 2009—a 29 percent increase.
Demand for wine is seasonal. The highest demand occurs around the year-end festive season;
during the Tet festival (Lunar New Year) around February every year, Christmas holiday, and
New Year celebration. Some retailers state that between 60 and 70 percent of the wine sales
occur during this period. Demand was generally low during other periods of the year.
17
EVBN SECTOR STUDY
Imported wine is perceived as a luxury product in Vietnam (accounted for 73%), and demand for it
largely comes from expatriates and tourists. Only a small number of Vietnamese from the middle
to high income groups drink imported wines. This is because these groups of consumers
generally prefer spirits such as vodka, cognac, brandy and whiskey to wine. However,
Vietnamese that have acquired a taste for wine generally prefer old world wines, particularly red
wines. The most popular wine in Vietnam is Bordeaux, which is synonymous with wine.
Vietnamese consumers who have acquired a taste for wines consume imported wine while they
are out socializing/entertaining or dining during the week. In line with growth in incomes, rising
affluence in urban centers, the larger expatriate business community and emerging tourist cities,
demand for wine is expected to increase over the next five years. This trend reflects the prestige
associated with drinking wine compared with beer and spirits, in addition to the perception that
wine is healthier.
The presence of more and more highly-regarded brands of wine from Old World countries like
France and Italy as well as from New World ones, like Chile, Australia, United States of America,
South Africa, Argentina and New Zealand has demonstrated how much wine producers are
interested in this promising market.
18
EVBN SECTOR STUDY
1.3
Seafood
Market size & growth rates
Vietnam possesses an interlacing system of rivers and a 3,260 km long coastline. It is ranked
third in 2013 among the largest countries for fishery and aquaculture activities, preceded only by
China and India. Fishery volume (mainly from tuna) has recently grown every year thanks to
favorable weather conditions and a new fishing technique of using high pressure lamps, which
helps double productivity and saves 15 to 30% of the fishing time. The decline in growth of
production value during 2012 and 2013 was due to approximately 100,000 hectares of shrimp
farms, which account for 15% of the country’s total shrimp farms, suffering from the Early
Mortality Syndrome (EMS). The disease, however, has been controlled since Q4 2013 and is no
longer a threat. In 2013, seafood production rose 3.4% to reach 6 million tons in volume and grew
7% to reach USD11.4 billion in value.
19
EVBN SECTOR STUDY
Domestic seafood consumption reaching USD5.3 billion in 2013
The domestic market made a minor contribution of less than 5% share to the revenue of local
seafood producers. This was attributable to lower selling prices relative to export prices, while
cost of production, logistics and promotion advertising were still high. Further, Vietnamese
consumers are acquainted with purchasing fresh seafood from traditional wet markets while the
local producers concentrate on frozen, processed seafood. In 2013, domestic consumption of
seafood reached USD5.3 billion, accounting for 43.9% of total local production and import value,
which was USD12.1 billion. According to the Center of Planning and Development of Aquatic
Products, domestic consumption will increase annually at an average rate of 5.4% from 2011 to
2020.
20
EVBN SECTOR STUDY
- Xem thêm -