See discussions, stats, and author profiles for this publication at: https://www.researchgate.net/publication/263942286
Structural Behaviors of Waxy Crude Oil Emulsion
Gels
Article in Energy & Fuels · May 2014
DOI: 10.1021/ef500534r
CITATIONS
READS
7
35
3 authors:
Guangyu Sun
Jinjun Zhang
China University of Petroleum
China University of Petroleum
8 PUBLICATIONS 9 CITATIONS
94 PUBLICATIONS 550 CITATIONS
SEE PROFILE
SEE PROFILE
Hongying Li
China University of Petroleum
9 PUBLICATIONS 131 CITATIONS
SEE PROFILE
Some of the authors of this publication are also working on these related projects:
Interfacial rheology View project
Available from: Guangyu Sun
Retrieved on: 25 September 2016
Article
pubs.acs.org/EF
Structural Behaviors of Waxy Crude Oil Emulsion Gels
Guangyu Sun, Jinjun Zhang,* and Hongying Li
National Engineering Laboratory for Pipeline Safety/Beijing Key Laboratory of Urban Oil & Gas Distribution Technology, China
University of Petroleum (Beijing), Beijing 102249, China
ABSTRACT: At low ambient temperatures in offshore environments, the water-in-oil emulsions of waxy crude oil develop a
combined structure of wax crystals and water droplets, resulting in gelling and other complicated flow problems which may
severely challenge flow assurance of the multiphase production and transportation system. In this study, the viscoelastic and yield
behaviors of waxy crude emulsion gels were investigated, and analyses were then made by investigating the roles of wax particles
and water droplets. Small amplitude oscillatory measurements were first carried out to study the effects of dispersed water on the
structure and its evolution with time elapsing. Then, creep and recovery tests were conducted within the linear viscoelastic region
to further investigate the viscoelastic behaviors of the emulsion gels. Further, the influence of dispersed water on the yield
behaviors was studied by stress sweep measurements, and the effects of temperature, i.e., the precipitated wax, on the yield stress
and yield strain were investigated by shear-rate-controlled loading measurements. The emulsion was found to become more
elastic with the increase of the water cut, exhibiting phenomena such as the loss angle decreasing, storage modulus growing-up,
the emulsion gelling at higher temperature, and strain recoverability increasing. The creep and recovery behavior may well be
described by a mechanical analogy model with one Maxwell model and two Kelvin−Voigt models associated in series. Compared
to the brittle structure of the gelled waxy crude oil as was reported in previous studies, the emulsion gels become more ductile
with the increase of the water cut. The yield stresses of both the crude oil and the emulsion gels increase monotonically with the
increase of the precipitated wax, and the yield strain of the emulsions with few precipitated wax particles increases with decreasing
temperature, which is contrary to the waxy crude oil and the emulsions with low water cut, and interestingly the yield strain of
emulsions may show both of these opposite trends, first increasing and then decreasing with the continuous decrease of
temperature. All structural behavior differences between the emulsions and the waxy crude oil may be attributed to the roles that
the dispersed water droplets may play and the interactions of the wax particles and the water droplets.
1. INTRODUCTION
In petroleum production, the formation of crude oil emulsions,
which is mainly caused by flow turbulence and high shear
encountered at the production facilities, is quite common and
may cause significant flow assurance problems. These crude oil
emulsions can be very stable with polar components such as
resins and asphaltenes serving as the natural surfactants.1−3
For a waxy crude oil at low ambient temperature in subsea
environments, the paraffinic wax in the crude oil precipitates
out due to its decreased solubility and forms a threedimensional spongy-like network, leading to the gelation of
the crude oil and the emergence of structural rheological
behaviors such as viscoelasticity and yielding.4−8 Particularly,
for waxy crude oil emulsions the interfaces of dispersed droplets
provide bonding sites for the paraffin crystalline particles,8,9
making the emulsions easier to gel and thus bringing more
severe flow assurance problems to the subsea production and
transportation systems. Therefore, the rheological behaviors of
waxy crude oil emulsion gels are of great importance to the
petroleum industry.
However, so far most of the rheological studies on waxy
crude oil emulsions are focused on the flow properties of liquid
state emulsions, such as the emulsion viscosity as a function of
the dispersed water fraction,10−12 and little attention has been
paid to the viscoelastic and yield behaviors of gelled crude oil
emulsions, except for the work of Visintin et al.8 Using small
amplitude oscillatory measurements, Visintin et al.8 demonstrated that the pour point, which was defined as the
© 2014 American Chemical Society
temperature at which the storage and loss modulus crossed
by these authors, rose obviously with the increase of the
dispersed water when the water cut exceeded 35%, and at
temperatures below the pour point the storage and loss moduli
of emulsion gels were found to grow with time in isothermal
conditions. And after the structure of emulsion gels reached
equilibrium, for the emulsion gels with a water cut above 35%, a
power law relation existed between the storage modulus and
the volume fraction of water. They attributed these rheological
behaviors to the strong absorption of wax particles at the
interface and the resultant entrapment of water droplets,
rendering the entire volume spanned by a wax crystal network
eventually.
At present, studies on the creep and recovery of waxy crude
oil emulsion gels have not been presented in the literature.
Similar studies were mainly reported in the field of food
emulsion gels.13−17 More recently, Haj-shafiei et al. 18
investigated the creep and recovery of model oil emulsion
gels. Their study showed that the emulsions with high water cut
deformed less and recovered more due to the inherent
recoverable nature of water droplets under stress, and
conversely the emulsions with low water cut recovered less
since the wax crystal network dominating the emulsions at low
water cut was more brittle and irreversibly yielded.
Received: March 7, 2014
Revised: May 19, 2014
Published: May 20, 2014
3718
dx.doi.org/10.1021/ef500534r | Energy Fuels 2014, 28, 3718−3729
Energy & Fuels
Article
Diverse results have been reported when the yield characteristics of waxy crude oil emulsions are referred to. Some research
reported that the yield stress of waxy crude oil emulsion gels
increased monotonically with the increase of dispersed
water,8,19 whereas others indicated that the yield stress did
not monotonically increase with increasing water cut when the
fraction of precipitated wax crystals was low,6,20 and instead a
water cut existed at which the structural strength of the
emulsion gels was at its maximum. Moreover, Paso et al.6 found
that the yield strain increased from about 1.5% in the absence
of emulsified water to nearly 20% at the water cut of 70%,
indicating that significant deformation of water droplets
occurred before the maximum yield stress was attained.
From the above reviews, it can be seen that there has been a
lack of study on the structural behaviors of waxy crude oil
emulsion gels. First, little is known about the creep and
recovery behavior. Second, in the studies of the yield behaviors
most attention has been paid to the evolution of the yield stress
with water content, while little attention has been given to the
yield strain, which is also a representation of the structural
characteristics. Third, there is a lack of comprehensive
comparison between the structural properties of emulsion
gels and those of the gelled waxy crude oil without emulsified
water.
The objective of this study is to understand the structural
characteristics and their mechanisms of waxy crude oil emulsion
gels both by exploring their viscoelasticity and yield behaviors
and by comparing them with those behaviors of the crude oil.
First, the small amplitude oscillatory measurements were
carried out to track the evolutions of the viscoelasticity during
the cooling and the subsequent isothermally holding processes,
and the evolutions of the storage modulus and the loss angle of
the emulsion gels were compared with those of the waxy crude
oil gel. Then, creep and recovery experiments were conducted
within the linear viscoelastic region for emulsions with various
water cuts, and the experimental results were further analyzed
by using a mechanical analogy model. And then, the yield
behaviors of the emulsion gels were investigated by using two
loading modes, i.e., the stress-linearly increased sweep mode
and the constant shear rate loading mode. By the combination
of the experimental results acquired in this study and the
existing knowledge of the structural properties of the gels, the
mechanisms of the structural behaviors of waxy crude oil
emulsion gels were discussed and further understood.
Table 1. Physical Properties of the Studied Waxy Crude Oil
parameter
value
density at 20 °C (kg/m3)
pour point (°C)
gelation temperature (°C)
WAT (°C)
wax (wt %)
resins (wt %)
asphaltenes (wt %)
894.7
33.0
31.3
42.2
18.16
8.13
1.91
Products - Laboratory Determination of Density - Hydrometer
Method. The pour point was tested according to the standard
ASTM D5853-11 Standard Test Method for Pour Point of Crude Oils.
The gelation temperature, i.e., the temperature at which the loss
modulus equals the storage modulus, was tested by the small
amplitude oscillatory measurement while the sample was cooled at a
rate of 0.5 °C/min.22−25
The wax appearance temperature (WAT) and the precipitated wax
concentration were determined by the differential scanning calorimetry
(DSC) technique with the apparatus of Q20 (TA Instruments, USA).
Tests were performed from 80 °C to −20 °C at a cooling rate of 5 °C/
min. The calorimetric signal recorded by the computer with the
software from TA Instruments was used to determine the WAT and
the precipitated wax concentration at a certain temperature.26−29 The
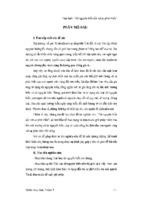
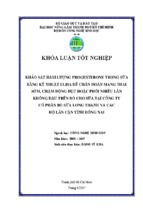
cumulative precipitated wax concentration at a given temperature was
determined as follows. First, the total heat released in the phase change
from WAT to the given temperature was obtained by integrating the
area between the heat flow curve and the baseline. Then the
corresponding precipitated wax concentration was calculated with the
total released heat divided by the enthalpy of wax precipitation, which
is recommended to be 210 J/g for crude oils with a complex mixture of
paraffins.26,28 The cumulative precipitated wax concentrations at
different temperatures are shown in Figure 1.
2. EXPERIMENTAL SECTION
Figure 1. Cumulative precipitated wax concentration vs temperature
by the DSC technique.
2.1. Materials. A typical waxy crude oil with high paraffin content
was used in this study to prepare emulsions. Ultrapure water was used
as the dispersed phase. No emulsifier was added in the preparation of
the emulsions.
During the preparation of the emulsions by stirring, the
volatilization of the light components of the crude oil may occur,
which will inevitably influence the rheological properties of the oil and
the emulsions. To eliminate this effect, the light components were first
removed as follows. The crude oil was poured into a beaker without a
seal and then was stirred at a rotating speed of 1000 rpm at 80 °C for 2
h to make the light hydrocarbons fully evaporate.
Then, for better repeatability of experimental results, the memory
effects for the thermal and shear history of the crude oil were removed
by heating the oil samples up to 80 °C and holding for 2 h, and then
leaving the samples cooled quiescently and maintained at room
temperature for at least 48 h before they were used for experiments. 21
The main physical properties of the pretreated crude oil are listed in
Table 1. The density of the oil sample was measured according to the
standard ISO 3675-1998 Crude Petroleum and Liquid Petroleum
The measurements of resins and asphaltenes content were
performed according to the standard ASTM D4124-09 Standard
Test Method for Separation of Asphalt into Four Fractions.
2.2. Emulsion Preparation and Stability. The crude oil and
water were preheated in a water bath at 50 °C for 30 min and then
were added into a 200 mL beaker sequentially according to the
required volume ratios. The total volume of water and crude oil was
kept at 50 mL. Emulsification was performed using an IKA RW20
digital stirrer (IKA group, Germany) equipped with a four-blade
paddle which was kept at a fixed position in the mixtures.
A polarizing microscope (Nikon OPTIPHOT2-POL, Nikon Corp.,
Japan), configured with a Linkam PE60 Peltier thermal stage (Linkam
Scientific Instruments Ltd., UK) with a temperature range from −20
to 90 °C and control stability within ± 0.1 °C, was used to observe the
microscopic structure of waxy crude oil emulsions. The observation
proceeded as follows. First, the thermal stage of the microscope was
3719
dx.doi.org/10.1021/ef500534r | Energy Fuels 2014, 28, 3718−3729
Energy & Fuels
Article
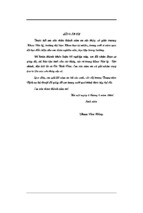
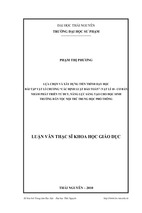
Figure 2. (a, b) Examples of photographed microscopic images of emulsions.
preheated to 30 °C for 5 min. Second, the specimen was spread by a
cell scraper onto a glass slide which had been placed on the preheated
thermal stage. Third, the water droplets were photographed with a
CoolSNAP 3.3 M digital charge-coupled device (CCD) color camera
(Roper Scientific, Inc., Sarasota, FL, US) connected to a computer.
Eight photographs were taken at different positions of each slide, and
two slides were prepared with every emulsion specimen, i.e., totally 16
microscopic images were obtained for each specimen. Examples of the
microscopic images are shown in Figure 2.
The number and size of droplets in every microscopic image were
analyzed by the software Image J (National Institute of Mental Health,
Rockville, US). The Sauter mean diameter was obtained by calculating
all the droplets of the 16 microscopic images.
Different stirring speeds were used in order to obtain similar mean
droplet sizes among different water cut samples (Table 2).
2.3. Dynamic Viscoelasticity Measurements. In this study, all
the rheological measurements of the waxy crude oil and its emulsions
were performed by using a HAAKE Mars III rheometer (Thermo
Fisher Scientific Inc., Germany) equipped with the Z38TiP coaxial
cylinder geometry. Temperature was controlled by a HAAKE AC200
circulating water bath (Thermo Fisher Scientific Inc., Germany).
The sample was loaded into the measuring system preheated at 50
°C and kept for 10 min, and then it was cooled to the measurement
temperature at a cooling rate of 0.5 °C/min. Rheological measurements were performed after the specimen was kept at the test
temperature for 45 min to ensure that the growth of the structure
reached equilibrium, shown in Figure 7 below. During the cooling and
isothermal process, the small amplitude oscillatory measurement was
performed at a constant frequency (1 Hz) to track the changes of
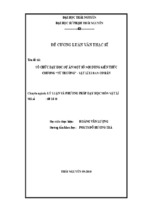
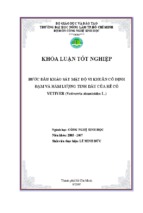
viscoelastic parameters with temperature and aging time. The strain
amplitude sweep tests were carried out at different temperatures to
determine the linear viscoelastic region. As shown in Figure 3, the
storage moduli at different temperatures stay approximately the same
when the strains are less than 0.001. Therefore, the oscillatory
measurements were determined to be carried out at a strain amplitude
of γ = 0.0005.
2.4. Creep and Recovery Tests. Creep tests were first conducted
under different stresses to determine the linear viscoelastic region at 28
°C. The results showed that the deformation of the crude oil and the
emulsions could be guaranteed within the linear region under a stress
of 1 Pa. Therefore creep and recovery tests were carried out by
applying a constant stress of 1 Pa for 600 s and then unloading and
allowing the samples to relax for 900 s. The deformation per unit
stress, called compliance, was determined.
2.5. Measurements of the Yield Behaviors. In this study, we
investigated the evolution of the yield behaviors not only with the
increase of water cut but also with the decrease of temperature which
represents the increase of the amount of precipitated wax.
The controlled stress mode was used to observe the evolution of the
yield behaviors with the variation of the water cut. The stress was
loaded at a linearly increasing rate of 1.2 Pa/min from 0 Pa until the
Table 2. Mean Droplet Sizes of Emulsions with Different
Water Cuts
water cut (vol %)
D32 (μm)
10
20
30
40
50
60
6.59
6.54
6.60
6.43
6.40
6.48
Furthermore, to ensure the validity and repeatability of rheological
measurements, the emulsions must be stable during the whole
measurement process. For this purpose, the prepared emulsions were
transferred into a colorimetric tube and maintained at 50 °C in a water
bath. No water separation was observed in 6 h. Moreover, the samples
in the measuring system of the rheometer were observed after every
rheological experiment to ensure that no oil−water separation
occurred.
Figure 3. Storage modulus vs shear strain in strain amplitude sweep tests at (a) 32 and (b) 25 °C.
3720
dx.doi.org/10.1021/ef500534r | Energy Fuels 2014, 28, 3718−3729
Energy & Fuels
Article
sample yielded. During this process, the evolution of the strain was
recorded.
The controlled shear rate mode was employed to determine the
yield stress and the yield strain of emulsion gels. The yield stress is
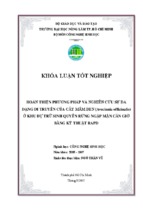
defined as the maximum in the stress versus strain curve, and the yield
strain is the strain at which the yield stress is reached,6,30 as illustrated
in Figure 4. To eliminate the influence of the magnitude of the applied
existence of water droplets. When the temperature is lowered
to 25 °C, the loss angle of the crude oil decreases to 18°
rapidly, while that of the 50% water cut emulsion decreases to
11° at a slower rate. This change reflects the growing
contribution of wax crystals to the elasticity.
It is well-known that the formation of wax crystal structure
makes the storage modulus dramatically increase with
decreasing temperature for waxy crude oils. It can then be
deduced that the water droplets also contribute to the
formation of the structure of waxy crude oil emulsions, making
the storage modulus begin to increase rapidly at higher
temperatures and the loss angle become less. This can also be
drawn from the change of the gelation temperature with the
water cut (Figure 6).
Figure 4. Schematic of the yield point by the controlled shear rate
mode.
shear rate on the measured values of yield stress and yield strain, a
constant shear rate of 0.1 s−1 was chosen to be applied to the sample
until it yielded. According to Paso et al.,30,31 yield stress values
obtained by applying a shear rate of 0.1 s−1 or less are nearly identical.
3. RESULTS AND DISCUSSION
3.1. Contribution of the Dispersed Water to the
Viscoelasticity of Emulsion Gels. For waxy crude oils, it has
been known that the storage and loss moduli increase
dramatically with decreasing temperature.22,23,32 Figure 5
illustrates the evolutions of the storage modulus and the loss
angle with temperature for emulsions with different water cuts.
It is clear that the viscoelastic changes of the emulsions with
temperature have the same trend as those of the waxy crude oil.
However, the storage modulus grows up and the loss angle
decreases with the increase of the dispersed water. Meanwhile,
the storage modulus begins to increase and the loss angle
begins to decrease rapidly at higher temperatures with
increasing water cut. For instance, the storage modulus of the
waxy crude oil tends to increase rapidly at about 26 °C, while
for the 20% water cut emulsion this temperature is about 28 °C,
and it rises to about 32 °C for the 50% water cut emulsion. At
the WAT (42.2 °C), the loss angle of the crude oil is almost
90°, while that of the 50% water cut emulsion is only 49°,
which reflects the enhancement of elasticity due to the
Figure 6. Gelation temperature of waxy crude oil emulsions with the
water cut.
During the isothermal holding after a waxy crude oil is
cooled to required temperature, the storage modulus increases
rapidly in the early period, and then the increasing rate
gradually slows with time elapsing. This phenomenon of
storage modulus growth is called aging.25,32 Coutinho33 and
Silva25 et al. maintained that the aging of wax is related to the
Ostwald ripening of the paraffin crystals, a mechanism by which
the large crystals grow at the expense of the melting of the small
crystals with higher energy. Figure 7a demonstrates that the
storage modulus of the emulsions above the WAT almost stays
unchanged with time elapsing, which means no aging happens
during this period when the paraffin crystals have not yet
precipitated. After paraffins precipitated from the waxy crude oil
emulsions, whether above (Figure 7b) or below (Figure 7c) the
gelation temperature, the aging phenomenon exists. By defining
the time needed for the storage modulus to grow up to 95% of
the final value as the aging time, it can be observed from Figure
Figure 5. (a, b) Evolutions of storage modulus and loss angle with water cut during the cooling process.
3721
dx.doi.org/10.1021/ef500534r | Energy Fuels 2014, 28, 3718−3729
Energy & Fuels
Article
Figure 7. (a−c) Evolution of storage modulus with isothermal holding time.
where G′ is the storage modulus of the emulsions, Pa; G0′ is the
storage modulus of the waxy crude oil at the corresponding
temperature, Pa; φ is the volume fraction of the dispersed
water; A and B are fitting parameters whose values at different
temperatures are listed in Table 3.
In eq 2, parameter A represents the storage modulus’s
dependence on the dispersed droplets. It decreases with
decreasing temperature, which means the contribution of
droplets to the structural strength is reduced while the
contribution of wax crystals is enhanced with increasing
precipitated wax. For example, at 38 °C, the storage modulus
of the 60% water cut emulsion is 130.6 times larger than that of
the waxy crude oil, but at 25 °C, the ratio is reduced to 6.8.
Mathematically, the parameter B in eq 2 represents the ratio
of G′ to G0′ when the water cut φ is reduced to 0. Therefore, B
should equal to unity physically. However, we can see from
Table 3 that B increases with decreasing temperature. The
deviation of B from unity and its increase with decreasing
temperature may be attributed to the interactions between the
wax crystals and the water droplets. More specifically, the
amount of wax crystals is little at 38 and 36 °C, so the
contribution of wax crystals is tiny. But when the precipitated
wax is abundant, e.g., 3.19 wt % at 25 °C, besides the
interactions among wax crystal particles themselves and further
the formation of the wax crystal network, part of the crystals
will absorb at the interface of water droplets.6,8,18,35,36 This
absorption strengthens the interface, contributing largely to the
G′ and hence the elasticity of the emulsions.
3.2. Creep and Recovery Behaviors. In order to further
understand the viscoelasticity of the emulsion gels, the creep
and recovery tests were carried out within the linear viscoelastic
region with the results shown in Figure 10.
In the literature, the Burger mechanical-analogy model, i.e.,
the association in series of a Maxwell model and a Kelvin−
Voigt model, was often used to describe the creep behaviors of
gels.14,15,37,38 For some food emulsion gels, it was found that
8 that the aging time becomes shorter with the increase of the
dispersed water. This phenomenon is similar to that reported
Figure 8. Aging time vs water cut.
by Haj-shafiei et al. 18 who found the time needed for the yield
stress to reach equilibrium was shorter for higher water cut
emulsion gels of model oil.
After the structure equilibrium is reached, a good exponential
relation exists between the storage modulus and the water cut
at each temperature, as is shown in Figure 9. By referring to the
definition of the relative viscosity for the disperse system,34 we
define a relative storage modulus by dividing the storage
modulus of the emulsion by that of the waxy crude oil at the
corresponding temperature, as is shown in eq 1. Then the
relation of the relative storage modulus with the water cut can
be well expressed by eq 2.
Gr′ =
G′
G0′
Gr′ = Be Aφ
(1)
(2)
3722
dx.doi.org/10.1021/ef500534r | Energy Fuels 2014, 28, 3718−3729
Energy & Fuels
Article
Figure 9. (a−d) Storage modulus vs water cut at different temperatures.
Table 3. Fitting Parameters of eq 2 at Different
Temperatures
temperature (°C)
A
B
R2
38
36
32
25
8.316
7.672
3.499
1.826
1.0308
1.1061
1.6802
2.2120
0.990
0.992
0.966
0.996
Figure 11. Comparison of the experimental values and the curve fitted
by the Burger model for the 40% water cut emulsion gel.
J (t ) =
⎡
⎛ −tG ⎞⎤
1
1 ⎢
1 ⎥
⎟⎟
+
1 − exp⎜⎜
η
G0
G1 ⎢⎣
⎝ 1 ⎠⎥⎦
+
Figure 10. Creep-recovery behavior of the waxy crude oil and its
emulsion gels at 28 °C.
⎡
⎛ − tG ⎞⎤
1 ⎢
t
2 ⎥
⎟⎟ +
1 − exp⎜⎜
η0
G2 ⎢⎣
⎝ η2 ⎠⎥⎦
(3)
where J(t) represents the overall compliance at any moment t;
G0 is the instantaneous elastic modulus of the Maxwell element;
G1 and G2 are the elastic moduli of the two Kelvin−Voigt
elements, called retarded elastic moduli; η0 is the residual
viscosity of the dashpot of the Maxwell element; η1 and η2 are
the internal viscosities of the dashpots of the two Kelvin−Voigt
elements respectively.
This model can well depict the creep behavior in the whole
process. As an example, the result for the 40% water cut
emulsion gel is shown in Figure 13. The fitted parameters of
the emulsion gels with different water cuts are listed in Table 4.
As is shown in Table 4, both the instantaneous elastic
modulus G0 and the retarded elastic moduli G1 and G2 increase
with the increase of the water cut, and the viscosities of the
creep behaviors may be better described by the association in
series of one Maxwell model and two Kelvin−Voigt
models.13,17,39 However, the creep and recovery behaviors of
waxy crude oil emulsion gel has not been studied yet. In this
study, we first applied the Burger model to describe the creep
behaviors of the crude oil and its emulsion gels. But the fitting
results showed that this model cannot describe well the
incipience of loading (see Figure 11 for details). So another
Kelvin−Voigt model was associated in series with the Burger
model, as is shown in Figure 12, and the equation of the
compliance of this model is shown as eq 3.
3723
dx.doi.org/10.1021/ef500534r | Energy Fuels 2014, 28, 3718−3729
Energy & Fuels
Article
Figure 12. Schematic of the mechanical analogy model consisted of one Maxwell model and two Kelvin−Voigt models in series.
Figure 14. G0, G1, and G2 in eq 3 vs water cut.
Figure 13. Comparison of the measured values and the curve fitted by
eq 3 for the 40% water cut emulsion gel.
dashpots also increase with the water cut. Similar phenomena
were observed by Dolz et al.14 and Yilmaz et al.15 in their
studies on food emulsion gels. Furthermore, the relations
between the three moduli (G0, G1, and G2) and the water cut φ
are illustrated in Figure 14, showing exponential relations
similar to the G′ obtained from the small amplitude oscillatory
measurement (Figure 9). The existence of dispersed droplets
was considered to be the reason for the increase of the storage
moduli and the viscosities.13−15,40 The spherical water droplets
undergo deformation when shear stress is applied. However,
the recoverable nature of the water droplets, i.e., the
spontaneous tendency that the deformed droplets restore to
their original spherical shape, leads to increased resistance to
further deformation and makes them return to their original
form once the stress is removed.41−43 As a result, the emulsion
becomes more elastic with the increase of water cut. Moreover,
the dragging activity of the water droplets makes deformation
harder to happen in emulsion gels than in crude oil, resulting in
the increase of the viscosities.
As to recovery after creep, the deformation or compliance
can be divided into three sections, as is shown in Figure 15,
where JSM is the instantaneous recovery and corresponds to the
spring of the Maxwell element; JKV is the retarded recovery due
to the Kelvin−Voigt element, tending toward an asymptote for
t → ∞; J∞ is the residual deformation due to the sliding of the
Maxwell dashpot, indicating permanent deformation resulting
from the irreversibility of the viscous deformation.
Figure 15. Recovery of the 20% water cut emulsion gel after the
removal of the applied stress.
According to the theory of mechanical analogy, the recovery
behavior is expected to be symmetrical to the creep behavior if
the deformation is within the linear viscoelastic region.
However, it was often observed that the recovery process
cannot be described by the same parameter values determined
from the creep phase.14,15,17,44,45 In this study this asymmetry
also emerged, so the compliance equation of the association in
series of one Maxwell model and two Kelvin−Voigt models was
reused to fit the recovery data, as is shown in eq 4.
Table 4. Fitted Parameters of Different Water Cut Emulsion Gels by eq 3
water cut (%)
G0 (Pa)
η0 (Pa·s)
G1 (Pa)
η1 (Pa·s)
G2 (Pa)
η2 (Pa·s)
0
20
30
40
50
60
268.6
672.9
1324.7
1667.9
3399.8
5743.6
434747
638680
1577120
1601530
1740130
2752330
891.2
1969.2
3506.9
4018.3
5733.7
10724.6
5766.1
10216.1
18130.7
34890.9
22414.8
137800.6
588.0
1314.4
2200.5
2159.3
5047.4
6255.5
69483.9
136894.8
218390.8
312105.2
363364.5
946199.4
3724
dx.doi.org/10.1021/ef500534r | Energy Fuels 2014, 28, 3718−3729
Energy & Fuels
Article
⎛ t−t ⎞
0
⎟⎟
J(t − t0) = J∞ + JKV1 exp⎜⎜ −
⎝ JKV1η1 ⎠
⎛ t−t ⎞
0
⎟⎟
+ JKV2 exp⎜⎜ −
⎝ JKV2 η2 ⎠
(4)
where t0 is the time at which the creep is terminated, i.e., the
time at which the recovery process begins; J(t − t0) is the
compliance of the recovery phase at the moment t-t0; JKV1 and
JKV2 are the retarded compliances of the two Kelvin−Voigt
elements, respectively; η1 and η2 are the viscosities of the
dashpots of the two Kelvin−Voigt elements, respectively.
As an example, the fitting result of the recovery data of the
20% water cut emulsion gel can be found in Figure 15. The JKV
and J∞ were obtained by the fitting of eq 4, and the JSM was
obtained by using eq 5. After that, the proportion of each part
of the deformation was calculated by using eq 6. The results of
the deformation analysis for the emulsion gels with water cut
up to 60% are shown in Table 5.
JSM = JMAX − JKV − J∞
Figure 16. Evolution of the strain with applied stress at 25 °C.
gel to the ductile yielding of the emulsion gels may be
interpreted from the competition of the roles of the brittle wax
crystal structure and the water droplets, which will be discussed
later in this section.
The yield stress and yield strain at different temperatures
(i.e., different amounts of precipitated wax) were measured by
loading a controlled shear rate of 0.1 s−1. As expected, the yield
stresses of both the crude oil and its emulsions increase
monotonically with increasing amount of precipitated wax and
increasing water cut (see Figures 17 and 18). Besides it should
be pointed out that the emulsions above 40% water cut exhibit
yield behavior even at temperatures above the WAT.
(5)
where JMAX is the maximal compliance in the whole creeprecovery process.
⎡J
⎤
%J = ⎢ element ⎥ × 100
⎢⎣ JMAX ⎥⎦
(6)
where Jelement denotes JSM, JKV1, JKV2, or J∞, respectively.
Table 5. Percentage Participation of Each Element in the
Maximum Compliance
water cut (vol %)
%JSM (%)
%JKV1 (%)
%JKV2 (%)
%J∞ (%)
0
20
30
40
50
60
39.18
41.95
46.72
52.38
57.50
58.11
16.21
16.18
17.06
16.36
17.38
13.32
20.38
19.62
19.26
31.22
25.11
30.03
24.23
22.26
16.96
0.03
0
0
Figure 17. Yield stress of the crude oil and its emulsions vs
precipitated wax.
As can be seen from Table 5, the contribution of the Maxwell
spring (JSM) to the total deformation of the emulsion gels
increases with increasing water cut, and correspondingly the
contribution of J∞ decreases. When the water cut is more than
40%, all deformation produced in the creep phase can actually
be recovered. This clearly indicates that the elasticity of the
emulsion gels increases with increasing water cut, which agrees
well with the results obtained from both the small amplitude
oscillatory and the creep measurements.
3.3. Yield Behavior of Emulsion Gels. For gelled waxy
crude oils, because of the nature of their internal wax crystal
structure, their yield behavior is somewhat like the brittle
fracture.46 As to waxy crude oil emulsion gels, it can be
imagined that their yield behavior will be affected by the
dispersed water phase.
Figure 16 shows the yield processes of the waxy crude oil gel
and its emulsion gels at 25 °C when the shear stress is applied
at an increasing rate of 1.2 Pa/min. Unlike the brittle fracture of
the waxy crude oil gel which is characterized by the sudden
increase of the strain after yielding, the increase of the strain
becomes slower when yielding takes place as the water cut goes
up. This change from the brittle fracturing of the wax crude oil
To further investigate the variation of the yield stress with
temperature, a relative temperature ΔT is defined as follows.
Figure 18. Yield stress vs water cut at different fractions of precipitated
wax.
3725
dx.doi.org/10.1021/ef500534r | Energy Fuels 2014, 28, 3718−3729
Energy & Fuels
Article
Figure 19. (a, b) Yield stress vs relative temperature at different water cuts.
ΔT = Tm − Tg
(7)
where Tm is the measurement temperature; Tg is the gelation
temperature at which the storage modulus G′ equals the loss
modulus G″. Figure 19 demonstrates that the yield stress (τy)
varies exponentially with the ΔT for both the crude oil and its
emulsions, as is expressed in eq 8.
τy = α e−β ΔT
(8)
where obviously the fitted parameter α represents the yield
stress at the gelation temperature, and β characterizes the
increasing rate of structural strength with decreasing temperature.
The values of α and β at different water cuts are listed in
Table 6. It is clear that α increases with increasing water cut,
Figure 20. Evolution of the yield strain of the emulsions with
temperature above and slightly below the WAT.
waxy crude oil decreases monotonically with decreasing
temperature, i.e., with increasing precipitated wax (Figure
21a). The same trend is also observed in the 10% and 20%
water cut emulsions. However, as is shown in Figure 21b, for
the emulsions above 30% water cut and at temperatures below
the WAT, the yield strain first increases and then decreases with
decreasing temperature, i.e., with increasing precipitated wax. In
addition, the turning point of the yield stain moves to lower
temperature with increasing water cut.
The mechanism of this phenomenon may be understood by
considering the change of the yield strain with the amount of
precipitated wax. Above the WAT, the emulsions above 40%
water cut show yield behavior, while those emulsions with
lower water cuts do not. Because of no wax precipitation and
no wax crystal structure, the yield behavior can only be
attributed to the damage of droplet clusters. Below the WAT,
the amount of precipitated wax in the crude oil increases and
the wax crystal network structure becomes more brittle with
decreasing temperature, so the yield strain decreases with
decreasing temperature. The emulsions with low water cuts, i.e.,
10% and 20%, keep this trend as is shown in Figure 21a, but the
variation rate of the yield strain with temperature above 31 °C
obviously decreases with increasing water cut, showing that the
role of the water droplets becomes stronger. However, when
the water cut is increased to or above 30%, as the temperature
decreases, the change of yield mechanism obviously occurs
from the domination of the damage of droplet clusters to the
domination of the fracture of wax crystal network as a result of
the increased amount of precipitated wax and further the
formation of wax crystal network that may entrap the dispersed
water.
To further understand the mechanism of the yield behavior
and the phenomenon of ductility enhancement shown in Figure
16, a recovery experiment was designed as follows for emulsion
Table 6. Fitted Parameters of eq 8 for the Waxy Crude Oil
and Its Emulsion Gels
water cut (vol %)
α (Pa)
β (1/°C)
R2
0
10
20
30
40
50
60
5.73
5.86
6.80
8.19
10.11
10.40
10.48
0.524
0.493
0.463
0.425
0.392
0.346
0.318
0.978
0.982
0.982
0.990
0.988
0.985
0.985
which means that the structural strength of a higher water cut
emulsion at its gelation temperature is stronger than that of a
lower water cut emulsion, although the gelation temperature of
the higher water cut emulsion is higher (Figure 6). Obviously at
the gelation temperature, the precipitated wax fraction of the
higher water cut emulsion is less than that of the lower water
cut emulsion, but the dispersed water phase contributes to the
strength of the gel structure, too. 8 It is also shown in Table 6
that β decreases with increasing water cut, indicating that the
increasing rate of the yield stress with the decreasing
temperature is slower at a higher water cut than at a lower
water cut. This is closely related to the fact that an increase of
the water cut means a decreased proportion of the oil phase
and hence a decreased amount of precipitated wax at the same
temperature.
As to the yield strain, its evolution with temperature below
the WAT is not monotonic for emulsion gels, which is
analogous to neither the waxy crude oil nor the emulsions
without precipitated wax. As is shown in Figure 20, at a
temperature above or slightly below the WAT, the yield strain
of the emulsions increases monotonically with decreasing
temperature. Conversely, below the WAT the yield strain of the
3726
dx.doi.org/10.1021/ef500534r | Energy Fuels 2014, 28, 3718−3729
Energy & Fuels
Article
Figure 21. (a, b) Evolution of the yield strain of the waxy crude oil and the emulsions with temperature below the WAT.
Figure 22. (a−c) Residual strains after recovery from different set strains.
increased (strain from 0.04 to 0.08), and finally section III
when all emulsion gels had yielded (strain larger than 0.08).
The residual strains of the waxy crude oil and its emulsion gels
after recovery from the three sections (represented by the
strains of 0.04, 0.07 and 0.10 respectively) are shown in Figure
22.
It should be noted first that because recovery happens at
strains above 0.04 which is far beyond the linear viscoelastic
region, the relation between the residual strain and the water
cut differs from that shown in Table 5, which is obtained from
the creep recovery test within the linear viscoelastic region.
From Figure 22a, one may see that the residual strain of the
waxy crude oil is less than that of the 10% water cut emulsion
gel after recovery from the strain of 0.04. But when the
specimens recover from the strains of 0.07 and 0.10, the
opposite results are observed; i.e., the residual strain of the
waxy crude oil is higher than that of the emulsions (see Figure
gels with different water cuts. First, shear stress was applied
from zero and at an increasing rate of 1.2 Pa/min to make the
strain of the gels reach a certain value. Once the set strain was
reached, the stress was unloaded immediately and the recovery
process was recorded. The recovery of deformation generally
reached equilibrium after 20 min, and the strain that could not
be recovered after 20 min was designated as the residual strain.
If all the samples are not yielded, their residual strains after
recovery will decrease with the increase of the water cut, i.e. the
increase of the elasticity. Once yielding occurs in some lower
water cut sample which possesses lower yield stress, its residual
strain will become larger than those higher water cut samples
which are not yielded. Therefore, according to the trends of the
residual strains, the ductile yielding process of the gels with
different water cuts could be roughly divided into three
sections, i.e., section I when all gels did not yield (strain less
than 0.04), section II when the emulsion gels yielded
sequentially from low water cut to high water cut as the strain
3727
dx.doi.org/10.1021/ef500534r | Energy Fuels 2014, 28, 3718−3729
Energy & Fuels
Article
22b,c). This difference may be attributed to the different
natures of the wax crystal structure and the water droplets.
For the waxy crude oil gel, because of the brittle nature of the
wax crystal structure and the structure breakdown after yielding,
the deformation of the fractured gel may recover less. For
instance, for the yielded waxy crude oil gel which recovers from
the strain of 0.10, only 20.4% of the strain can be recovered.
This may be compared with 75.4% of the strain recovery from
the strain of 0.04, which is nearly the same proportion with that
in the linear viscoelastic region (Table 5). However, for waxy
crude oil emulsion gels, the entire volume is spanned by a wax
crystal network which entraps the dispersed water.6,8,20 As a
result, the shear stress and strain are shared by both the water
droplets and the wax crystal structure. Because of the
contribution of water droplets, the yielded emulsion gels
show stronger recoverability of deformation than the waxy
crude oil gel.
As to the recoverability of the emulsion gels which is
dependent upon the water cut, it can be seen from Figure 22a
that when the emulsion gels recover from the strain of 0.04, i.e.,
for the unyielded emulsion gels, the residual strain decreases
with the increase of water cut. On the contrary, when the
emulsion gels recover from the strain of 0.10, i.e., for the
yielded emulsion gels, the residual strain increases with the
increase of water cut (see Figure 22c). And accordingly when
the emulsion gels recover from the strain of 0.07, a turning
point appears at the water cut of 40%, as can be seen in Figure
22b. In fact, in this case the samples below the 40% water cut
have yielded, but the samples with higher water cuts are
unyielded. That is to say, in the unyielded region the variation
of the residual strain with the water cut is consistent with that
shown in Figure 22a, whereas in the yielded region the trend is
just the same as that shown in Figure 22c.
This may be interpreted according to the contribution of the
water droplets to the elasticity of the emulsion gels. For those
unyielded gels, the elasticity is increased with increasing water
cut, which has been demonstrated by the above-discussed
creep-recovery experiments. However, after the yielding of the
emulsion gels, the initiation of flow will result in the breakage of
water droplet clusters and further the coalescence of droplets,
as is shown in Figure 23 by the enlarged droplet sizes. This
Table 7. Viscoelastic Parameters of the Emulsion Gels with
the Water Cuts of 20% and 50% after the Stress Is Loaded to
γ = 0.04 and γ = 0.10
after stress loaded to
γ = 0.04
after stress loaded to
γ = 0.10
water cut (vol%)
G′ (Pa)
loss angle (o)
G′ (Pa)
loss angle (o)
20
50
4110
6770
12.34
9.12
2905
3730
16.06
14.37
by 29.3%, and the loss angle increases by 30.1% when the strain
is increased from 0.04 to 0.10. However, for the emulsion gel
with a high water cut (50%), the storage modulus decreases by
44.9% and the loss angle increases by 57.6% under the same
conditions, which means the high water cut emulsion gel loses
more elasticity after yielding due to the more coalescence of
droplets.
4. CONCLUSION
The viscoelastic and yield behaviors of waxy crude oil and its
emulsion gels were investigated, and their mechanisms were
discussed based on experiments and comparisons. In summary,
the rheological behaviors are dramatically changed because of
the existence and deformation of the dispersed water droplets
in combination with the precipitation of wax crystals and
further the formation of a structure with wax crystals and water
droplets.
By small amplitude oscillatory measurements, it is found that
the structure is strengthened and becomes more elastic after the
crude oil is emulsified. Specifically speaking, as the water cut of
the emulsion increases, the storage modulus grows up while the
loss angle decreases, and the emulsion gels at a higher
temperature. Meanwhile, the structure builds up more quickly.
An exponential relation is found between the storage modulus
and the water cut.
The creep-recovery experiments within the linear viscoelastic
region further demonstrate the enhancement of elasticity. With
the increase of water cut, the residual strain after recovery
decreases and even vanishes when the water cut is above 40%.
Both the creep and recovery behavior may well be described by
a mechanical analogy model with one Maxwell model and two
Kelvin−Voigt models associated in series. However, the
parameters fitted by the creep data cannot describe well the
recovery behavior, as is reported in many other works.
The emulsion gels show different yield behaviors from the
gelled waxy crude oil. First, the yield process shows that the
emulsion gel becomes more ductile with increasing water cut,
compared to the brittle-fracture-like yielding of the waxy crude
oil gel. Second, the yield stresses of both the crude oil and the
emulsion gels increase monotonically with the increase of
precipitated wax and water cut, while the yield strains show
different trends. For the emulsions with few wax particles, the
yield strain increases monotonically with decreasing temperature. Conversely, for the waxy crude oil and the emulsions at
low water cuts, when many wax particles precipitate, the yield
strain decreases monotonically with decreasing temperature.
However, in the same temperature region, for the emulsions
above 30% water cut, the yield strain first increases and then
decreases with decreasing temperature. This is due to the
change of the yield mechanism from the domination of the
damage of droplet clusters to the domination of the fracture of
wax crystal network with precipitated paraffins increased.
Figure 23. (a, b) Microscopic images of the 30% water cut emulsion
gel after rheological tests corresponding to Figure 22, panels a and c
respectively (25 °C).
leads to the emulsions becoming less elastic, and accordingly
the deformation is less recoverable. And because more droplets
may coalesce at higher water cuts due to the breakdown of the
structure and the flow, the higher the water cut is, the more
elasticity the emulsion loses after yielding. This is proved by the
change of the viscoelastic parameters before and after the
emulsion gels yield, as is shown in Table 7. For the emulsion
gel with a low water cut (20%), the storage modulus decreases
3728
dx.doi.org/10.1021/ef500534r | Energy Fuels 2014, 28, 3718−3729
Energy & Fuels
■
Article
(33) Coutinho, J. A.; Lopes da Silva, J. A.; Ferreira, A.; Rosário
Soares, M.; Daridon, J. Pet. Sci. Technol. 2003, 21, 381−391.
(34) Broughton, G.; Squires, L. J. Phys. Chem. 1938, 42, 253−263.
(35) Lee, R. F. Spill Sci. Technol. B. 1999, 5, 117−126.
(36) Mouraille, O.; Skodvin, T.; Sjöblom, J.; Peytavy, J. L. J.
Dispersion Sci. Technol. 1998, 19, 339−367.
(37) Chang, S. Q.; Li, D.; Lan, Y.; Ozkan, N.; Shi, J.; Chen, X. D.;
Mao, Z. H. Int. J. Food Eng. 2009, 5 (DOI: 10.2202/1556-3758.1561).
(38) Xu, Y. L.; Xiong, S. B.; Li, Y. B.; Zhao, S. M. J. Food Eng. 2008,
86, 10−16.
(39) Gallegos, C.; Franco, J. M. Rheol. Ser. 1999, 8, 87−118.
(40) Otsubo, Y.; Prud’homme, R. K. Rheol. Acta 1994, 33, 29−37.
(41) Derkach, S. R. Adv. Colloid Interface Sci. 2009, 151, 1−23.
(42) Li, X.; Pozrikidis, C. J. Fluid Mech. 1997, 34, 165−194.
(43) Oldroyd, J. G. Proc. R. Soc. London A 1953, 218, 122−132.
(44) Diez-Sales, O.; Dolz, M.; Hernandez, M. J.; Casanovas, A.;
Herraez, M. J. Appl. Polym. Sci. 2007, 105, 2121−2128.
(45) Manconi, M.; Mura, S.; Manca, M. L.; Fadda, A. M.; Dolz, M.;
Hernandez, M. J.; Casanovas, A.; Díez-Sales, O. Int. J. Pharm. 2010,
392, 92−100.
(46) Wardhaugh, L. T.; Boger, D. V. J. Rheol. 1991, 35, 1121−1156.
AUTHOR INFORMATION
Corresponding Author
*Tel: 86-10-8973-4627. Fax: 86-10-8973-4627. E-mail:
[email protected].
Notes
The authors declare no competing financial interest.
■
■
ACKNOWLEDGMENTS
Support from the National Natural Science Foundation of
China (No. 51134006) is gratefully acknowledged.
REFERENCES
(1) Gafonova, O. V.; Yarranton, H. W. J. Colloid Interface Sci. 2001,
241, 469−478.
(2) Spiecker, P. M.; Gawrys, K. L.; Trail, C. B.; Kilpatrick, P. K.
Colloids Surf., A 2003, 220, 9−27.
(3) Yang, X.; Verruto, V. J.; Kilpatrick, P. K. Energy Fuels 2007, 21,
1343−1349.
(4) Kane, M.; Djabourov, M.; Volle, J. L.; Lechaire, J. P.; Frebourg, G.
Fuel 2003, 82, 127−135.
(5) Venkatesan, R.; Ö stlund, J. A.; Chawla, H.; Wattana, P.; Nydén,
M.; Fogler, H. S. Energy Fuels 2003, 17, 1630−1640.
(6) Paso, K.; Silset, A.; Sørland, G.; Gonçalves, M. D. A.; Sjöblom, J.
Energy Fuels 2009, 23, 471−480.
(7) Tinsley, J. F.; Jahnke, J. P.; Dettman, H. D.; Prud’home, R. K.
Energy Fuels 2009, 23, 2056−2064.
(8) Visintin, R. F.; Lockhart, T. P.; Lapasin, R.; D’Antona, P. J. NonNewtonian Fluid Mech. 2008, 149, 34−39.
(9) de Oliveira, M. C. K.; Carvalho, R. M.; Carvalho, A. B.; Couto, B.
C.; Faria, F. R.; Cardoso, R. L. Energy Fuels 2010, 24, 2287−2293.
(10) Pal, R. J. Colloid Interface Sci. 2000, 231, 168−175.
(11) Farah, M. A.; Oliveira, R. C.; Caldas, J. N.; Rajagopal, K. J. Pet.
Sci. Eng. 2005, 48, 169−184.
(12) Dou, D.; Gong, J. J. Pet. Sci. Eng. 2006, 53, 113−122.
(13) Gladwell, N.; Rahalkar, R. R.; Richmond, P. Rheol. Acta 1986,
25, 55−61.
(14) Dolz, M.; Hernández, M. J.; Delegido, J. Food Hydrocolloid
2008, 22, 421−427.
(15) Yilmaz, M. T.; Karaman, S.; Dogan, M.; Yetim, H.; Kayacier, A.
J. Food Eng. 2012, 108, 327−336.
(16) Gladwell, N.; Rahalkar, R. R.; Richmond, P. J. Food Sci. 1985,
50, 1477−1481.
(17) Bayarri, S.; Dolz, M.; Hernández, M. J. J. Appl. Polym. Sci. 2009,
114, 1626−1632.
(18) Haj-shafiei, S.; Ghosh, S.; Rousseau, D. J. Colloid Interface Sci.
2013, 410, 11−20.
(19) Rønningsen, H. P. Energy Fuels 2012, 26, 4124−4136.
(20) Oh, K.; Deo, M. D. Fuel 2011, 90, 2113−2117.
(21) Yan, D.; Luo, Z. SPE Prod. Eng. 1987, 11, 267−276.
(22) Lionetto, F.; Coluccia, G.; D’Antona, P.; Maffezzoli, A. Rheol.
Acta 2007, 46, 601−609.
(23) Kane, M.; Djabourov, M.; Volle, J. L. Fuel 2004, 83, 1591−1605.
(24) da Silva, M. A.; Arêas, E. P. G. J. Colloid Interface Sci. 2005, 289,
394−401.
(25) da Silva, J. A. L.; Coutinho, J. A. P. Rheol. Acta 2004, 43, 433−
441.
(26) Yi, S.; Zhang, J. Energy Fuels 2011, 25, 1686−1696.
(27) Li, H.; Zhang, J. Fuel 2003, 82, 1387−1397.
(28) Bai, C.; Zhang, J. Energy Fuels 2013, 27, 752−759.
(29) Juyal, P.; Cao, T.; Yen, A.; Venkatesan, R. Energy Fuels 2011, 25,
568−572.
(30) Zhao, Y.; Kumar, L.; Paso, K.; Ali, H.; Safieva, J.; Sjöblom, J. Ind.
Eng. Chem. Res. 2012, 51, 8123−8133.
(31) Paso, K.; Kompalla, T.; Oschmann, H. J.; Sjöblom, J. J.
Dispersion Sci. Technol. 2009, 30, 472−480.
(32) Visintin, R. F.; Lapasin, R.; Vignati, E.; D’Antona, P.; Lockhart,
T. P. Langmuir 2005, 21, 6240−6249.
3729
dx.doi.org/10.1021/ef500534r | Energy Fuels 2014, 28, 3718−3729